Abstract
Background & Aims:
Hepatocellular carcinoma (HCC) is the most common type of primary liver cancer with limited therapeutic options. Here, we investigated the mechanisms of HCC in response to ROS1-targeted therapy.
Methods:
Recombinant RNases were purified, and the ligand-receptor relationship between RNase7 and ROS1 was validated in HCC cell lines by Duolink, immunofluorescence, and immunoprecipitation assays. Potential interacting residues between ROS1 and RNase7 were predicted by protein-protein docking approach. Oncogenic function of RNase7 was analyzed by cell proliferation, migration, invasion assays and xenograft mouse model. The anti-ROS1 inhibitor treatment efficacy was evaluated in HCC patient-derived xenograft (PDX) and orthotopic models. Two independent HCC patient cohorts were analyzed to evaluate the pathological relevance by immunohistochemistry. Plasma level of RNase7 in HCC patient was detected by ELISA.
Results:
RNase7 associated with ROS1’s N3-P2 domain and promoted ROS1-mediated oncogenic transformation. HCC patients exhibited elevated plasma RNase7 levels compared with normal subjects. High ROS1 and RNase7 expression were highly associated with poor prognosis in HCC. In both HCC PDX and orthotopic mouse models, ROS1 inhibitor treatment markedly suppressed RNase7-induced tumorigenesis and led to decreased plasma RNase7 level with tumor shrinkage in mice.
Conclusions:
RNase7 serves as a high-affinity ligand for ROS1, and plasma RNase7 has the potential to function as a biomarker to stratify HCC patients for anti-ROS1 treatment.
Keywords: ROS1, ribonuclease 7, plasma biomarker, hepatocellular carcinoma, crizotinib
Lay Summary:
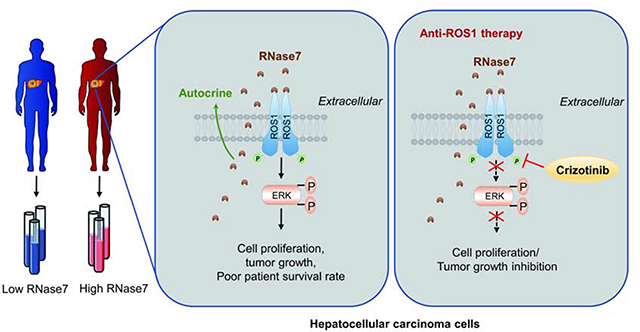
RNase7 triggers oncogenic transformation in HCC cells by binding to ROS1. Our findings suggest that ROS1 has the potential to serve as therapeutic target in HCC and that HCC patients with high plasma level of RNase7 may be benefit from treatment with ROS1 inhibitor.
Graphical Abstract
Introduction
C-ros oncogene 1 (ROS1) was originally discovered as a receptor tyrosine kinase (RTK) more than 25 years ago, and it is currently the last orphan receptor with kinase activity in the RTK family1, 2. To date, functional studies of ROS1 in human cancers have primarily focused on the ROS1 fusion protein due to the absence of a natural ligand3–7. All ROS1 fusion proteins retain the kinase domain, and most of their partners have dimerization domains, presumably leading to constitutive tyrosine kinase activation8. Notably, the ROS1 fusion gene is a successful therapeutic target with high objective response rate in ROS1-rearranged non-small-cell lung cancer (NSCLC)9, suggesting that identifying the ROS1 ligand is critical to not only fully understand the biological significance of wild-type (WT) ROS1 activation but also examine whether WT ROS1 could be a cancer therapeutic target. Recent studies demonstrated that RNase5, a member of the ribonuclease A superfamily, functions as a ligand for epidermal growth factor receptor 10, 11 and the transmembrane receptor plexin-B212, raising the possibility that the ligand for ROS1 could be an RNase.
Recently, ROS1 was reported to be highly expressed in a rat hepatoma cell line13, and increased ROS1 phosphorylation was observed in patients with cholangiocarcinoma 5, indicating that dysregulation of ROS1 signaling may contribute to the development of liver cancer. Multiple small-molecular multi-kinase inhibitors, such as sorafenib, lenvatinib, regorafenib and cabozantinib 14, have been approved by the US Food and Drug Administration in first or second-line treatments for HCC. However, they only improved the median OS durations in HCC patients by a few months with less than 20% overall response rates 14–16. Thus, identifying effective targeted therapies for HCC to further improve clinical outcomes is an unmet medical need.
Materials and Methods
Clinical samples.
For survival analysis, two independent cohorts of HCC patients at Fudan Liver Cancer Institute (Shanghai, China) were used. Cohort 1 consisted of 150 HCC patients who underwent surgical resection from January 2009 to March 2010, and cohort 2 consisted of 110 patients who underwent surgical resection from June 2012 to September 2012. The patients in both cohorts were monitored after surgery in the Liver Surgery Department at Zhongshan Hospital, Fudan University (Shanghai, China). Detailed clinicopathological features of the patients are listed in Supplementary Tables 1 and 3. Paired plasma samples from the patients in cohort 2 (n=110) and normal person (n=50) were analyzed using an enzyme-linked immunosorbent assay (ELISA) to measure RNase7 levels. Informed consent was obtained from patients and use of tissue microarray and plasma samples was approved by the Research Ethics Committee of Zhongshan Hospital.
Animal studies.
All animal studies were performed in accordance with guidelines approved by the MD Anderson Institutional Animal Care and Use Committee (Protocol number: 00001334-RNO1 and 00001250-RNO1). All mice were fed standard laboratory chow and housed in a specific-pathogen-free facility with a 12-h/12-h light/dark cycle and given free access to food and water. For an in vivo tumorigenesis assay, six nude mice per group were subcutaneously injected with 2 × 10⁶ stable NIH-3T3 cells or 1 × 10⁶ stable HepG2 cells as indicated. Tumor volumes were monitored using external calipers and calculated using the formula (length × width2)/2. For the subcutaneous model, 2 groups of 12 nude mice were subcutaneously injected with 5 × 10⁶ stable Huh7-vector or Huh7-RNase7 cells. Tumor-bearing mice in both groups were further placed in two groups (n = 6/group) for treatment with or without crizotinib (50 mg/kg/day). Treatment was administrated via oral gavage every day for 3 weeks. Tumor volume was monitored every 2 days after crizotinib administration on day 10. For the orthotopic model, subcutaneous Huh7-vector, Huh7-RNase7 or HepG2 tumors were cut into cubes (1 mm3) under aseptic conditions. Next, single cubes were inoculated into the liver parenchyma of nude mice anesthetized using isoflurane. Mice were treated with or without crizotinib 5 days after inoculation. Subcutaneous tumors were measured using calipers, and orthotopic tumors were evaluated using a Bruker 7T magnetic resonance imaging scanner. The response to crizotinib in HepG2-orthotopic model was determined by comparing tumor volume change at scarified time to its baseline: % tumor volume change = ΔVolt = 100% × ((Vterminal – Vinitial) / Vinitial). The criteria for response (mRECIST) were adapted from RECIST criteria17. For PDX model, fresh PDX tumor tissue fragments were transplanted in nude mice. Tumors were then allowed to reach a size of ~100 mm3. Mice were randomized into two groups with vehicle or crizotinib (50 mg/kg/day) treatment for 4 weeks. At the experimental endpoint, mice were killed using CO2 exposure followed by cervical dislocation, and their tumors were excised for subsequent histological analysis.
Additional materials and methods can be found in the Supplementary Materials and Methods
Results
RNase7 acts as a ligand of ROS1 in HCC
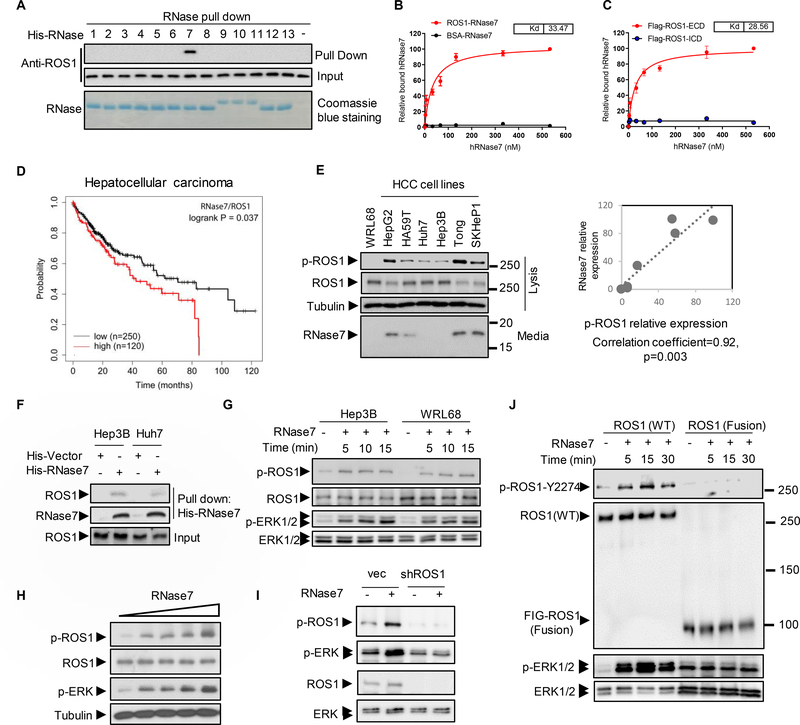
To investigate whether RNases family proteins has potential to be a ligand of ROS1, pull down assay was performed using recombinant RNases individually. Of the entire 13 RNases, RNase7 was the only one consistently and specifically pulled down by ROS1 (Fig. 1A). The dissociation constant (Kd) of RNase7 for full-length ROS1 (33.5 nM) and for ROS1 ECD (28.5 nM) were within the range of Kd for high-affinity ligands of RTKs (< 100 nM) (Fig. 1B–C). Consistently, co-immunoprecipitation assay results demonstrated that the ECD but not the ICD of ROS1 bound to RNase7 (Fig. S1A–B). Next, by analyzing the relationship between co-expression of ROS1 and RNase7 (ROS1/RNase7) and overall survival (OS) or progression-free survival (PFS) using a Kaplan-Meier plotter, we found the OS in patients with HCC with high expression of ROS1/RNase7 was worse than that in those with low expression of ROS1/RNase7 (Fig. 1D). Additionally, similar OS or PFS results were found in lung squamous cell carcinoma and ovarian cancer (Fig. S1C). Patients with high RNase7 or ROS1 alone showed different prognosis in different cancer types (Fig. S1D), suggesting ROS1/RNase7 axis is critical for tumorigenesis.
Fig. 1. RNase7 triggers ROS1 signaling activation in HCC cells.
(A) In vitro binding assay of HEK293T cell lysates incubated with a histidine (His)-tagged plasmid expressing RNases (RNase1–RNase13) or an empty vector (His). (B, C) RNase7 binding to Flag-tagged full-length ROS1 (B) and the ECD of ROS1 (C). The Kd for the RNases and ROS1 domains was determined using a saturation binding assay. (D) Kaplan-Meier (KM) estimates of OS for HCC patients in relation to expression of both ROS1 and RNase7 mRNA. The statistical analysis of time-to-event data with the expression of ROS1/RNase7 (hazard ratio, 1.45 [95% confidence interval, 1.02–2.07]) in HCC was estimated. (E) Left, expression of ROS1, p-ROS1, and secreted RNase7 protein in HCC cells. Right, intensity of RNase7 expression and quantification of p-ROS1 in HCC cells determined using a densitometer. (F) Pull-down assay and Western blot analysis of the interaction between ROS1 and RNase7 in Hep3B and Huh7 cells. Cell lysates were incubated with His-tagged recombinant RNase7 or vector. (G) Immunoblotting of Hep3B and WRL68 cells treated with RNase7 (1 μg/ml) at indicated time points. (H) Immunoblotting of Hep3B cells treated with increasing concentrations (0.1, 0.2, 0.5, and 1 μg/ml) of RNase7 for 5 min. (I) Knockdown of ROS1 in Hep3B cells inhibited RNase7-induced ROS1 and ERK phosphorylation. (J) Western blot analysis of indicated protein expression levels in WT ROS1-expressing cells and U118MG cells.
The carboxyl-terminal tyrosine residue 2274 (Y2274) of ROS1 upon genetic ROS1 alterations leads to its constitutive activation18, 19. Therefore, we measured the levels of phospho-ROS1 (p-ROS1) in multiple HCC cell lines and found that RNase7 was positively correlated with ROS1 activity (Fig. 1E). The association between RNase7 and ROS1 in Huh7 and Hep3B cells (Fig. 1F), as well as the increased level of p-ROS1 and p-ERK1/2 by RNase7 treatment in ROS1 WT cells (Fig. 1G–H) but not in ROS1-knockdown cells (Fig. 1I) or in those harboring FIG-ROS1 fusion (Fig. 1J), further indicated a ligand role of RNase7 in stimulating ROS1 activation in HCC. Next, we treated Hep3B cells with secreted WT or catalytic-deficient mutant (H123A) RNase7 (Fig. S1E–G). Similar levels of ROS1 activation (Fig. S1H) and binding (Fig. S1I) in the cells were observed, indicating that RNase7 acts as an ROS1 ligand independently of its catalytic activity.
RNase7 binds to ROS1 extracellular N3-P2 domain
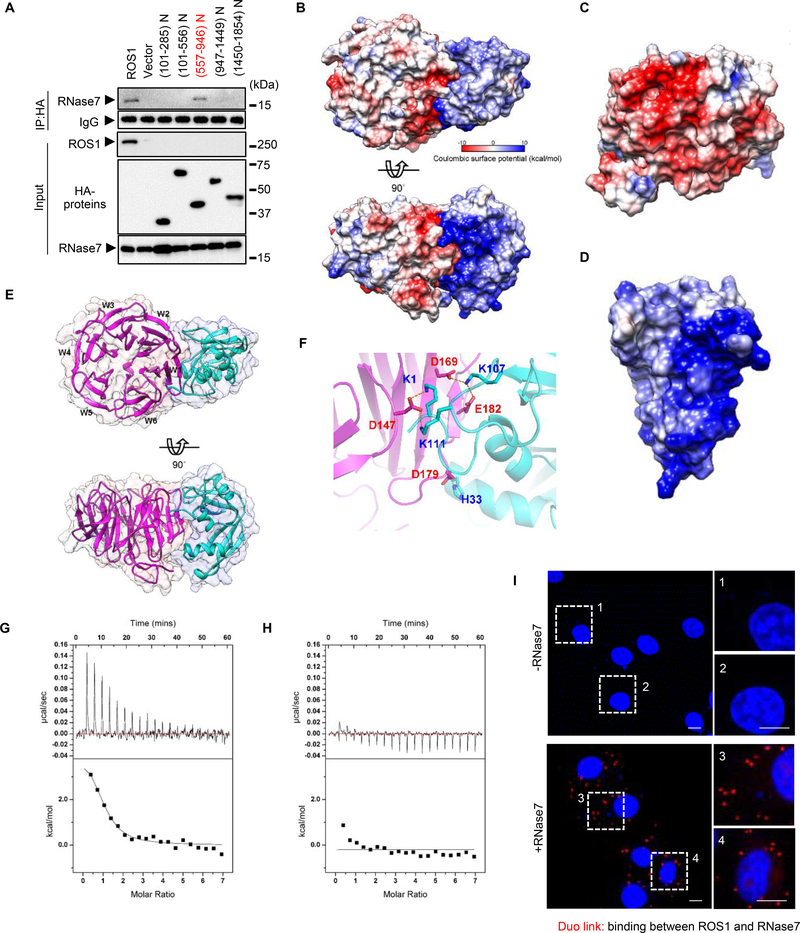
To identify the domain in the ECD region critical for RNase7 binding, we generated a series of fragments of the ROS1 ECD for binding analyses (Fig. S2A). Compared with WT ROS1, the ROS1 N3-P2 (ROS1_P2) domain (amino acids 557–946) exhibited similar binding to RNase7, whereas other domains of the ROS1 ECD exhibited a complete loss of binding to RNase7 (Fig. 2A). In addition, we measured the electrostatic surface of RNase 7 and ROS1 and unexpectedly observed the interacting residues on RNase7 are all positively charged and those from ROS1 all negatively charged (Fig. 2B). Concave and positively charged surface of RNase7 (a lock) is highly complementary to the convex and negatively charged surface of ROS1_P2 (a key) at the binding interface (Fig. 2C– D). The homology model of ROS1_P2 shows a typical β-propeller domain with RNase7 binding to the W1 and W2 sides instead of the top or bottom face of ROS1_P2 (Fig. 2E), and the positively or negatively charged amino acids are evenly distributed on the surface of ROS1_P1 and ROS1_P3 in contrast to that of ROS1_P2 which contains a large negatively charged patch (Fig. S2B–D). Mutations of K1, K107 and K111 in RNase7 (Fig. 2F) diminished the interaction with the ROS1_P2 (Fig. 2G–H), supporting that the electrostatic interaction is critical for the RNase7 and ROS1 binding. Moreover, results from Duolink assay (Fig. 2I) and immunofluorescence staining (Fig. S2E) further supported the binding between RNase7 and ROS1. Taken together, these findings suggested that ROS1_P2 domain is sufficient for ROS1 binding to RNase7.
Fig. 2. RNase7 associates with ROS1 aa 557–946.
(A) HA-tagged ROS1 truncations depicted in the top scheme were co-transfected with Flag-tagged RNase7 in HEK-293T cells. (B) Top and side view of electrostatic potential surface of ROS1_P2 (homology model, left) and RNase7 (PDB: 2HKY, right). (C, D) Electrostatic potential surface of ROS1_P2 (C) and RNase7 (D). Blue for positive potential (10 kcal/mol), red for negative (−10 kcal/mol) and white for neutral. (E) Top and side view of ribbon diagram of ROS1_P2 (magenta) and RNase7 (cyan). (F) Expanded interface view of docked ROS1_P2-RNase7 complex. Residues are drawn in stick representation and labeled (blue for RNase7; red for ROS1_P2). Atoms of positively charged residues are shown in cyan and of negatively charged residues in magenta. Electrostatic bonds are connected by dotted lines in orange. (G) Significant heat absorption was observed when WT RNase7 was titrated into the cell containing ROS1_P2. (H) Changing the residues of RNase7 (K1A, K107A, and K111A) practically abolished ROS1_P2 binding to a level that is undetectable by ITC. (I), Ectopically ROS1-expressing HeLa cells were treated with or without RNase7 (1 μg/ml) for 15 min, and subjected to a Duolink assay. Scale bar, 10 μm. Right, two different positions were randomly selected at each point.
RNase7-activated WT ROS1 induces transcriptional changes and downstream signaling activation similar to FIG-ROS1 rearrangement in HCC cells
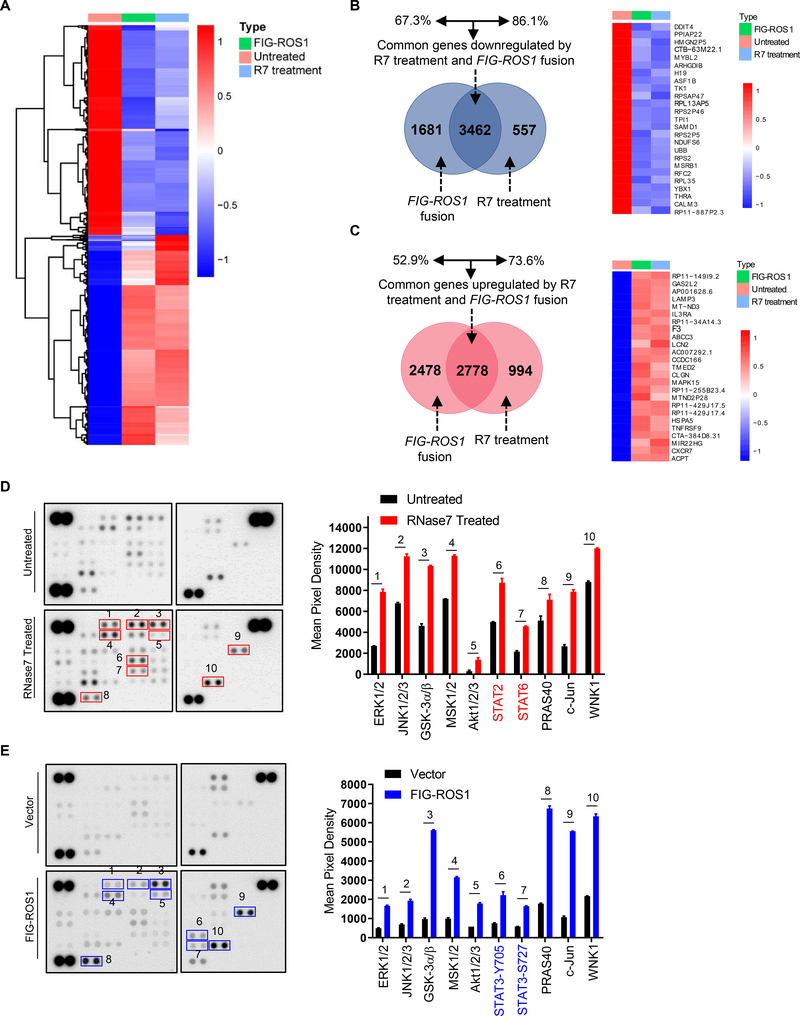
To gain further mechanistic insights into the role of RNase7 and compare the whole-transcriptome between RNase7-induced WT ROS1 and ROS1 fusion cells, we constructed a FIG-ROS1 fusion gene for expression in Hep3B HCC cell line (Fig. S3A–B). Deep sequencing results revealed a high similarity in transcriptome changes between FIG-ROS1 rearrangement and RNase7 treatment such that a common set of genes was upregulated or downregulated by both FIG-ROS1 fusion and RNase7 treatment (Fig. 3A). Venn diagram analysis of the affected genes indicated a high percentage of overlap between RNase7 treatment and ROS1 rearrangement, suggesting that RNase7-induced ROS1 activation resembles ROS1 fusion in modulating cellular functions (Fig. 3B–C). Further comparison of the kinase profile indicated a similar pattern of signaling node phosphorylation, such as ERK (ERK1/2) and AKT (AKT1/2/3), in both RNase7-treated WT ROS1 cells and FIG-ROS1 fusion cells (Fig. 3D–E), suggesting RNase7 triggers WT-ROS1 downstream kinase activation similar to that of FIG-ROS1 rearrangement. Meanwhile, the glioblastoma cell line U118MG, which naturally expresses the FIG-ROS1 gene fusion 20, did not respond to RNase7 stimulation (Fig. S3C). Several kinases whose phosphorylation was increased in RNase7-treated WT ROS1 cells exhibited decreased phosphorylation in U118MG cells after ROS1 inhibitor treatment (Fig. S3D). All of these results indicated that RNase7 elicits ROS1 signaling transduction that are similar to FIG-ROS1 fusion-induced gene transcription in HCC cells.
Fig. 3. Whole-transcriptome and kinase array analysis reveal similar pattern of transcriptional change and downstream signaling activation between RNase treatment and FIG-ROS1 rearrangement.
(A) Heat map of the top 5,000 genes expressed in Hep3B cells under R7 treatment (1h) or FIG-ROS1 rearrangement. (B, C) Left, Venn diagram highlighting the similarities and differences in genes that are downregulated (B) or upregulated (C) by R7 treatment and FIG-ROS1 rearrangement. Right, top 25 significant downregulated or upregulated genes in R7 stimulation and FIG-ROS1 fusion groups compared to control group. (D, E) Left, results of a human phospho-kinase array analysis of Hep3B cells with or without 5 min RNase7 treatment (D), or of FIG-ROS1-expressing fusion cells (E). Right, mean pixel densities of the top 10 upregulated kinases.
ROS1 is required for RNase7-triggered oncogenic functions
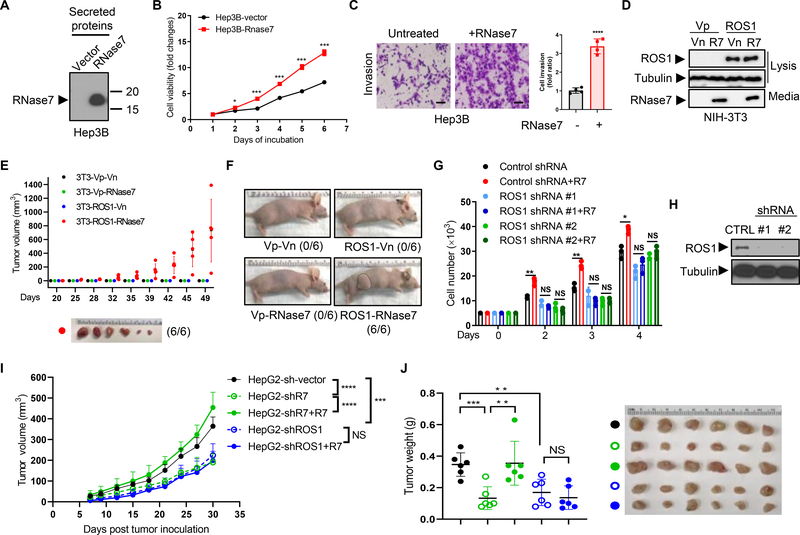
To validate the biological activity of this RNase7-ROS1 ligand receptor interaction in HCC, we established stable expression of RNase7 in Hep3B (Fig. 4A) and Huh7 (Fig. S4A) cells, and observed enhanced viability (Fig. 4B and Fig. S4B) in cells ectopically expressing RNase7. In addition, cell proliferation (Fig. S4C–D), mobility (Fig. S4E), and invasion (Fig. 4C and Fig. S4F) were also significantly increased in cells upon RNase7 treatment. Consistently, knockdown of RNase7 by shRNAs in HepG2 cells successfully impeded colony formation, whereas the phenotype was rescued by recombinant RNase7 addition (Fig. S4G–H). Knockdown of RNase7 also decreased cell viability compared with vector control cells (Fig. S4I). To specifically address the ROS1 and RNase7 relationship, we established stable NIH-3T3 clones, including those ectopically expressing ROS1 or RNase7 alone, or both ROS1 and RNase7 (Fig. 4D). Cells expressing both ROS1 and RNase7 were considerably more viable than those expressing ROS1 or RNase7 alone (Fig. S4J), and generated transformed subcutaneous tumors in nude mice (Fig. 4E–F). These results supported RNase7 as a bona fide ROS1 ligand that promotes tumorigenesis in vivo.
Fig. 4. ROS1 is required for RNase7-induced in vivo tumorigenesis.
(A) Immunoblot of secreted RNase7 in Hep3B cells with stable ectopic RNase7 expression. (B) Hep3B-hRNase7 and Hep3B-vector cells cultured for the indicated times and subjected to cell viability assay. (C) Left, representative images of a cell invasion assay of Hep3B cells treated with or without RNase7 at a concentration of 1 μg/ml for 24 h. Scale bar, 200 μm. Right, quantification of cell invasion. (D) Immunoblot of lysates and secreted proteins (from culture media) in stable NIH-3T3 cells expressing the indicated plasmids. Vn, neomycin-resistant vector; Vp, puromycin-resistant vector. (E) Tumor growth in nude mice (n = 6/group) subcutaneously injected with stable NIH-3T3 cells at the indicated time points. Representative images of tumors are shown below. (F) Representative images of mice subcutaneously injected with stable NIH-3T3 cell lines. (G) The number of stable Hep3B cells treated with or without RNase7 and counted at the indicated time points. (H) ROS1 expression level in two Hep3B stable cell lines expressing ROS1 shRNA or expressing an empty vector (CTRL). (I) Tumor growth in mice (n = 6/group) subcutaneously injected with the indicated HepG2 cells. Reconstitution of RNase7 in HepG2-shRNase7 stable cells were performed by lentivirus infection. (J) left, tumor weight of the indicated mice groups in (I); right, representative images of mouse tumors.
Error bars represent mean ± SD. *P < 0.05, **P < 0.01, ***P < 0.001, ****P < 0.0001, Student’s t-test. NS, not significant.
To test ROS1-dependent activity of RNase7, we knocked down ROS1 in Hep3B cells by two individual ROS1-specific shRNAs. Knocking down ROS1 attenuated RNase7-mediated promotion of cell proliferation (Fig. 4G–H), colony formation (Fig. S4K), and migration (Fig. S4L), and abolished the protective activity of RNase7 against starvation-induced apoptosis (Fig. S4M), suggesting that ROS1 is required for RNase7-mediated activity. Consistently, reconstitution of RNase7 in the HepG2-sh-RNase7 clone restored the tumor size and weight, but failed to enhance growth of tumors formed by ROS1-knockdown cells (Fig. 4I–J). Taken together, these data demonstrated that ROS1 is essential for the biological activities of RNase7 in HCC.
ROS1 inhibitor treatment attenuates RNase7-induced tumor growth
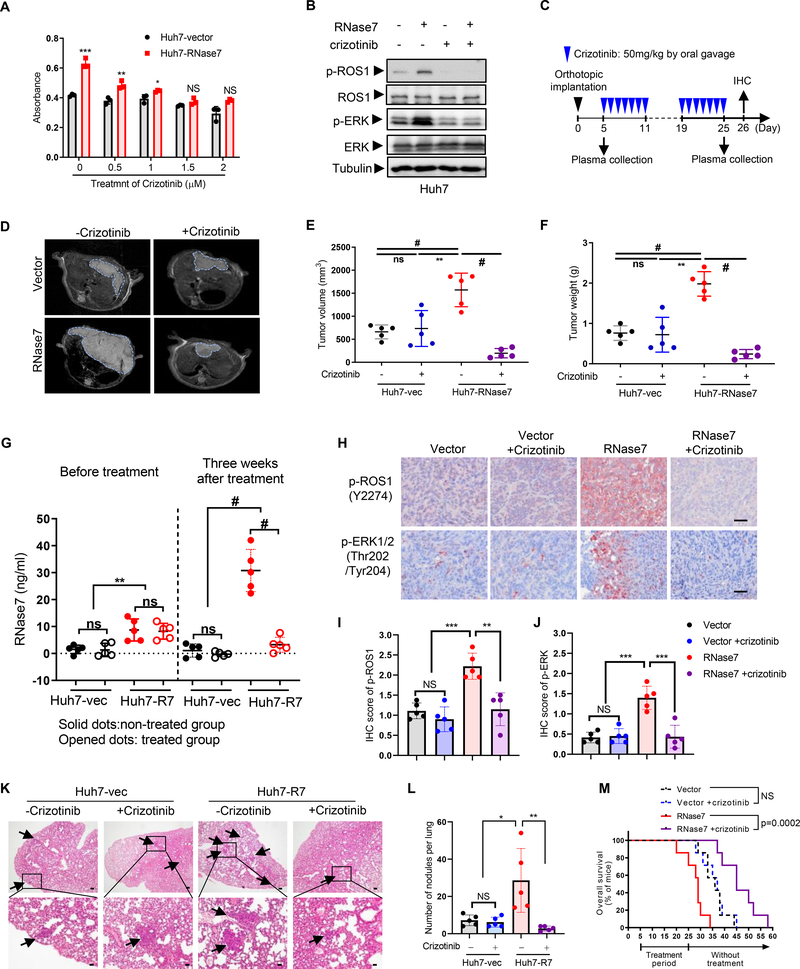
To investigate whether targeting ROS1 can improve therapeutic efficacy against HCC, we evaluated the effects of ROS1 inhibitor on HCC cell viability and tumorigenesis. We found that Huh7/RNase7 stable cells exhibited enhanced viability, which could be repressed by pretreatment with crizotinib or ceritinib (Zykadia; Novartis) (Fig. 5A and Fig. S5A). Increased ROS1 phosphorylation stimulated by RNase7 was inhibited by crizotinib in both Huh7 and WRL68 cells (Fig. 5B and Fig. S5B). Consistently, knockdown of RNase7 in HepG2 cells decreased their viability (Fig. S5C) and sensitivity to crizotinib (Fig. S5D) and ceritinib (Fig. S5E) in vitro.
Fig. 5. Crizotinib effectively inhibits RNase7-induced tumor growth in HCC orthotopic xenograft.
(A) Huh7-hRNase7 or Huh7-vector cells were treated with or without crizotinib at indicated concentrations for 72 h. (B) Huh7 cells pretreated with crizotinib for 2 h followed by RNase7 treatment for 5 min and then subjected to immunoblotting with the indicated antibodies. (C) Schematic of the treatment protocol for crizotinib in the orthotopic model of HCC. (D) MRI analysis of the orthotopic liver tumors of indicated group with or without three weeks crizotinib treatment. (E, F) Tumor size (E) and weight (F) measured at the treatment endpoint. (G) ELISA analysis of RNase7 levels in plasma samples from the indicated groups of mice at Day 5 and Day 25 after tumor implantation. (H) IHC staining from tumors of indicated group of mice stained with the indicated antibodies. Scale bar, 50 μm. (I, J) Quantification of IHC score of p-ROS1 (I) and p-ERK (J) in (H). (K) Representative H&E staining images of lung tissues. Scale bar, 200 μm (top panels) and 50 μm (lower panels). Arrow indicate lung metastatic nodules, and the labeled areas in the upper panel are shown in the lower panel with higher magnification. (L) Bar graph depicting the number of metastatic nodules in the lungs (M) OS durations in mice bearing Huh7 tumors following treatment with or without crizotinib. Log-rank test.
*P < 0.05, **P < 0.01, ***P < 0.001, #P < 0.0001, Student’s t-test, unless otherwise noted.
To validate the antitumor activity of crizotinib in RNase7-expressing HCC cells in vivo, we established xenograft models of HCC by subcutaneously injecting the indicated Huh7 stable cells into mice followed by treatment with or without crizotinib (Fig. S5F). Although mice injected with Huh7/RNase7 cells had larger tumors than did those injected with Huh7/vector cells, their tumors were more sensitive to crizotinib-based treatment with better tumor growth suppression (Fig. S5G) and markedly better OS (Fig. S5H) than the untreated groups. Importantly, the plasma RNase7 levels were reduced considerably after crizotinib-based treatment (Fig. S5I), which was likely due to tumor shrinkage after treatment. Furthermore, we administered crizotinib to mice bearing orthotopic Huh7 tumors (Fig. 5C) which impaired tumor growth and reduced the tumor burden more so in mice with Huh7/RNase7 cells than in those with Huh7/vector cells (Fig. 5D–F), suggesting that the effects of RNase7-induced activation of ROS1 render HCC cells highly sensitive to crizotinib. The levels of plasma RNase7 were higher in mice injected with Huh7/RNase7 cells than in Huh7/vector cells, and crizotinib treatment significantly dampened the elevated RNase7 levels (Fig. 5G), suggesting RNase7 is a detectable plasma biomarker during crizotinib treatment. Moreover, immunohistochemical (IHC) staining of tumors showed that the inhibitory ratio of ROS1 and ERK1/2 phosphorylation was significantly higher in Huh7/RNase7 cells compared with Huh7/vector cells after crizotinib treatment (Fig. 5H–J). A positive IHC staining of HepPar1, a marker for distinguishing HCC cells from other metastatic carcinomas, was observed in lung metastasis sections (Fig. S5J), and the number of lung metastatic nodules increased substantially in mice harboring the Huh7/RNase7 xenografts compared with those with the Huh7/vector xenografts (Fig. 5K–L), and following crizotinib treatment, a significant decrease in lung metastasis was observed in the Huh7/RNase7 group (Fig. 5K–L). Similar to the findings in subcutaneous models, crizotinib markedly prolonged the OS of mice bearing orthotopic Huh7/RNase7 tumors (Fig. 5M). Altogether, these results supported a critical role for the RNase7-ROS1 axis in HCC growth and metastasis and suggested that a high plasma RNase7 level may be associated with ROS1-targeted therapeutic efficacy.
Crizotinib inhibits tumor growth of HCC PDX model with high plasma levels of RNase7
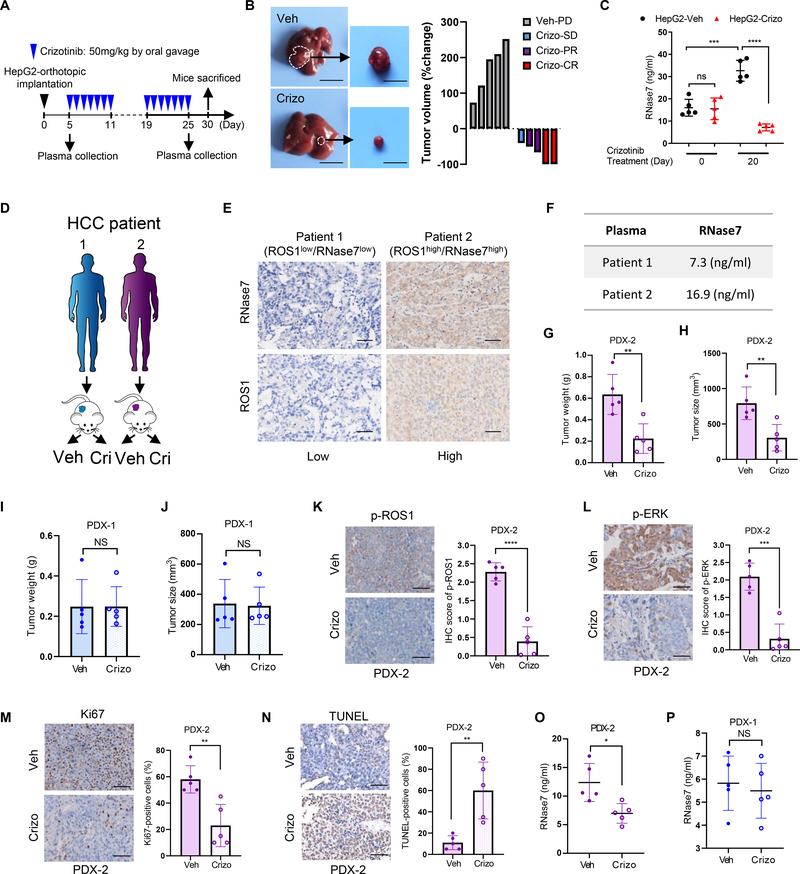
Next, we examined the therapeutic responses to crizotinib by HepG2-orthotopic model due to the high expression level of RNase7/ROS1 and phosphor-ROS1 in HepG2 cells (Fig. 1E). After three weeks administration by crizotinib to mice bearing HepG2 tumor (Fig. 6A), a significantly reduced tumor burden and a good therapeutic response using RECIST-like criteria 21 were observed in mice with crizotinib treatment than in vehicle-treated mice (Fig. 6B), suggesting HepG2 tumors were highly sensitive to crizotinib. Consistent with orthotopic Huh7-tumor model, we found crizotinib treatment dramatically dampened the RNase7 levels, compared with vehicle-treated group (Fig. 6C). Furthermore, we evaluated the efficacy of the crizotinib in two HCC PDX models (Fig. 6D). Based on the IHC scores of patient tumor sections, one PDX (PDX-1) was defined as RNase7low/ROS1low patient, and the other (PDX-2) was defined as RNase7high/ROS1high patient (Fig. 6E). Consistently, RNase7 plasma level and p-ROS1 level was higher in PDX-2 than in PDX-1 (Fig. 6F and Fig. S6A). In PDX-2 model, crizotinib treatment significantly inhibited tumor growth compared with vehicle (Fig. 6G–H and Fig. S6B–C). As expected, crizotinib failed to lead to tumor regression in the PDX-1 model (Fig. 6I–J and Fig. S6D–E). The changes in mice body weight were not significantly different between PDX-1 and PDX-2 (Fig. S6F–G) with or without crizotinib treatment. Tumor growth inhibition by crizotinib in the PDX-2 model was accompanied by decreased p-ROS1 (Fig. 6K) and downstream effector signaling (Fig. 6L), reduced proliferative index Ki67 (Fig. 6M), and increased apoptotic response (Fig. 6N). Notably, crizotinib efficacy was correlated with RNase7 plasma levels in both PDX-1 and PDX-2 (Fig. 6O–P). Collectively, these pre-clinical studies provided a rationale for selecting anti-ROS1 therapy based on RNase7 plasma levels and supported further clinical evaluation of crizotinib in HCC patients.
Fig. 6. RNase7 acts as a plasma biomarker for anti-ROS1 therapy in pre-clinical models.
(A) Schematic of the treatment protocol for crizotinib in the HepG2-orthotopic model. (B) HepG2 orthotopic tumor sensitive to crizotinib treatment. Left: representative images of orthotopic liver tumors with three weeks vehicle or crizotinib treatment. Right: waterfall plot of response to vehicle (n = 5) or crizotinib treatment (n = 5). CR: complete response; PR: partial response; SD: stable disease; PD: progressive disease. (C) ELISA analysis of RNase7 expression levels in plasma samples from the indicated groups of mice at Day 0 and Day 20 after crizotinib treatment. (D) Schematic treatment administration in PDX models. (E) Representative images of ROS1 and RNase7 IHC staining of HCC tissue samples from patients in (D). Scale bar, 50 μm. (F), RNase7 expression levels across HCC PDX models. (G-J) Tumor weight and volume was assessed in PDX-2 (G and H) or in PDX-1 (I and J) after 4-week treatment (vehicle, n = 5; crizotinib, n = 5). (K-N) Decreased p-ROS1 (K) and p-ERK level (L), decreased proliferative index (M) and increased apoptosis (N) were observed in PDX-2 tumors after crizotinib treatment. Left, representative images of indicated staining. Right, quantification result according to IHC score. Scale bar, 50 μm. (O, P) ELISA analysis of RNase7 expression levels in plasma samples from PDX-2 (O) and PDX-1 (P) after 4 weeks crizotinib treatment.
Error bars represent mean ± SD. *P < 0.05, **P < 0.01, and ***P < 0.001, Student’s t-test unless otherwise noted. NS, not significant.
High plasma level of RNase7 positively is correlated with ROS1 activation and poor prognosis in patients with HCC
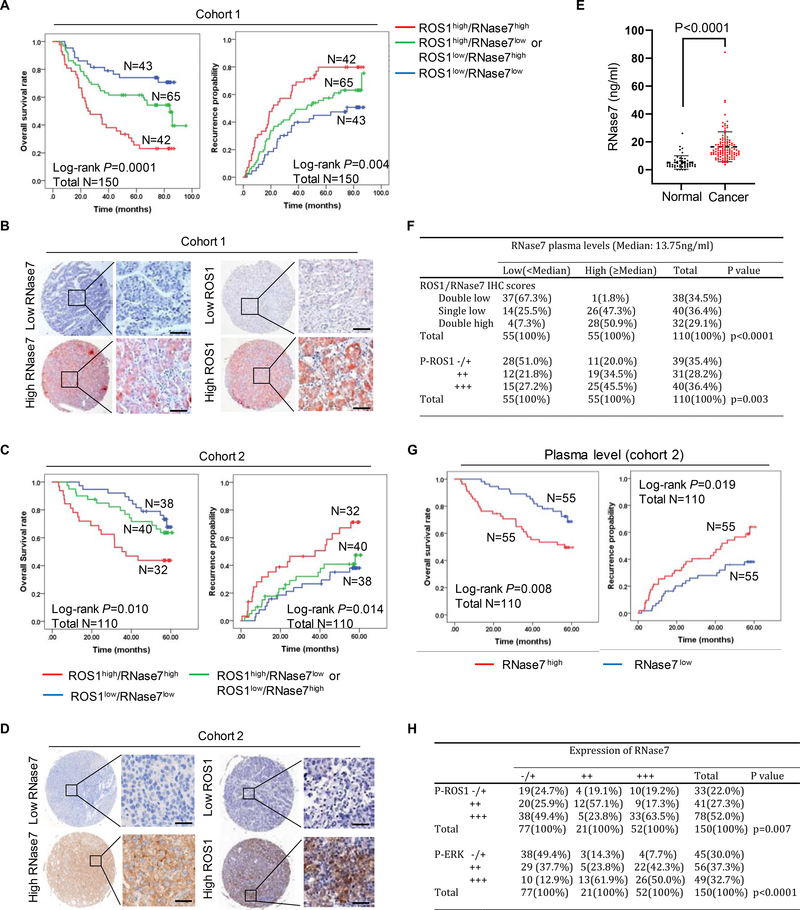
To determine the clinical relevance of the RNase7-ROS1 axis in HCC patients, we performed a tissue microarray-based IHC study of ROS1 and RNase7 expression in 260 HCC samples from two independent cohorts with comparable clinicopathological features and complete follow-up data (Tables S1 and S2). We observed that ROS1high/RNase7high patients had significantly shorter OS duration and time to recurrence in cohort 1 (n = 150; Fig. 7A–B) and cohort 2 (n=110; Fig. 7C–D). Consistently, patients with higher expression of RNase7 or ROS1 had much shorter OS duration and time to recurrence in both cohorts (Fig. S7A–B). Furthermore, paired plasma samples from HCC patients in cohort 2 were evaluated for comparison with samples from normal individuals. The median concentrations of plasma RNase7 in the HCC group (13.75ng/ml) were significantly higher than the normal group (2.17 ng/ml) (Fig. 7E), and a good correlation between plasma RNase7 levels and RNase7/ROS1 tumor status was found in cohort 2 (Fig. 7F and Fig. S7C). What’s more, patients with higher plasma RNase7 level (≥Median) had significantly shorter OS duration and time to recurrence (Fig. 7G), suggesting that plasma RNase7 is a potential biomarker for HCC patients. Cox proportional-hazards regression analysis demonstrated that ROS1high/RNase7high status was an independent predictor of OS and time to recurrence in both cohorts (Table S3 and 4). These results suggested patients with ROS1high/RNase7high status have poor prognosis and that the RNase7-ROS1 axis may play an important role in HCC progression.
Fig. 7. High expression of ROS1/RNase7 correlates with poor survival in patients with HCC.
(A) OS and recurrence probability of patients in cohort 1 based on the status of ROS1/RNase7 expression. (B) Representative images of IHC staining for ROS1 and RNase7 expression in HCC sections from cohort 1. Scale bar, 50 μm. (C) OS and recurrence probability of patients in cohort 2. (D) Representative images of IHC staining for RNase7 and ROS1 expression in HCC sections from cohort 2. Scale bar, 50 μm. (E) ELISA analysis of RNase7 expression in plasma samples from HCC patients (n = 110) or normal individuals (n = 50). (F) Relationship between RNase7 plasma level and IHC score of ROS1/RNase7 or p-ROS1 in cohort 2. Correlations were performed using the Pearson Chi-Square test. (G) OS and recurrence probability of patients in cohort 2 based on RNase7 plasma level. (H) Relationship between RNase7 expression and IHC scores of p-ROS1 or p-ERK in cohort 1.
Next, we evaluated the correlation among RNase7 expression, p-ROS1 Y2274, and p-ERK Thr202/Tyr204 in HCC tissue sections. We verified the specificity of the phosphorylation antibodies used for IHC staining by demonstrating that anti-p-ROS1 Y2274 staining can be neutralized by the corresponding tyrosine phosphorylated peptide but not the corresponding non-phosphorylated peptide or a random tyrosine phosphorylated peptide (Fig. S7D–E). Of note, RNase7 expression was positively correlated with p-ROS1 Y2274 and p-ERK Thr202/Tyr204 expression (Fig. 7H and Fig. S7F). Positive correlation between plasma RNase7 and p-ROS1 was obtained from cohort 2 (Fig. 7F and Fig. S7G). Taken together, our findings demonstrated that RNase7 acts as a ligand to stimulate ROS1 signaling activation, leading to increased cell proliferation and tumor growth. Targeting ROS1 by crizotinib may be a potentially effective therapeutic approach for HCC patients with high RNase7 expression.
Discussion
Several studies have examined the signaling pathways that are activated by ROS1 fusion proteins results in autophosphorylation of ROS1 and phosphorylation of SHP-2, ERK, STAT3, and AKT22–24. Our data demonstrated that RNase7 triggers WT-ROS1 downstream kinase activation similar to that of FIG-ROS1 rearrangement in HCC (Fig. 3D–E), suggesting ROS1 signaling-activated tumor growth and survival pathways in ROS1-rearranged cells is also triggered by RNase7 in ROS1 WT cells. Interestingly, we observed increased activation of STAT2 and STAT6 signaling in RNase7-treated cells and that of STAT3 in FIG-ROS1 cells (Fig. 3D–E). Those findings suggested a differential mechanism through which the ligand-induced ROS1 and ROS1 fusion activate the STAT signaling pathway. Because activation of STAT2 or STAT6 is critical for antiviral innate immunity25, 26 and that RNase 7 has been reported to exhibit antiviral activity27, this raises a potentially interesting physiological function of the ROS1 pathway in the RNase7-mediated antimicrobial immunity to be further pursued in the future.
In HCC PDX and orthotopic mouse models of HCC, we showed that crizotinib exhibits potent anti-tumor activity in the mice harboring RNase7-expressing tumors (Fig. 5 and Fig. 6). In addition, clinical data analysis indicated that ROS1 and RNase7 co-expression occurs in about 30% of HCC patients and is highly correlated with poorer survival (Fig. 7A and C). Moreover, high plasma levels of RNase7 are positively correlated with ROS1 phosphorylation in approximately 45% of tumor tissues from HCC patients (Fig. 7F), suggesting at least 30% of those patients with HCC harboring RNase7/ROS1 activation may benefit from crizotinib treatment.
In addition to HCC, it would be interesting to see whether RNase7 level is elevated in patients with chronic liver diseases because RNase7 expression is upregulated by cytokines stimuli 28 and increased in patients with surgical sepsis 29 or inflammatory skin diseases 30. Analysis of TCGA data revealed that 59% of patients with ovarian cancer and 40% of patients with lung squamous carcinoma exhibit high expression level of RNase7/ROS1, which is correlated with poor survival (Fig. S1C). High levels of ROS1 expression in 33–40% of surgically resected glioblastomas31, 32 and increased ROS1 expression in mice with early- and late-stage lung tumors33 have also been reported. ROS1 is upregulated in chemically induced stomach tumors34 and breast fibroadenomas from five different patients35. Large-scale studies with patient sample screening are warranted to determine whether targeting the RNase7-ROS1 axis is a potentially effective therapeutic strategy for all major cancer types. The current report provides the scientific basis to clinically test this possibility.
Supplementary Material
Highlight:
High RNase7 level is positively correlated with poor prognosis in HCC patient.
RNase7 acts as a ligand via binding and interacting with its receptor ROS1.
RNase7-mediated ROS1 activation triggers oncogenic transformation.
High RNase7 level serves as a plasma biomarker for anti-ROS1 therapeutically selectivity for HCC patient.
Acknowledgements
We thank the Department of Scientific Publications at The University of Texas MD Anderson Cancer Center for editing this manuscript. This work was funded in part by National Institutes of Health Cancer Center Support Grant P30CA016672; The University of Texas MD Anderson Cancer Center China Medical University and Hospital Sister Institution Fund; YingTsai Young Scholar Award (CMU108-YTY-02); the Shanghai International Science and Technology Collaboration Program (18410721900); The Ministry of Health and Welfare, China Medical University Hospital Cancer Research Center of Excellence (MOHW108-TDU-B-212-124024; MOHW108-TDU-B-212-122015); and the National Natural Science Foundation of China (81472672).
Financial support statement: This work was funded in part by National Institutes of Health Cancer Center Support Grant P30CA016672; The University of Texas MD Anderson Cancer Center China Medical University and Hospital Sister Institution Fund (to M.-C.H.); YingTsai Young Scholar Award (CMU108-YTY-02; to J.-M.H.); the Shanghai International Science and Technology Collaboration Program (18410721900; to N.R.); The Ministry of Health and Welfare, China Medical University Hospital Cancer Research Center of Excellence (MOHW108-TDU-B-212-124024; MOHW108-TDU-B-212-122015 to S.-C.W.); and the National Natural Science Foundation of China (81472672; to N.R.).
Footnotes
Conflict of interest statement: The authors declare no competing interests;
Publisher's Disclaimer: This is a PDF file of an unedited manuscript that has been accepted for publication. As a service to our customers we are providing this early version of the manuscript. The manuscript will undergo copyediting, typesetting, and review of the resulting proof before it is published in its final form. Please note that during the production process errors may be discovered which could affect the content, and all legal disclaimers that apply to the journal pertain.
Data availability statement:
The data used to support the findings of this study are included and available within the article.
References
- 1.Lemmon MA, Schlessinger J. Cell signaling by receptor tyrosine kinases. Cell 2010;141:1117–34. [DOI] [PMC free article] [PubMed] [Google Scholar]
- 2.Green JL, Kuntz SG, Sternberg PW. Ror receptor tyrosine kinases: orphans no more. Trends Cell Biol 2008;18:536–44. [DOI] [PMC free article] [PubMed] [Google Scholar]
- 3.Charest A, Lane K, McMahon K, Park J, Preisinger E, Conroy H, et al. Fusion of FIG to the receptor tyrosine kinase ROS in a glioblastoma with an interstitial del(6)(q21q21). Genes Chromosomes Cancer 2003;37:58–71. [DOI] [PubMed] [Google Scholar]
- 4.Rikova K, Guo A, Zeng Q, Possemato A, Yu J, Haack H, et al. Global survey of phosphotyrosine signaling identifies oncogenic kinases in lung cancer. Cell 2007;131:1190–203. [DOI] [PubMed] [Google Scholar]
- 5.Gu TL, Deng X, Huang F, Tucker M, Crosby K, Rimkunas V, et al. Survey of tyrosine kinase signaling reveals ROS kinase fusions in human cholangiocarcinoma. PLoS One 2011;6:e15640. [DOI] [PMC free article] [PubMed] [Google Scholar]
- 6.Birch AH, Arcand SL, Oros KK, Rahimi K, Watters AK, Provencher D, et al. Chromosome 3 anomalies investigated by genome wide SNP analysis of benign, low malignant potential and low grade ovarian serous tumours. PLoS One 2011;6:e28250. [DOI] [PMC free article] [PubMed] [Google Scholar]
- 7.Lee J, Lee SE, Kang SY, Do IG, Lee S, Ha SY, et al. Identification of ROS1 rearrangement in gastric adenocarcinoma. Cancer 2013;119:1627–35. [DOI] [PubMed] [Google Scholar]
- 8.Uguen A, De Braekeleer M. ROS1 fusions in cancer: a review. Future Oncol 2016;12:1911–28. [DOI] [PubMed] [Google Scholar]
- 9.Shaw AT, Ou SH, Bang YJ, Camidge DR, Solomon BJ, Salgia R, et al. Crizotinib in ROS1-rearranged non-small-cell lung cancer. N Engl J Med 2014;371:1963–71. [DOI] [PMC free article] [PubMed] [Google Scholar]
- 10.Wang YN, Lee HH, Hung MC. A novel ligand-receptor relationship between families of ribonucleases and receptor tyrosine kinases. J Biomed Sci 2018;25:83. [DOI] [PMC free article] [PubMed] [Google Scholar]
- 11.Wang YN, Lee HH, Chou CK, Yang WH, Wei Y, Chen CT, et al. Angiogenin/Ribonuclease 5 Is an EGFR Ligand and a Serum Biomarker for Erlotinib Sensitivity in Pancreatic Cancer. Cancer Cell 2018;33:752–769 e8. [DOI] [PMC free article] [PubMed] [Google Scholar]
- 12.Yu W, Goncalves KA, Li S, Kishikawa H, Sun G, Yang H, et al. Plexin-B2 Mediates Physiologic and Pathologic Functions of Angiogenin. Cell 2017;171:849–864 e25. [DOI] [PMC free article] [PubMed] [Google Scholar]
- 13.Yovchev MI, Grozdanov PN, Joseph B, Gupta S, Dabeva MD. Novel hepatic progenitor cell surface markers in the adult rat liver. Hepatology 2007;45:139–49. [DOI] [PubMed] [Google Scholar]
- 14.Zhu XD, Sun HC. Emerging agents and regimens for hepatocellular carcinoma. J Hematol Oncol 2019;12:110. [DOI] [PMC free article] [PubMed] [Google Scholar]
- 15.Bruix J, Qin S, Merle P, Granito A, Huang YH, Bodoky G, et al. Regorafenib for patients with hepatocellular carcinoma who progressed on sorafenib treatment (RESORCE): a randomised, double-blind, placebo-controlled, phase 3 trial. Lancet 2017;389:56–66. [DOI] [PubMed] [Google Scholar]
- 16.Llovet JM, Ricci S, Mazzaferro V, Hilgard P, Gane E, Blanc JF, et al. Sorafenib in advanced hepatocellular carcinoma. N Engl J Med 2008;359:378–90. [DOI] [PubMed] [Google Scholar]
- 17.Therasse P, Arbuck SG, Eisenhauer EA, Wanders J, Kaplan RS, Rubinstein L, et al. New guidelines to evaluate the response to treatment in solid tumors. European Organization for Research and Treatment of Cancer, National Cancer Institute of the United States, National Cancer Institute of Canada. J Natl Cancer Inst 2000;92:205–16. [DOI] [PubMed] [Google Scholar]
- 18.Charest A, Kheifets V, Park J, Lane K, McMahon K, Nutt CL, et al. Oncogenic targeting of an activated tyrosine kinase to the Golgi apparatus in a glioblastoma. Proc Natl Acad Sci U S A 2003;100:916–21. [DOI] [PMC free article] [PubMed] [Google Scholar]
- 19.Ali ZA, de Jesus Perez V, Yuan K, Orcholski M, Pan S, Qi W, et al. Oxido-reductive regulation of vascular remodeling by receptor tyrosine kinase ROS1. J Clin Invest 2014;124:5159–74. [DOI] [PMC free article] [PubMed] [Google Scholar]
- 20.Rimkunas VM, Crosby KE, Li D, Hu Y, Kelly ME, Gu TL, et al. Analysis of receptor tyrosine kinase ROS1-positive tumors in non-small cell lung cancer: identification of a FIG-ROS1 fusion. Clin Cancer Res 2012;18:4449–57. [DOI] [PubMed] [Google Scholar]
- 21.Gao H, Korn JM, Ferretti S, Monahan JE, Wang Y, Singh M, et al. High-throughput screening using patient-derived tumor xenografts to predict clinical trial drug response. Nat Med 2015;21:1318–25. [DOI] [PubMed] [Google Scholar]
- 22.Jun HJ, Johnson H, Bronson RT, de Feraudy S, White F, Charest A. The oncogenic lung cancer fusion kinase CD74-ROS activates a novel invasiveness pathway through E-Syt1 phosphorylation. Cancer Res 2012;72:3764–74. [DOI] [PMC free article] [PubMed] [Google Scholar]
- 23.Charest A, Wilker EW, McLaughlin ME, Lane K, Gowda R, Coven S, et al. ROS fusion tyrosine kinase activates a SH2 domain-containing phosphatase-2/phosphatidylinositol 3-kinase/mammalian target of rapamycin signaling axis to form glioblastoma in mice. Cancer Res 2006;66:7473–81. [DOI] [PubMed] [Google Scholar]
- 24.Davies KD, Le AT, Theodoro MF, Skokan MC, Aisner DL, Berge EM, et al. Identifying and targeting ROS1 gene fusions in non-small cell lung cancer. Clin Cancer Res 2012;18:4570–9. [DOI] [PMC free article] [PubMed] [Google Scholar]
- 25.Steen HC, Gamero AM. STAT2 phosphorylation and signaling. JAKSTAT 2013;2:e25790. [DOI] [PMC free article] [PubMed] [Google Scholar]
- 26.Chen H, Sun H, You F, Sun W, Zhou X, Chen L, et al. Activation of STAT6 by STING is critical for antiviral innate immunity. Cell 2011;147:436–46. [DOI] [PubMed] [Google Scholar]
- 27.Harder J, Schroder JM. RNase 7, a novel innate immune defense antimicrobial protein of healthy human skin. J Biol Chem 2002;277:46779–84. [DOI] [PubMed] [Google Scholar]
- 28.Rademacher F, Simanski M, Harder J. RNase 7 in Cutaneous Defense. Int J Mol Sci 2016;17:560. [DOI] [PMC free article] [PubMed] [Google Scholar]
- 29.Martin L, Koczera P, Simons N, Zechendorf E, Hoeger J, Marx G, et al. The Human Host Defense Ribonucleases 1, 3 and 7 Are Elevated in Patients with Sepsis after Major Surgery--A Pilot Study. Int J Mol Sci 2016;17:294. [DOI] [PMC free article] [PubMed] [Google Scholar]
- 30.Kopfnagel V, Wagenknecht S, Brand L, Zeitvogel J, Harder J, Hofmann K, et al. RNase 7 downregulates TH2 cytokine production by activated human T cells. Allergy 2017;72:1694–1703. [DOI] [PubMed] [Google Scholar]
- 31.Mapstone T, McMichael M, Goldthwait D. Expression of platelet-derived growth factors, transforming growth factors, and the ros gene in a variety of primary human brain tumors. Neurosurgery 1991;28:216–22. [DOI] [PubMed] [Google Scholar]
- 32.Watkins D, Dion F, Poisson M, Delattre JY, Rouleau GA. Analysis of oncogene expression in primary human gliomas: evidence for increased expression of the ros oncogene. Cancer Genet Cytogenet 1994;72:130–6. [DOI] [PubMed] [Google Scholar]
- 33.Bonner AE, Lemon WJ, Devereux TR, Lubet RA, You M. Molecular profiling of mouse lung tumors: association with tumor progression, lung development, and human lung adenocarcinomas. Oncogene 2004;23:1166–76. [DOI] [PubMed] [Google Scholar]
- 34.Yamashita S, Nomoto T, Abe M, Tatematsu M, Sugimura T, Ushijima T. Persistence of gene expression changes in stomach mucosae induced by short-term N-methyl-N’-nitro-N-nitrosoguanidine treatment and their presence in stomach cancers. Mutat Res 2004;549:185–93. [DOI] [PubMed] [Google Scholar]
- 35.Eom M, Han A, Yi SY, Shin JJ, Cui Y, Park KH. RHEB expression in fibroadenomas of the breast. Pathol Int 2008;58:226–32. [DOI] [PubMed] [Google Scholar]
Associated Data
This section collects any data citations, data availability statements, or supplementary materials included in this article.
Supplementary Materials
Data Availability Statement
The data used to support the findings of this study are included and available within the article.


