

Abstract
Background:
Major depressive disorder (MDD) is the leading cause of years lived with disability worldwide, and up to 40% of individuals with MDD do not respond to current treatments. Studies suggest that peripheral inflammation plays an important role in the striatal mesolimbic dopamine pathway and corticostriatal reward circuitry in MDD. Although MDD patients show blunted striatal responses to reward, the link between degree of inflammation and attenuation of reward processing is unclear. We investigated whether MDD patients with elevated peripheral inflammation exhibit attenuated reward responses to enhance our understanding of MDD pathophysiology and develop more effective treatments for current non-responders.
Methods:
MDD subjects varying on serum C-reactive protein (CRP) concentrations (MDD-High CRP, > 3mg/L, n=44; MDD-Low CRP, < 3mg/L, n=44) and healthy comparisons (HC, n=44) completed a monetary incentive delay (MID) task and provided blood samples to measure inflammation-related markers. MDD-High and MDD-Low were propensity score-matched on age, sex, body mass index (BMI), smoking status, exercise and MID task head motion. Percent change in blood oxygen level-dependent (BOLD) signal during anticipation of wins and losses was extracted from bilateral nucleus accumbens, dorsal caudate and dorsolateral putamen regions of interest (ROIs). A linear mixed-effects model was used to test group (MDD-High, MDD-Low and HC), condition (large-win, small-win and no win), and their interaction for these ROIs as well as whole-brain voxelwise data. Analyses also tested group differences in inflammatory mediators. Correlations were used to explore the relationship between inflammatory mediators and brain regions showing differences between MDD-High and MDD-Low.
Results:
MDD-High exhibited: (a) lower BOLD signal change in dorsal caudate, thalamus, left insula and left precuneus during anticipation of small wins than MDD-Low; and (b) higher serum soluble intercellular adhesion molecule 1 (sICAM-1) and interleukin 6 (IL-6) concentrations than MDD-Low and HC. MDD as a whole, regardless of CRP-based inflammation, exhibited: (a) lower precuneus BOLD signal change to large wins than HC; and (b) higher Interleukin 1 receptor antagonist (IL-1ra), macrophage-derived chemokine (MDC) and macrophage inflammatory protein-1 alpha (MIP-1α) concentrations than HC. Higher serum sICAM-1 concentrations were associated with lower caudate BOLD signal change to small wins only within the MDD-High group.
Conclusion:
Within MDD patients, high inflammation (CRP, sICAM-1) was linked to reduced striatal activation recruited to discriminate intermediate reward magnitudes. These findings support an association between levels of peripheral inflammation and the degree of reward-related activation in individuals with MDD.
Registration of clinical trials:
The ClinicalTrials.gov identifier for the clinical protocol associated with data published in this current paper is NCT02450240, “Latent Structure of Multi-level Assessments and Predictors of Outcomes in Psychiatric Disorders.”
Keywords: Major depressive disorder, C-reactive protein, striatal reward, inflammation, soluble intercellular adhesion molecule 1, fMRI
1. Introduction
Major depressive disorder (MDD) is the leading cause of years lived with disability worldwide, costing society over $200 billion each year in the United States and affecting over 300 million people (Greenberg et al., 2015). Moreover, MDD is the major predictor of suicide, reducing life expectancy and contributing to early mortality rates (Mann et al., 2005). Additionally, up to 40% of individuals with MDD do not respond to current treatments (treatment-resistant depression) (Joffe et al., 1996), and little is known about MDD etiology to inform treatment. Studies suggest that inflammation plays an important role in MDD pathophysiology (Kohler et al., 2017), such that low-grade inflammation is associated with core symptoms of depression (Beurel et al., 2020), including appetite change (Burrows et al., 2019; Simmons et al., 2018), suicidal ideation (Black and Miller, 2015), and anhedonia (Pan et al., 2017). Research also suggests that blunted striatal responses in MDD patients during reward processing (Pizzagalli, 2014) may be due, in part, to heightened inflammation (Felger et al., 2016; Treadway et al., 2017), yet the precise origin of the inflammation is unclear (Kiecolt-Glaser et al., 2015). Therefore, it is crucial to explore novel targets to understand MDD pathophysiology and develop more effective treatments for current non-responders (Dwivedi, 2017).
Depressed patients with increased concentrations of inflammatory markers may represent a relatively treatment-resistant population (Beurel et al., 2020); for instance, the presence of inflammation in individuals with MDD is associated with poorer response to first-line antidepressant therapies (Arteaga-Henriquez et al., 2019) as well as heightened suicidality (Black and Miller, 2015), appetite (Simmons et al., 2018), and atypical symptoms (Lamers et al., 2018). When inflammation and MDD co-occur, treating them in tandem may enhance recovery and reduce the risk of recurrence, given that anti-inflammatory interventions have a substantially greater impact on mood among individuals with heightened inflammation (Kiecolt-Glaser et al., 2015). More specifically, meta-analyses show that depression is linked to increased proinflammatory cytokines such as interleukin 6 (IL-6), tumor necrosis factor alpha (TNF-α) and C-reactive protein (CRP) (Dowlati et al., 2010; Kohler et al., 2017; Liu et al., 2012). Importantly, depression and inflammation appear to fuel each other, wherein (a) higher IL-6 and CRP predict subsequent development of depressive symptoms (Valkanova et al., 2013) and (b) current depressive symptoms predict future IL-6 and CRP elevations (Copeland et al., 2012; Deverts et al., 2010; Matthews et al., 2010). Moreover, a recent 12-year longitudinal study shows that depressive symptoms in conjunction with elevated CRP predicts incident diseases including heart disease, stroke, diabetes and pulmonary disease (Poole and Steptoe, 2020). Research suggests that cytokines, mood symptoms, and brain circuitry implicated in reward processing are interconnected, such that: (a) the blockade of peripheral cytokines, and in turn, the re-establishment of the blood brain barrier, result in antidepressant reactions (Cheng et al., 2018); and (b) low-grade inflammation induces striatal mesolimbic dopamine reductions associated with a reduced drive to pursue rewards (Treadway et al., 2019). With respect to individual cytokines, higher IL-6 concentrations are linked to: (a) greater depression severity (Lamers et al., 2019); (b) higher anhedonia, suicidal ideation, and appetite-related symptoms (Beurel et al., 2020); and (c) lower striatal (caudate and putamen) brain volumes (Ironside et al., 2019). As CRP appears to be elevated in treatment-resistant MDD patients (Strawbridge et al., 2015), individuals with MDD presenting with increased proinflammatory mediators, such as CRP, may have a distinctive clinical profile that could be responsive to second-line treatments involving anti-inflammatory drugs (Chamberlain et al., 2019).
Anhedonia, the loss of interest or pleasure in previously rewarding activities, is a core feature and one of the most treatment-resistant symptoms of MDD (Calabrese et al., 2014). With respect to anhedonia and brain function, the striatum is implicated in reward learning and hedonic responsivity (Liljeholm and O’Doherty, 2012), and appears to play a vital role in a number of cognitive and motivational processes that are impaired in MDD (Barch et al., 2016). The most common neuroimaging paradigm used to probe reward processing, the monetary incentive delay (MID) task (Knutson et al., 2001; Knutson et al., 2000), shows robust striatal activation during anticipation of rewards (Wilson et al., 2018). Inflammation also appears to alter striatal responses to rewards, such that MDD patients exposed to an inflammatory challenge show lower ventral striatum activation to anticipated monetary reward cues than healthy individuals (Eisenberger et al., 2010). In addition, inflammation is associated with decreased functional connectivity within the corticostriatal reward circuitry in depressed individuals (Felger et al., 2016). Although there are blunted striatal responses in MDD patients during MID reward processing (Arrondo et al., 2015; Pizzagalli et al., 2009), it is unclear whether MDD patients with the greatest peripheral inflammation have the most attenuated reward responses. As proinflammatory cytokines may effect neuroendocrine function and neuronal plasticity (Adzic et al., 2018), it is possible that they could contribute to reward-relevant brain circuitry implicated in MDD symptoms. As of yet, however, no published studies have evaluated whether MDD differs in striatal reward processing as a function of peripheral inflammation.
To address this gap in the literature, we conducted functional magnetic resonance imaging (fMRI) analysis using blood oxygen level-dependent (BOLD) signal change during the MID task to determine whether MDD patients with higher concentrations of peripheral inflammation (measured by blood circulating CRP) have attenuated reward anticipation responses paired with elevated concentrations of a set of additional candidate inflammatory cytokines. We hypothesized that, compared to healthy controls (HC) and MDD patients with normative CRP concentrations (MDD-Low), MDD patients with higher CRP (MDD-High) will exhibit: (a) higher concentrations of serum IL-6; (b) and lower dorsal and ventral striatum BOLD signal during anticipation of small and large wins. Exploratory correlations were calculated to determine the extent to which inflammatory mediator and brain relationships are related.
2. Methods
2.1. Participants
Participants were drawn from the first 500 subjects who completed the baseline assessments as part of the Tulsa 1000 (T1000) project, a naturalistic longitudinal study of 1000 individuals including HC and treatment-seeking individuals with mood, anxiety, substance use and eating disorders (Victor et al., 2018). Participants were recruited from the Laureate Psychiatric Clinic and Hospital, other local mental health providers, and the general community through newspaper, flyer, radio and other media advertisements in Tulsa and the surrounding regions of Oklahoma. The T1000 study was approved by the Western Institutional Review Board; all participants provided written informed consent and received compensation for their participation. See Victor et al. for the complete study protocol (Victor et al., 2018).
All participants completed the Diagnostic and Statistical Manual of Mental Disorders (DSM)–IV or DSM-5 diagnoses were determined by the Mini International Neuropsychiatric Inventory (MINI) (Sheehan et al., 1998). Participants were assigned to six groups including major depressive disorder (MDD) only, Anxiety Disorders only (i.e., social anxiety, generalized anxiety, panic, and posttraumatic stress disorders), Comorbid MDD and Anxiety Disorders, Substance Use Disorders, Eating Disorders, and HC with no psychiatric diagnoses. All participants in the MDD groups entered the T1000 study with significant depressive symptoms (the Patient Health Questionnaire (PHQ-9) ≥ 10 (Kroenke et al., 2001)) and met DSM criteria for a major depressive disorder. See Victor et al and colleagues for complete sample size, demographic and screening measures(Victor et al., 2018).
To most effectively address the study aims, only MDD and HC subjects were included in the present analysis. MDD or HC participants were excluded if they met the following criteria: (a) autoimmune disease, inflammatory bowel disease or diabetes; (b) use of anti-inflammatory or anti-diabetic drugs; (c) poor quality or missing MID fMRI data; and (d) CRP not measured or considered an outlier. In addition, based on Life Chart interview data, two MDD subjects were excluded due to recent hospitalizations for eating disorders, and one HC subject with elevated anxiety scores was excluded (Figure 1). Serum CRP concentrations were measured with V-PLEX Neuroinflammation Panel 1 Human Kit (Meso Scale Diagnostics, Maryland, USA) in duplicates; the intra- and inter-assay coefficients of variation were 2.2% and 10.0%, respectively. Three groups were determined based on their CRP concentrations: (a) MDD subjects with CRP > 3mg/L (MDD-High, n = 53) – the American Heart Association recommended CRP > 3mg/L as high risk of future cardiovascular disease; (b) MDD subjects with CRP concentrations between 0-3 mg/L (MDD-Low, n = 93); and (c) HC subjects regardless of their CRP concentrations (HC, n = 44). Outliers (2 MDD-High, 1 HC) on CRP were excluded using a z-score > 3 within each group.
Figure 1.
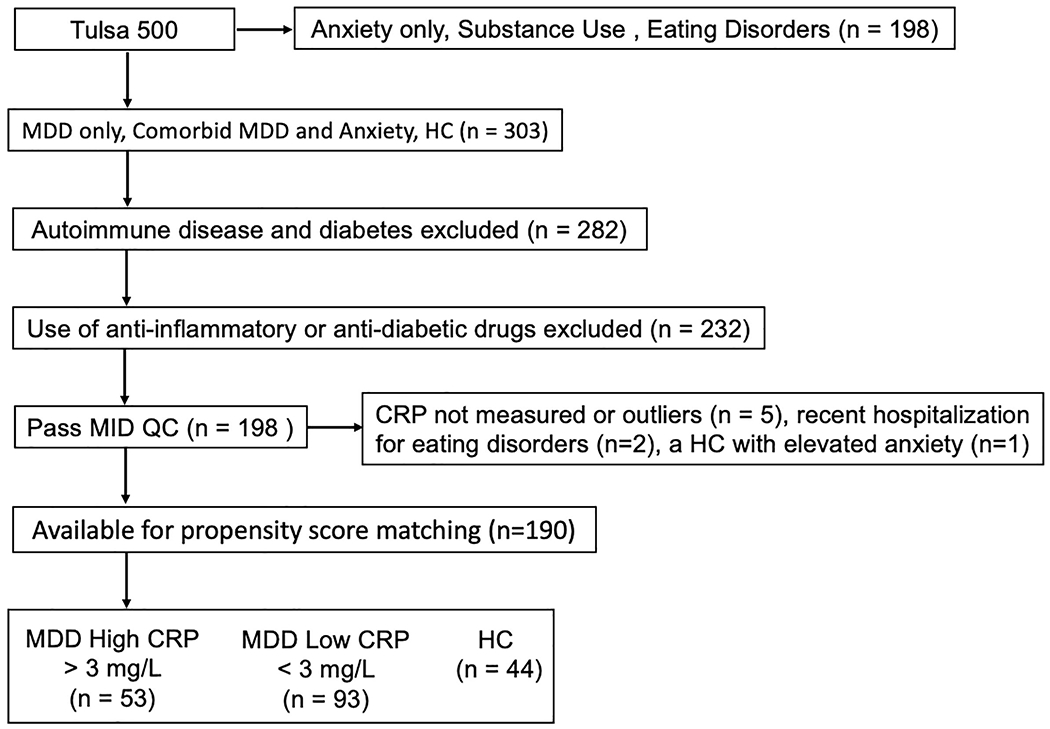
Identification criteria for MDD High CRP, MDD Low CRP and HC samples. MDD = major depressive disorder. CRP = C-reactive protein. HC = healthy control. MID QC = monetary incentive delay task quality control.
First, propensity score-matching was used to identify a group of MDD-High participants who were matched to the full sample of HCs on age and sex. Second, MDD-Low subjects were propensity score-matched to MDD-High subjects on a set of variables that may be confounded with group membership and/or functional brain activations including age, sex, body mass index (BMI), smoking status, exercise, and MID task head motion. After propensity score-matching, 44 MDD-High, 44 MDD-Low and 44 HC subjects remained for data analysis.
2.2. Measures
2.2.1. fMRI MID task and data preprocessing
Participants completed two runs of the MID task (Knutson et al., 2001). Each run lasted 562 seconds and included 45 trials. A cue was presented at the beginning of each trial that indicated a potential win or loss (circle or square) along with a magnitude of 0, 1, or 5 US dollars. After a short delay, a target (white triangle) was presented and participants were asked to press a button within a short time in order to win or avoid losing the amount indicated by the cue. Difficulty was calibrated by each participant’s reaction time during a practice session and updated during the scan such that participants would succeed on roughly two thirds of the trials. The MID task was programmed in PsychoPy (Peirce, 2007) and all responses were recorded using a four-button response box (Current Designs, Philadelphia, PA). Images were acquired on two identical GE MR750 3T scanners and scanning parameters were: TR/TE = 2000/27 ms, FOV/slice = 240/2.9 mm, 128 χ 128 matrix, 39 axial slices. High resolution structural T1-weighted images were also acquired (TR/TE = 5/2.012 ms, FOV/slice = 240 χ 192/0.9mm, 186 axial slices).
2.2.2. fMRI data preprocessing
Neuroimaging data were preprocessed using the AFNI software package (Cox, 1996). The first three TRs were discarded, followed by despiking, slice timing correction, co-registration to anatomical volumes, motion correction, normalization to Montreal Neurological Institute space (with a final voxel size of 2x2x2mm), and application of a 4mm Gaussian full-width at half-max smoothing kernel. Four-second block regressors were convolved with a canonical hemodynamic response function and used to model the blood oxygen level dependent (BOLD) response to each of the six anticipatory task conditions: −5, −1, −0, +0, +1, +5. Additionally, nuisance regressors were included for the first four polynomial terms and six motion parameters. Censoring was done at the regression step by removing volumes with either a Euclidean norm of the derivatives of the six motion parameters greater than 0.3 or greater than 10% outlier voxels, determined by 3dToutcount. Percent signal change was defined as the estimated beta coefficient from single-subject analysis, which was relative to the implicit baseline during unmodeled fixation. Regressors in the model were the first 4 polynomial baseline terms, along with 6 motion parameters (roll/pitch/yaw/x/y/z translation), large loss (−5), small loss (−1), no loss (−0), no win (+0), small win (+1), large win (+5). Motor responses were not explicitly modeled.
2.2.3. Clinical ratings and blood collection
The Patient-Reported Outcomes Measurement Information System (PROMIS) (Cella et al., 2010) was used to collect data on alcohol use, anger, anxiety, depression, fatigue, nicotine dependence, physical function, sleep disturbance and social isolation. Smoking and exercise status were obtained based on two questions during a medical history interview: (a) “Do you smoke cigarettes or use other tobacco products regularly?” and (b) “Do you exercise regularly?”. Medication status was defined as having taken any psychotropic medication within the past 6 weeks. Venous blood was collected in BD Vacutainer serum collection tubes, and then centrifuged at 1300g for 10 min at room temperature, serum was removed and aliquoted. Serum aliquots were stored at −80°C until analysis.
2.2.4. Immunoassays
The Neuroinflammation Panel 1 Human Kit (Meso Scale Diagnostics, Maryland, USA) was used to measure 37 inflammation-related markers (full list detailed in supplemental Table S1). Interleukin 1 receptor antagonist (IL-1 ra) was measured with Human Quantikine ELISA kits (R & D Systems, Minneapolis, USA). All serum samples were tested in duplicate. IL-1α, IL-1β, IL-2 and IL-5 were not used due to a low detection rate (<80%). Inflammatory mediators IL-4, IL-10, IL-13, IL-15, IL-17A, IP-10, placental growth factor (PIGF), serum amyloid A (SAA), tyrosine protein kinase receptor Tie 2 (Tie-2), vascular endothelial growth factor C (VEGF-C) and TNF-β were excluded from the analysis due to their high inter-assay coefficients of variation (CV > 15%). We also excluded eotaxin-3 due to its high intra-assay CV (> 10%). Finally, a total of 22 analytes with an intra-assay CV <10 and an inter-assay CV < 15% were used for inflammatory mediator data analysis. Supplemental Table S2 lists CVs for each analyte used for analysis.
2.3. Statistical analysis
2.3.1. MID group analyses
2.3.1.1. ROI analyses
Percent fMRI change in BOLD signal during high-win, low-win and no-win conditions were extracted from bilateral nucleus accumbens, dorsal caudate and dorsolateral putamen using the Brainnetome Atlas (Fan et al., 2016). A linear mixed-effects (LME) model was used to test group (MDD-High, MDD-Low and HC), condition (large-win, small-win and no win), and their interaction using the “lme4” package in R. Group, condition, hemisphere, age, sex, BMI and head motion were modeled as fixed effects. Subject was modeled as a random effect. A similar LME model was also estimated for loss anticipation (large-loss, small-loss and no-loss).
2.3.1.2. Whole brain analyses
AFNI’s group analysis program (Chen et al., 2014) with a multi-variate modeling approach (3dMVM) was used for voxel-wise whole brain analysis. Group (MDD-High, MDD-Low and HC) was the between-subject variable, and condition (high-win, low-win and no win) for win anticipation was used as the within-subject variable. The resulting group x condition statistical map was corrected for multiple comparisons at p < 0.05 using AFNI’s 3dClustsim -acf function. In addition to striatum regions, small volume correction was applied to thalamus, amygdala and insula.
2.3.1.3. MID task performance
Analysis of variance (ANOVA) was used to test group differences on reaction time and hit rate on each condition, followed by Tukey’s Honest Significant Difference method if the overall test was significant.
2.3.2. Immunoassay group analyses
Shapiro-Wilks tests were used to test normality of distributions; those that were found to be non-Gaussian were log-transformed. ANOVA was used to assess group differences, followed by Tukey’s Honest Significant Difference method if the overall test was significant. Even after log-transformation, the distributions for IL-6 and leptin were found to be non-Gaussian; therefore, group differences were assessed with Kruskal-Wallis non-parametric tests and followed by Mann-Whitney-Wilcoxon non-parametric post-hoc tests if the overall test was significant. Outliers for each analyte were defined as values with an absolute z greater than 3 within each group and set as missing. Cohen’s d was computed to evaluate effect size differences between groups. See Supplemental Table S3 for details regarding the number of subjects analyzed for each analyte after excluding outliers.
2.3.3. Post-Hoc tests and correlations
Bilateral data were averaged across hemispheres for post-hoc tests. For visualization purposes, we averaged across no win (+0) and no loss (−0) conditions to create an overall neutral condition. For ROI and whole brain corrected clusters showing significant group x condition interactions, post-hoc tests using the “multcomp” package in R (Hothorn et al., 2008) were used to examine group differences emerging from linear mixed-effects models. In addition, based on findings for the soluble intercellular adhesion molecule 1 (sICAM-1), Pearson’s correlations were used to evaluate potential relationships between sICAM-1 and significant group x condition BOLD signal regions (striatum) differing between MDD-High and MDD-Low groups. Due to the non-normal distribution of IL-6, brain-behavior relationships involving IL-6 were tested using Spearman’s correlations.
3. Results
3.1. Demographics and clinical ratings
MDD-High, MDD-Low and HC did not differ on age, sex, income, education, employment status or smoking status. The two MDD groups did not differ on age, sex, income, education, employment status, smoking status, exercise, BMI, medication status, MID head motion, or PROMIS alcohol use, anger, anxiety, depression, fatigue, nicotine dependence, physical function, sleep disturbance and social isolation ratings (Table 1).
Table 1.
Sample demographics and clinical characteristics as a function of group membership.
| MDD High CRP Mean (sd) | MDD Low CRP Mean (sd) | HC Mean (sd) | Three groups p-value | Two MDD groups p-value | |
|---|---|---|---|---|---|
| N | 44 | 44 | 44 | ||
| Age (Years) | 34.52 (9.85) | 34.16 (12.26) | 30.91 (10.15) | 0.229 a | 0.878 c |
| Sex = Male (%) | 12 (27.27) | 15 (34.09) | 19 (43.18) | 0.291 b | 0.644 b |
| Annual Income (US Dollars) | 54462 (52607) | 76788 (156895) | 51686 (35399) | 0.430 a | 0.386 c |
| Consolidated Education | 6.37 (1.77) | 6.02 (1.53) | 6.50 (1.42) | 0.345 a | 0.328 c |
| Employed = Yes (%) | 28 (65.1) | 25 (58.1) | 32 (78.0) | 0.146 b | 0.657 b |
| Smoke = Yes (%) | 10 (22.7) | 8 (18.2) | 5 (11.4) | 0.368 b | 0.792 b |
| Exercise = Yes (%) | 14 (31.8) | 18 (40.9) | 31 (70.5) | 0.001 b | 0.506 b |
| Body Mass Index (kg/m2) | 31.19 (4.55) | 29.94 (4.55) | 26.50 (5.22) | <0.001 a | 0.203 c |
| MID head motion mean | 0.08 (0.03) | 0.07 (0.03) | 0.06 (0.02) | 0.017 a | 0.264 c |
| MID head motion Max. displacement | 2.83 (1.21) | 2.79 (1.43) | 2.57 (1.11) | 0.563 a | 0.899 c |
| Medication = Un-medicated (%) | 14 (31.8) | 12 (27.3) | NA | NA | 0.815 b |
| PROMIS Alcohol Use | 48.93 (8.29) | 48.90 (5.78) | 44.52 (6.78) | 0.004 a | 0.980 c |
| PROMIS Anger | 57.49 (6.39) | 58.73 (6.98) | 44.38 (5.56) | <0.001 a | 0.389 c |
| PROMIS Anxiety | 62.68 (5.76) | 63.48 (7.20) | 45.60 (7.42) | <0.001 a | 0.568 c |
| PROMIS Depression | 60.62 (6.68) | 61.41 (7.69) | 43.50 (6.38) | <0.001 a | 0.609 c |
| PROMIS Fatigue | 61.15 (6.98) | 61.26 (8.21) | 43.61 (7.14) | <0.001 a | 0.946 c |
| PROMIS Nicotine Dependence | 28.48 (11.70) | 27.65 (10.00) | 25.32 (7.04) | 0.294 a | 0.725 c |
| PROMIS Physical Function | 50.24 (5.36) | 49.84 (8.46) | 60.22 (6.64) | <0.001 a | 0.788 c |
| PROMIS Sleep Disturbance | 58.88 (8.77) | 55.78 (10.95) | 43.67 (7.67) | <0.001 a | 0.149 c |
| PROMIS Social Isolation | 57.84 (5.74) | 58.46 (5.16) | 42.69 (7.89) | <0.001 a | 0.600 c |
| Current major depressive episode on MINI = Yes (%) | 41 (93.2) | 41 (93.2) | 0 (0) | <0.001 b | 1.000 b |
Consolidated Education, coded as 1 - no school through kindergarten, 2 – grade 1-11, 3 – grade 12, no diploma, 4- regular high school diploma, 5- general educational development (GED) or equivalent, 6- some college, no degree, 7- associate’s degree, 8- bachelor’s degree, 9- master’s degree, 10- professional degree beyond a bachelor’s, 11- doctoral degree; MID = monetary incentive delay task. PROMIS: Patient-Reported Outcomes Measurement Information System total score. MINI, Mini International Neuropsychiatric Inventory; NA = not applicable.
One-way ANOVA test;
χ2 test.
Two Sample t-test.
3.2. Neuroimaging Results
3.2.1. ROI analyses
Figure 2 demonstrates that there was a significant group x condition interaction effect during win anticipation for nucleus accumbens (F4,653 = 2.44, p = .046, partial η2 = .015), dorsal caudate (F4,653 = 6.28, p <.001, partial η2 = .037) and dorsolateral putamen (F4,653 = 2.89, p = .022, partial η2 = .017). Similar group x condition interactions during loss anticipation were also identified for nucleus accumbens (F4,653 = 4.27, p = .002, partial η2 = .025), dorsal caudate (F4,653 = 2.77, p = .026, partial η2 = .017) and dorsolateral putamen (F4,653 = 5.41, p = <.001, partial η2 = .032). Post-hoc tests using the “multcomp” package in R demonstrated that MDD-High exhibited lower dorsal caudate BOLD signal during anticipation of small wins than MDD-Low (p = .019, d = −.593) Supplemental Table S4. In addition, examining win-neutral and loss-neutral contrasts during the anticipatory phase as the outcomes of interest between three groups within these ROIs (see Supplemental Methods for details), MDD-High, MDD-Low and HC differed on the win-neutral contrast within dorsal caudate (F2,129 = 3.59, p = 0.017). Specifically, MDD-High exhibited lower dorsal caudate BOLD signal for the win-neutral contrast than HC (p = .027, d = −.544) (Supplemental Table S8 and Supplemental Figure S1).
Figure 2.
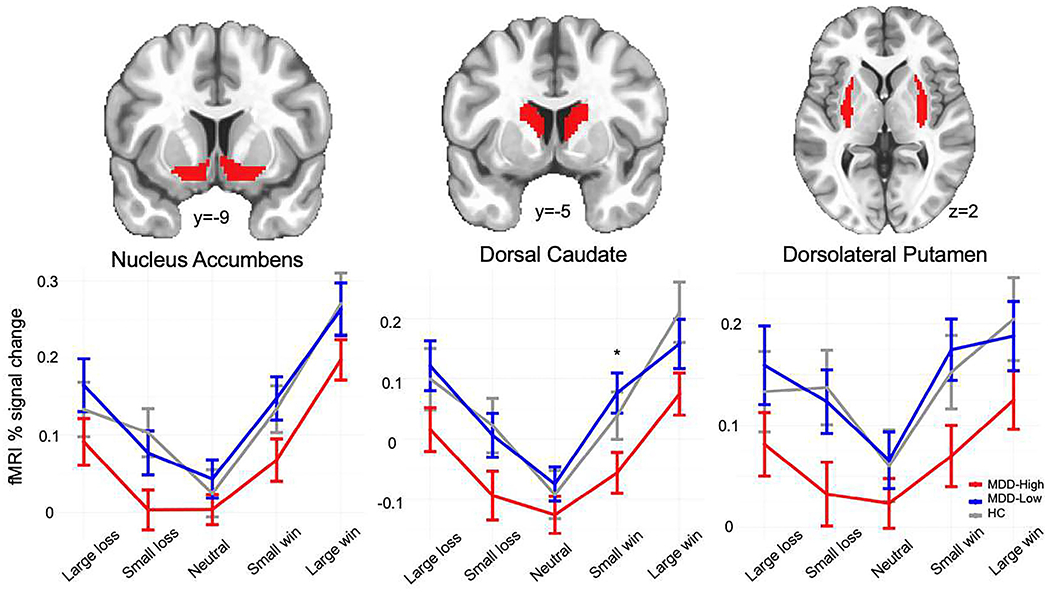
Striatum regions of interest and functional magnetic resonance imaging (fMRI) % signal change during monetary incentive delay win and loss anticipation. MDD = major depressive disorder. HC = healthy control. * denotes significant post-hoc test differences between groups using the “multcomp” package in R.
3.2.2. Whole brain analyses
Figure 3 illustrates that significant group x condition interaction effects emerged for six regions: left and right caudate, left and right thalamus, left insula and left precuneus. See Supplemental Table S5 for details regarding coordinates and volumes for these regions. The LME model indicated a significant group by condition interaction effect during win anticipation for dorsal caudate (F4,653 = 3.79, p = .005, partial η2 = .053), thalamus (F4,653 = 4.94, p < .001, partial η2 = .067), left insula (F4,653 = 6.11, p < .001, partial η2 = .082) and left precuneus (F4,653 = 7.52, p < .001, partial η2 = .097); no group by condition interaction effects were observed during anticipation of losses within these regions.
Figure 3.
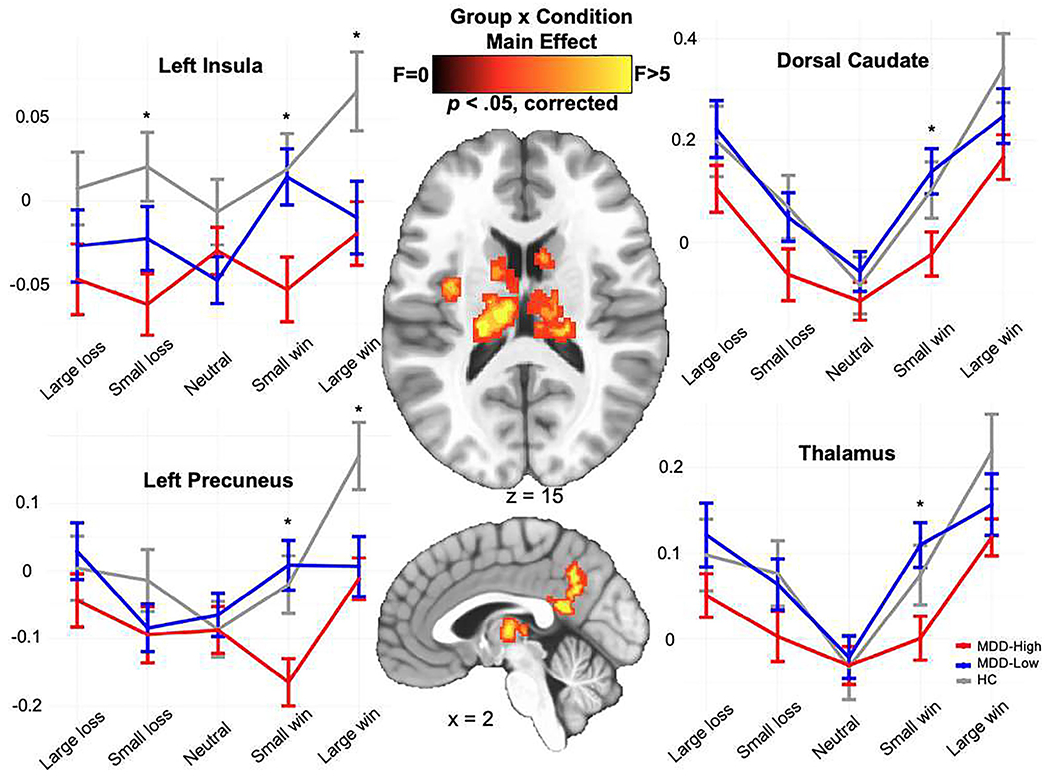
Whole brain voxel-wise monetary incentive delay task group x condition results for win and loss anticipation. MDD = major depressive disorder. HC = healthy control. * denotes significant post-hoc test differences between groups using the “multcomp” package in R.
Post-hoc tests using “multcomp” in R (depicted in Supplemental Table S6 demonstrated two main findings. First, MDD-High showed lower BOLD signal than MDD-Low when anticipating small wins within bilateral dorsal caudate (p = .041, d = −.558), bilateral thalamus (p = .029, d = −.635), left insula (p = .033, d = −.559) and left precuneus (p = .006, d = −.726), although both MDD groups did not differ from HC. Second, MDD-High and MDD-Low displayed lower or trending lower BOLD signal than HC when anticipating large wins within left precuneus (p = .030 and .024) and left insula (p = .076 and .065); however, MDD groups did not differ from each other.
Evaluating win-neutral and loss-neutral contrasts during the anticipatory phase as the outcomes of interest between three groups within these regions (see Supplemental Methods for details), MDD-High, MDD-Low and HC differed on the win-neutral contrast within all four regions - dorsal caudate, thalamus, left insula and left precuneus (Supplemental Figure S2). Overall, MDD-High showed the least striatal reward anticipation for the win-neutral contrast comparing to MDD-Low and HC (see Supplemental Results for detailed statistical test values).
3.2.3. MID task performance
Although groups did not differ on correct hits, a main effect of group indicated that MDD-Low exhibited longer reaction times than HC during anticipation of small losses (p = 0.020, d = .581) (Supplemental Table S7).
3.3. Immunoassay Results
Table 2 and Figure 4 illustrate that groups differed on sICAM-1, TNF-α, IL-1ra, IL-6, monocyte chemotactic protein 4 (MCP-4), macrophage-derived chemokine (MDC) and macrophage inflammatory protein-1 alpha (MIP-1α). More specifically, MDD-High exhibited higher sICAM-1 and IL-6 concentrations than MDD-Low and HC. In contrast, when compared to HC, both MDD-High and MDD-Low showed higher IL-1ra, MDC and MIP-1α concentrations. Moreover, MDD-High displayed higher concentrations of TNF-α than HC, and MDD-Low showed higher concentrations of MCP-4 than HC. On the whole, Cohen’s d effect sizes for significant group differences ranged from medium to large (Table 2). In addition, we used principal component analysis (PCA) as a data reduction technique applied to the 22 analytes in Table 2 and compared the component scores across groups. Results were largely similar when considering the first PC, which indexed overall inflammation (supplemental Figure S3, see alternative supplemental analysis for details).
Table 2.
Mean biomarker values for each group.
| MDD-High (n=44) | MDD-Low (n=44) | HC (n=44) | p-value | MDD-High vs. MDD-Low | MDD-High vs. HC | MDD-Low vs. HC | ||||
|---|---|---|---|---|---|---|---|---|---|---|
| Mean (sd) | Mean (sd) | Mean (sd) | p-value | d d | p-value | d d | p-value | d d | ||
| aCRP (pg/mL) b | 15.73 (0.55) | 13.97 (0.94) | 13.46 (1.33) | <0.001 | <0.001 | 2.273 | <0.001 | 2.347 | 0.020 | 0.504 |
| sICAM-1 (ng/mL) b | 456.46 (97.60) | 395.59 (85.77) | 356.54 (80.37) | <0.001 | 0.005 | 0.663 | <0.001 | 1.118 | 0.101 | 0.470 |
| sVCAM-1 (ng/mL) b | 578.61 (104.47) | 539.63 (114.30) | 579.12 (138.53) | 0.222 | 0.296 | 1.000 | 0.283 | |||
| aTNF-α (pg/mL) b | 0.93 (0.26) | 0.80 (0.30) | 0.77 (0.23) | 0.019 | 0.070 | 0.456 | 0.023 | 0.618 | 0.908 | 0.090 |
| aIL-1ra (pg/mL) b | 6.29 (0.43) | 6.12 (0.45) | 5.90 (0.40) | <0.001 | 0.175 | 0.376 | <0.001 | 0.931 | 0.044 | 0.519 |
| IL-6 (pg/mL) c | 0.85 (0.40) | 0.57 (0.32) | 0.46 (0.28) | <0.001 | <0.001 | 0.769 | <0.001 | 1.132 | 0.102 | 0.367 |
| IL-7 (pg/mL) b | 10.97 (4.23) | 10.89 (4.27) | 11.12 (3.92) | 0.967 | 0.996 | 0.985 | 0.964 | |||
| IL-8 (pg/mL) b | 7.61 (2.69) | 7.90 (2.51) | 7.69 (2.42) | 0.869 | 0.866 | 0.990 | 0.924 | |||
| aIL-12 (pg/mL) b | 4.73 (0.45) | 4.66 (0.46) | 4.63 (0.42) | 0.544 | 0.717 | 0.534 | 0.952 | |||
| IL-16 (pg/mL) b | 182.76 (44.00) | 167.77 (47.33) | 178.77 (42.34) | 0.268 | 0.260 | 0.908 | 0.486 | |||
| aIFN-γ (pg/mL) b | 0.90 (0.86) | 0.56 (0.50) | 0.80 (0.87) | 0.108 | 0.098 | 0.794 | 0.329 | |||
| abFGF (pg/mL) b | 1.49 (0.91) | 1.41 (0.87) | 1.61 (0.81) | 0.558 | 0.895 | 0.803 | 0.530 | |||
| aVEGFR-1 (pg/mL) b | 4.74 (0.24) | 4.79 (0.20) | 4.80 (0.22) | 0.399 | 0.505 | 0.439 | 0.993 | |||
| aVEGF-A (pg/mL) b | 4.59 (0.75) | 4.51 (0.72) | 4.37 (0.64) | 0.353 | 0.863 | 0.328 | 0.637 | |||
| VEGF-D (pg/mL) b | 972.07 (307.72) | 937.70 (289.63) | 987.39 (298.20) | 0.729 | 0.853 | 0.969 | 0.718 | |||
| Eotaxin (pg/mL) b | 473.66 (162.27) | 494.15 (222.34) | 482.22 (202.75) | 0.887 | 0.878 | 0.977 | 0.957 | |||
| MCP-1 (pg/mL) b | 256.49 (69.71) | 255.95 (81.63) | 271.44 (103.92) | 0.637 | 1.000 | 0.700 | 0.681 | |||
| aMCP-4 (pg/mL) b | 4.93 (0.50) | 5.12 (0.48) | 4.84 (0.46) | 0.024 | 0.162 | −0.388 | 0.656 | 0.189 | 0.021 | 0.599 |
| aMDC (pg/mL) b | 7.30 (0.35) | 7.24 (0.29) | 7.08 (0.30) | 0.004 | 0.696 | 0.170 | 0.004 | 0.674 | 0.040 | 0.555 |
| aMIP-1α (pg/mL) b | 2.45 (0.40) | 2.39 (0.39) | 2.14 (0.32) | <0.001 | 0.715 | 0.160 | 0.001 | 0.859 | 0.007 | 0.698 |
| aMIP-1β (pg/mL) b | 4.70 (0.45) | 4.74 (0.45) | 4.62 (0.39) | 0.453 | 0.904 | 0.693 | 0.430 | |||
| aTARC (pg/mL) b | 5.51 (0.65) | 5.71 (0.39) | 5.49 (0.61) | 0.130 | 0.213 | 0.990 | 0.166 | |||
Note. HC, Healthy Control; MDD, Major Depressive Disorder; CRP, C-reactive protein; sICAM-1, soluble intercellular adhesion molecule 1; sVCAM-1, soluble vascular cell adhesion molecule 1; TNF-α, Tumor necrosis factor alpha; IL-1ra, interleukin 1 receptor antagonist; IL-6, Interleukin 6; IL-7, Interleukin 7; IL-8, Interleukin 8; IL-12, Interleukin 12; IL-16, Interleukin 16; IFN-γ, Interferon gamma; bFGF, basic fibroblast growth factor; VEGFR-1, Vascular endothelial growth factor receptor 1; VEGF-A, Vascular endothelial growth factor A; VEGF-D, Vascular endothelial growth factor D; MCP-1, Monocyte chemotactic protein 1; MCP-4, Monocyte chemotactic protein-4; MDC, C-C motif chemokine 22; MIP-1α, Macrophage inflammatory protein 1-alpha; MIP-1β, Macrophage inflammatory protein-1β; TARC, Chemokine (C-C motif) ligand 17; MDD-High, Depressed subjects with high CRP concentrations; MDD-Normal, Depressed subjects with normal CRP concentrations.
Log-transformed;
One way ANOVA followed by Tukey’s Honest Significant Difference’ method;
p-values are from nonparametric results using the Kruskal-Wallis test (Wilcoxon test for the two-group case);
Cohen’s d effect sizes computed with the effsize package in R. Statistically significant p-values are indicated in bold font.
Figure 4.
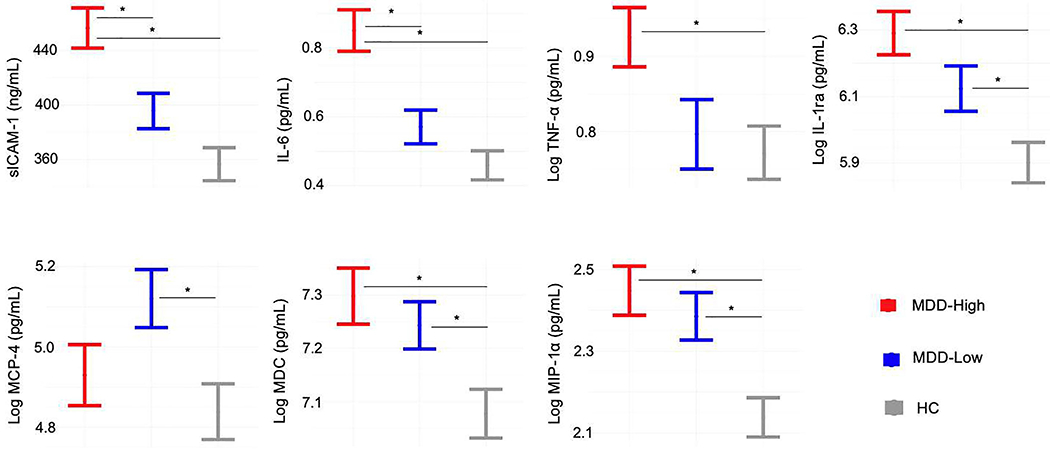
Biomarkers showing group differences. MDD = major depressive disorder. HC = healthy control. sICAM-1 = soluble intercellular adhesion molecule 1. IL-6 = Interleukin 6. TNF-α = Tumor necrosis factor alpha. IL-1ra = interleukin 1 receptor antagonist. MCP-4 = Monocyte chemotactic protein-4. MDC = C-C motif chemokine 22. MIP-1α = Macrophage inflammatory protein 1-alpha. * denotes significant mean differences between groups.
3.4. Post-Hoc correlations
Both ROI and whole brain analyses showed that MDD-High exhibited lower bilateral dorsal caudate BOLD signal than MDD-Low during the anticipation of small wins. In addition, MDD-High displayed higher sICAM-1 and IL-6 concentrations than MDD-Low. Therefore, correlations were used to examine the relationships between inflammatory mediators (sICAM-1 and IL-6) and dorsal caudate BOLD signal to small wins within each group; False Discovery Rate (FDR) correction for multiple comparisons was used to interpret significance. Figure 5 illustrates that within the MDD-High group, those individuals with the highest concentration of sICAM-1 showed the lowest BOLD related activation to small wins (r = −0.41, pcorrected = .036). Fisher’s r-to-z transformations were applied to this correlation for each group and then compared; results indicated that the relationship between sICAM-1 and dorsal caudate BOLD signal was significantly more negative in MDD-High than MDD-Low (z = −2.12, p = .017) and HC (z = −2.56, p = .005). There were no significant correlations between IL-6 and caudate BOLD signal.
Figure 5.
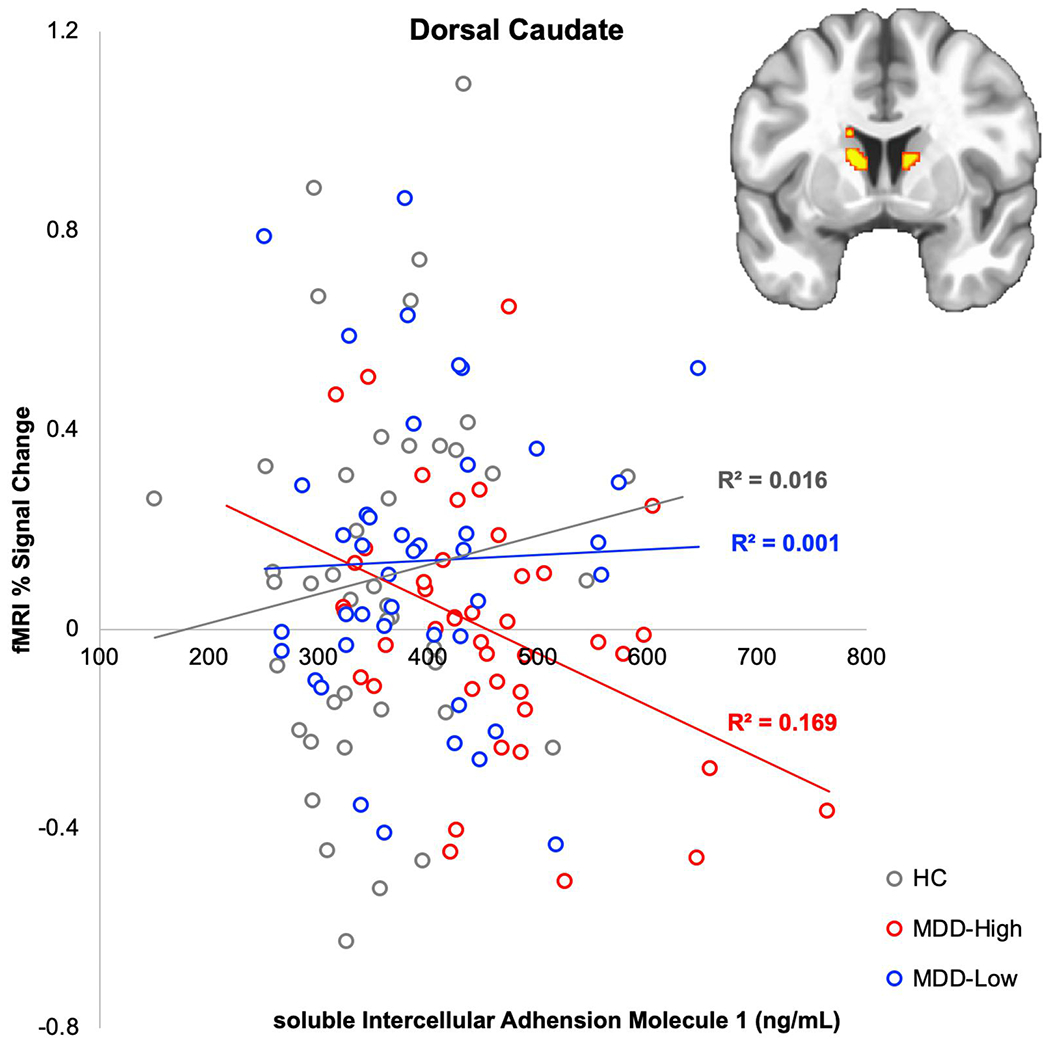
Correlation between soluble intercellular adhesion molecule (sICAM-1) and % functional magnetic resonance imaging (fMRI) signal change from baseline in caudate during anticipation of small wins.
4. Discussion
4.1. Overview
This study examined the hypothesis that MDD subjects with increased inflammation (measured by blood circulating CRP) show reduced striatal BOLD responses during reward anticipation and was partially supported by three main findings. First, both whole brain and ROI analyses demonstrated that MDD-High exhibited lower dorsal caudate BOLD signal when anticipating small wins than MDD-Low; however, both groups did not differ from HC during anticipation of small wins, and all three groups did not differ in caudate BOLD signal during the anticipation of large wins. Second, MDD-High showed higher serum sICAM-1 and IL-6 concentrations than MDD-Low and HC, indicative of increased concentrations of multiple inflammatory cytokines that were not just limited to CRP. This finding is consistent with the underlying mechanism of CRP production, which is stimulated by IL-6 (Pepys and Hirschfield, 2003). This finding is consistent with prior studies showing (1) an association between IL-6 and striatal prediction-error signals following acute stress in healthy female participants (Treadway et al., 2017) and (2) a positive correlation between CRP and sICAM-1 (el-Mesallamy et al., 2007). Third, within MDD-High but not the MDD-low or HC group, dorsal caudate BOLD signal during small win anticipation was lowest in subjects with highest sICAM-1 concentrations. In summary, although there were no differences in the striatum across groups, within MDD patients, higher inflammation (CRP, sICAM-1) was linked to reduced striatal resources recruited to discriminate intermediate reward magnitudes. These findings support an association between levels of peripheral inflammation and the degree of reward related activation in individuals with MDD.
The overall U-shaped patterns of striatal activation during win and loss anticipations were consistent with previous findings (Bartra et al., 2013; Spechler et al., 2020). The slope from no wins to small wins was modest for the MDD-High group (Figure 2), indicating that it appears to require a large reward magnitude for MDD-High to recruit similar processing resources as their MDD-Low and HC peers. Therefore, depressed individuals with higher inflammation may not experience the reinforcing properties of low-level rewards since they are processed only moderately higher than neutral stimuli. Therefore, it is possible that MDD-High individuals are less likely to make small improvements in their life or engage in behaviors that are only modestly reinforcing.
In addition to results targeting specific hypotheses, findings from the present study indicate that MDD as a whole, regardless of CRP-based inflammation, exhibited: (a) lower left insula and precuneus BOLD signal to large wins than HC; and (b) higher IL1ra, MDC and MIP-1α concentrations than HC. Moreover, MDD-High exhibited higher TNF-α concentrations than HC, consistent with research showing that CRP increases TNF-α production (Galve-de Rochemonteix et al., 1993). However, while cumulative meta-analyses confirms that MDD patients show higher CRP and IL-6 concentrations than HC across studies, no consistent association between TNF-α and MDD appears to be present (Haapakoski et al., 2015). Our findings suggest that TNF-α may only be elevated in a subset of MDD patients presenting with heightened CRP.
4.2. sICAM-1 Functions and Implications for MDD
Although many studies have established the important role of inflammatory cytokines in depression (Burrows et al., 2019; Copeland et al., 2012; Deverts et al., 2010; Dowlati et al., 2010; Kohler et al., 2017; Liu et al., 2012; Matthews et al., 2010; Simmons et al., 2018), the role of sICAM-1 in MDD has not been evaluated in detail (Muller, 2019). Research tends to focus on depression symptoms within older subjects because sICAM-1 concentrations increase during aging; for instance, one meta-analysis demonstrates that higher sICAM-1 blood levels mirror higher depression symptoms in individuals aged greater than 40 years (van Agtmaal et al., 2017). As individuals in our study had a mean age of 34 (range 18 to 56 years) these results extend the literature on sICAM-1’s potential role in MDD pathophysiology.
sICAM-1 is important in depression for two reasons – its important roles in vascular and central nervous system (CNS) functions. First, cardiovascular disease and depression often co-occur (Lepine and Briley, 2011), and sICAM-1 is a marker of endothelial activation and damage (Raffaele De Caterina, 1997), which is considered an index of vascular disease. Previous studies reported increased sICAM-1 levels in MDD (Herder et al., 2017; Lopez-Vilchez et al., 2016), as well as positive correlations between depressive symptoms and sICAM-1 levels (Do et al., 2010). As our study showed that MDD-High exhibited higher serum sICAM-1 concentrations than both MDD-Low and HC, depressed subjects with higher inflammation may be at higher risk of vascular disease than depressed subjects with normal inflammation (despite the fact that both MDD groups had similarly high BMI). Available data is mixed as to whether antidepressants can change sICAM-1 levels; whereas one study reports that treatment with a selective serotonin reuptake inhibitor (SSRI) shows significant sICAM-1 reductions (Lopez-Vilchez et al., 2016), another study indicates that SSRI therapy does not influence endothelial function (Dawood et al., 2016). On the whole, our study suggests that a subset of MDD individuals exhibiting endothelial dysfunction measured by increased sICAM-1 levels may benefit most from antidepressant treatments.
Second, sICAM-1 plays an important role between CNS and peripheral immunity (Dietrich, 2002; Yang et al., 2019a). sICAM-1 is involved in the regulation of blood-brain barrier (BBB) permeability, regulating the movements of peripheral molecules, specifically components of the immune system, in and out of the CNS (Muller, 2019). Moreover, research demonstrates a link between the induction of sICAM-1 and the development of symptoms of depression during interferon alpha (IFN- α) treatment, possibly by enhancing BBB-permeability (Schaefer et al., 2004). In the CNS, sICAM-1 is expressed in glial cells (astrocytes and microglia), as well as endothelial cells in the white and gray matter of the human forebrain (Lee and Benveniste, 1999). Glial cells are involved with inflammation within the CNS (Banati et al., 1993). As prior work suggests that serum sICAM-1 contributes to BBB impairment (Bowman et al., 2018), treatments that can down-regulate sICAM-1 levels in depressed people with increased peripheral inflammation may improve cognitive health by preventing BBB breakdown.
To our knowledge, this is the first study showing an inverse relationship between blood sICAM-1 levels and brain striatal reward anticipation in MDD. Research indicates that (a) depressed individuals show disrupted striatal function during reward processing (Arrondo et al., 2015; Pizzagalli et al., 2009), and (b) inflammation alters reward-related neural responding (Eisenberger et al., 2010). Preclinical animal studies may provide insight into potential interventions for humans presenting with depression, blunted striatal processing, and heightened sICAM-1. For instance, in mouse brains, sICAM-1 expression appears strongest within the striatum (Antezana et al., 2003). Furthermore, in a rodent model, injection of a pro-inflammatory agent increases sICAM-1 expression in the striatum but not within other brain regions (Armentero et al., 2011). In contrast, injection of an anti-neuroinflammation agent in mice reduces striatal sICAM-1 levels, protecting BBB integrity (Yang et al., 2019b). Lastly, research using a rat model indicates that exercise reduces sICAM-1 levels in dorsolateral striatum (Ding et al., 2005). Given the link between peripheral and striatal inflammation, one possible approach is to reduce striatal inflammation by exercise or anti-inflammatory agent, thus, improving striatal reward response to treat anhedonia in a subset of individuals with MDD.
4.3. Brain and Peripheral Markers Differentiating MDD from HC
4.3.1. Brain markers
Both MDD groups exhibited lower insula and precuneus BOLD signal than HC during win anticipation. Meta-analyses demonstrate that insular cortex is a key substrate of the salience network (Wilson et al., 2018) implicated in the anticipation of monetary reward, with depressed individuals exhibiting lower insula BOLD signal than HC within this context (Jacob et al., 2020; Wilson et al., 2018). Although our results suggest that depressed individuals attribute less salience to reward contingencies than HC, it is important to note that insular reductions in MDD are not specific to reward processing; for instance, MDD patients exhibit lower insula BOLD signal than HC during attention to bodily sensations (Avery et al., 2014) and possess lower left insula gray matter volumes than HC (Lai and Wu, 2014). While insular cortex is linked to salience processing, precuneus BOLD signal is thought to reflect the degree an individual is engaged in a particular task; for instance, precuneus shows heightened connectivity to the left frontoparietal network during task engagement but greater connectivity to the brain’s default mode network when no task is present (Utevsky et al., 2014). Our findings replicate prior work showing left precuneus BOLD signal during win anticipation in HC (Knutson and Wimmer, 2007), as well as reduced precuneus BOLD signal in MDD present across task and resting-state contexts that prior work has linked to heightened rumination and depression severity (Jacob et al., 2020; Lai, 2018; Li et al., 2018; Liu et al., 2017; Peng et al., 2015; Zhang et al., 2013). Our findings suggest that MDD is characterized by reduced engagement by reward-relevant stimuli (Felger and Treadway, 2017).
4.3.2. Peripheral markers
Although we separated MDD into two groups based on their CRP concentrations, both MDD-High and MDD-Low subjects exhibited increased concentrations of inflammatory mediators (IL-1ra, MIP-1α and MDC) than HC. Both MDC and MIP-1α are chemokines. More specifically, MIP-1α functions as microglial chemotaxis in the CNS (Stuart et al., 2015) and appears to be essential for the accumulation of activated glial cells in the hippocampus of mice models of Alzheimer’s disease leading to inflammation and cognitive failure (Passos et al., 2009). As both MDD groups exhibited elevated MIP-1α levels, MIP-1α might be a potential therapeutic target for depression to improve cognitive function regardless of an individual’s inflammatory status. In addition, a study investigating chemokine changes in MDD patients before and after antidepressant treatment indicates that MDC levels lessen as a function of successful drug response; this finding suggests that MDC might serve as a marker of pharmacological therapy response in MDD (Milenkovic et al., 2017). Lastly, our finding of higher IL1-ra, a proxy used to measure IL-1β, in both MDD groups compared to HC is consistent with prior research reporting similar group differences (Maes et al., 1995; Ovaskainen et al., 2009) as well as studies linking higher IL1-ra with higher depression symptoms (Milaneschi et al., 2009) (Herder et al., 2018) (Rich et al., 2017). Additional studies are warranted to determine the mechanism responsible for the link between IL1-ra and depression.
4.4. Limitations
Despite the strengths of this analysis, including the integration of brain, behavior, and peripheral inflammation data and the matching of demographic/symptom characteristics across our MDD groups, our study possesses several limitations worthy of discussion. First, the major limitation is the cross-sectional design, making it impossible to determine causal inference. It is unclear if the inflammation-related markers caused depression/striatal differences, or if depression precipitated a set of behaviors to cause inflammatory markers and/or striatal functioning to become dysregulated. Second, as we used propensity score matching to simulate a randomization of participants to their respective groups based on a set of potential confounders, it is unlikely that the observed differences were confounded with age, sex, etc.; however, there is also a set of possible confounders that influence inflammation, including but not limited to genetics, diet, and socioeconomic status that were not addressed in this analysis. Third, a number of markers such as Interleukin 1 alpha were not analyzed in this study due to assay quality limitations (high CVs > 15%, or not detectable). Although we found differences across groups for several biological analytes, those differences were not associated with levels of depressive symptoms. Lastly, while studies examining peripheral blood inflammatory mediators have informed psychiatric symptoms, ultimately, these findings do not translate into what inflammation is occurring in the brain. A more direct technique is needed to derive brain-specific information, such as the use of brain-derived exosomes to capture this information. Exosomes are extracellular microvesicles that are involved in intracellular communication using their specialized cargo consisting of micro RNAs and proteins (Kalluri and LeBleu, 2020). The ability to isolate exosomes from a variety of biofluids including serum and plasma makes use of this technique a highly desired endeavor.
5. Conclusions
Within MDD patients, high inflammation (CRP, sICAM-1) was linked to reduced striatal resources recruited to discriminate intermediate reward magnitudes. These findings support an association between levels of peripheral inflammation and the degree of reward-related activation in individuals with MDD.
Supplementary Material
Highlights.
MDD-High exhibited lower striatal reward anticipation than MDD-Low
MDD-High had higher sICAM-1 and IL-6 concentrations than MDD-Low and HC
Within MDD-High, higher sICAM-1 levels were associated with lower striatal reward anticipation
MDD exhibited lower precuneus response to large wins than HC
MDD had higher IL-1ra, MDC and MIP-1α concentrations than HC
Acknowledgements
The blood processing and immunoassays were conducted in Integrative Immunology Center (IIC), School of Community Medicine, The University of Oklahoma, Tulsa, OK. The authors wish to thank the IIC staff Ashlee Rempel, Brenda Davis and Chibing Tan for their work and support involved in the data collection.
Funding
This work was supported by The William K. Warren Foundation, and the National Institute of General Medical Sciences Center Grant Award (1P20GM121312).
Footnotes
Publisher's Disclaimer: This is a PDF file of an unedited manuscript that has been accepted for publication. As a service to our customers we are providing this early version of the manuscript. The manuscript will undergo copyediting, typesetting, and review of the resulting proof before it is published in its final form. Please note that during the production process errors may be discovered which could affect the content, and all legal disclaimers that apply to the journal pertain.
Declaration of Interest
None.
REFERENCES
- Adzic M, Brkic Z, Mitic M, Francija E, Jovicic MJ, Radulovic J, Maric NP, 2018. Therapeutic Strategies for Treatment of Inflammation-related Depression. Curr Neuropharmacol 16, 176–209. [DOI] [PMC free article] [PubMed] [Google Scholar]
- Antezana DF, Clatterbuck RE, Alkayed NJ, Murphy SJ, Anderson LG, Frazier J, Hurn PD, Traystman RJ, Tamargo RJ, 2003. High-dose ibuprofen for reduction of striatal infarcts during middle cerebral artery occlusion in rats. J Neurosurg 98, 860–866. [DOI] [PubMed] [Google Scholar]
- Armentero MT, Levandis G, Bazzini E, Cerri S, Ghezzi C, Blandini F, 2011. Adhesion molecules as potential targets for neuroprotection in a rodent model of Parkinson’s disease. Neurobiol Dis 43, 663–668. [DOI] [PubMed] [Google Scholar]
- Arrondo G, Segarra N, Metastasio A, Ziauddeen H, Spencer J, Reinders NR, Dudas RB, Robbins TW, Fletcher PC, Murray GK, 2015. Reduction in ventral striatal activity when anticipating a reward in depression and schizophrenia: a replicated cross-diagnostic finding. Front Psychol 6, 1280. [DOI] [PMC free article] [PubMed] [Google Scholar]
- Arteaga-Henriquez G, Simon MS, Burger B, Weidinger E, Wijkhuijs A, Arolt V, Birkenhager TK, Musil R, Muller N, Drexhage HA, 2019. Low-Grade Inflammation as a Predictor of Antidepressant and Anti-Inflammatory Therapy Response in MDD Patients: A Systematic Review of the Literature in Combination With an Analysis of Experimental Data Collected in the EU-MOODINFLAME Consortium. Front Psychiatry 10, 458. [DOI] [PMC free article] [PubMed] [Google Scholar]
- Avery JA, Drevets WC, Moseman SE, Bodurka J, Barcalow JC, Simmons WK, 2014. Major depressive disorder is associated with abnormal interoceptive activity and functional connectivity in the insula. Biol Psychiatry 76, 258–266. [DOI] [PMC free article] [PubMed] [Google Scholar]
- Banati RB, Gehrmann J, Schubert P, Kreutzberg GW, 1993. Cytotoxicity of microglia. Glia 7, 111–118. [DOI] [PubMed] [Google Scholar]
- Barch DM, Pagliaccio D, Luking K, 2016. Mechanisms Underlying Motivational Deficits in Psychopathology: Similarities and Differences in Depression and Schizophrenia. Curr Top Behav Neurosci 27, 411–449. [DOI] [PubMed] [Google Scholar]
- Bartra O, McGuire JT, Kable JW, 2013. The valuation system: a coordinate-based meta-analysis of BOLD fMRI experiments examining neural correlates of subjective value. Neuroimage 76, 412–427. [DOI] [PMC free article] [PubMed] [Google Scholar]
- Beurel E, Toups M, Nemeroff CB, 2020. The Bidirectional Relationship of Depression and Inflammation: Double Trouble. Neuron. [DOI] [PMC free article] [PubMed] [Google Scholar]
- Black C, Miller BJ, 2015. Meta-Analysis of Cytokines and Chemokines in Suicidality: Distinguishing Suicidal Versus Nonsuicidal Patients. Biol Psychiatry 78, 28–37. [DOI] [PubMed] [Google Scholar]
- Bowman GL, Dayon L, Kirkland R, Wojcik J, Peyratout G, Severin IC, Henry H, Oikonomidi A, Migliavacca E, Bacher M, Popp J, 2018. Blood-brain barrier breakdown, neuroinflammation, and cognitive decline in older adults. Alzheimers Dement 14, 1640–1650. [DOI] [PubMed] [Google Scholar]
- Burrows K, Stewart JL, Antonacci C, Kuplicki R, Thompson K, Taylor A, Teague TK, Paulus MP, 2019. Association of poorer dietary quality and higher dietary inflammation with greater symptom severity in depressed individuals with appetite loss. J Affect Disord 263, 99–106. [DOI] [PMC free article] [PubMed] [Google Scholar]
- Calabrese JR, Fava M, Garibaldi G, Grunze H, Krystal AD, Laughren T, Macfadden W, Marin R, Nierenberg AA, Tohen M, 2014. Methodological approaches and magnitude of the clinical unmet need associated with amotivation in mood disorders. J Affect Disord 168, 439–451. [DOI] [PubMed] [Google Scholar]
- Cella D, Riley W, Stone A, Rothrock N, Reeve B, Yount S, Amtmann D, Bode R, Buysse D, Choi S, Cook K, Devellis R, DeWalt D, Fries JF, Gershon R, Hahn EA, Lai JS, Pilkonis P, Revicki D, Rose M, Weinfurt K, Hays R, Group PC, 2010. The Patient-Reported Outcomes Measurement Information System (PROMIS) developed and tested its first wave of adult self-reported health outcome item banks: 2005–2008. J Clin Epidemiol 63, 1179–1194. [DOI] [PMC free article] [PubMed] [Google Scholar]
- Chamberlain SR, Cavanagh J, de Boer P, Mondelli V, Jones DNC, Drevets WC, Cowen PJ, Harrison NA, Pointon L, Pariante CM, Bullmore ET, 2019. Treatment-resistant depression and peripheral C-reactive protein. Br J Psychiatry 214, 11–19. [DOI] [PMC free article] [PubMed] [Google Scholar]
- Chen G, Adleman NE, Saad ZS, Leibenluft E, Cox RW, 2014. Applications of multivariate modeling to neuroimaging group analysis: a comprehensive alternative to univariate general linear model. Neuroimage 99, 571–588. [DOI] [PMC free article] [PubMed] [Google Scholar]
- Cheng Y, Desse S, Martinez A, Worthen RJ, Jope RS, Beurel E, 2018. TNFalpha disrupts blood brain barrier integrity to maintain prolonged depressive-like behavior in mice. Brain Behav Immun 69, 556–567. [DOI] [PMC free article] [PubMed] [Google Scholar]
- Copeland WE, Shanahan L, Worthman C, Angold A, Costello EJ, 2012. Cumulative depression episodes predict later C-reactive protein levels: a prospective analysis. Biol Psychiatry 71, 15–21. [DOI] [PMC free article] [PubMed] [Google Scholar]
- Cox RW, 1996. AFNI: software for analysis and visualization of functional magnetic resonance neuroimages. Comput Biomed Res 29, 162–173. [DOI] [PubMed] [Google Scholar]
- Dawood T, Barton DA, Lambert EA, Eikelis N, Lambert GW, 2016. Examining Endothelial Function and Platelet Reactivity in Patients with Depression before and after SSRI Therapy. Front Psychiatry 7, 18. [DOI] [PMC free article] [PubMed] [Google Scholar]
- Deverts DJ, Cohen S, DiLillo VG, Lewis CE, Kiefe C, Whooley M, Matthews KA, 2010. Depressive symptoms, race, and circulating C-reactive protein: the Coronary Artery Risk Development in Young Adults (CARDIA) study. Psychosom Med 72, 734–741. [DOI] [PMC free article] [PubMed] [Google Scholar]
- Dietrich JB, 2002. The adhesion molecule ICAM-1 and its regulation in relation with the blood-brain barrier. J Neuroimmunol 128, 58–68. [DOI] [PubMed] [Google Scholar]
- Ding YH, Young CN, Luan X, Li J, Rafols JA, Clark JC, McAllister JP 2nd, Ding Y., 2005. Exercise preconditioning ameliorates inflammatory injury in ischemic rats during reperfusion. Acta Neuropathol 109, 237–246. [DOI] [PubMed] [Google Scholar]
- Do DP, Dowd JB, Ranjit N, House JS, Kaplan GA, 2010. Hopelessness, depression, and early markers of endothelial dysfunction in U.S. adults. Psychosom Med 72, 613–619. [DOI] [PMC free article] [PubMed] [Google Scholar]
- Dowlati Y, Herrmann N, Swardfager W, Liu H, Sham L, Reim EK, Lanctot KL, 2010. A meta-analysis of cytokines in major depression. Biol Psychiatry 67, 446–457. [DOI] [PubMed] [Google Scholar]
- Dwivedi Y, 2017. microRNA-124: a putative therapeutic target and biomarker for major depression. Expert Opin Ther Targets 21, 653–656. [DOI] [PubMed] [Google Scholar]
- Eisenberger NI, Berkman ET, Inagaki TK, Rameson LT, Mashal NM, Irwin MR, 2010. Inflammation-induced anhedonia: endotoxin reduces ventral striatum responses to reward. Biol Psychiatry 68, 748–754. [DOI] [PMC free article] [PubMed] [Google Scholar]
- el-Mesallamy H, Suwailem S, Hamdy N, 2007. Evaluation of C-reactive protein, endothelin-1, adhesion molecule(s), and lipids as inflammatory markers in type 2 diabetes mellitus patients. Mediators Inflamm 2007, 73635. [DOI] [PMC free article] [PubMed] [Google Scholar]
- Fan L, Li H, Zhuo J, Zhang Y, Wang J, Chen L, Yang Z, Chu C, Xie S, Laird AR, Fox PT, Eickhoff SB, Yu C, Jiang T, 2016. The Human Brainnetome Atlas: A New Brain Atlas Based on Connectional Architecture. Cereb Cortex 26, 3508–3526. [DOI] [PMC free article] [PubMed] [Google Scholar]
- Felger JC, Li Z, Haroon E, Woolwine BJ, Jung MY, Hu X, Miller AH, 2016. Inflammation is associated with decreased functional connectivity within corticostriatal reward circuitry in depression. Mol Psychiatry 21, 1358–1365. [DOI] [PMC free article] [PubMed] [Google Scholar]
- Felger JC, Treadway MT, 2017. Inflammation Effects on Motivation and Motor Activity: Role of Dopamine. Neuropsychopharmacology 42, 216–241. [DOI] [PMC free article] [PubMed] [Google Scholar]
- Galve-de Rochemonteix B, Wiktorowicz K, Kushner I, Dayer JM, 1993. C-reactive protein increases production of IL-1 alpha, IL-1 beta, and TNF-alpha, and expression of mRNA by human alveolar macrophages. J Leukoc Biol 53, 439–445. [DOI] [PubMed] [Google Scholar]
- Greenberg PE, Fournier AA, Sisitsky T, Pike CT, Kessler RC, 2015. The economic burden of adults with major depressive disorder in the United States (2005 and 2010). J Clin Psychiatry 76, 155–162. [DOI] [PubMed] [Google Scholar]
- Haapakoski R, Mathieu J, Ebmeier KP, Alenius H, Kivimaki M, 2015. Cumulative meta-analysis of interleukins 6 and 1beta, tumour necrosis factor alpha and C-reactive protein in patients with major depressive disorder. Brain Behav Immun 49, 206–215. [DOI] [PMC free article] [PubMed] [Google Scholar]
- Herder C, Furstos JF, Nowotny B, Begun A, Strassburger K, Mussig K, Szendroedi J, Icks A, Roden M, Group GDS, 2017. Associations between inflammation-related biomarkers and depressive symptoms in individuals with recently diagnosed type 1 and type 2 diabetes. Brain Behav Immun 61, 137–145. [DOI] [PubMed] [Google Scholar]
- Herder C, Schmitt A, Budden F, Reimer A, Kulzer B, Roden M, Haak T, Hermanns N, 2018. Longitudinal associations between biomarkers of inflammation and changes in depressive symptoms in patients with type 1 and type 2 diabetes. Psychoneuroendocrinology 91,216–225. [DOI] [PubMed] [Google Scholar]
- Hothorn T, Bretz F, Westfall P, 2008. Simultaneous inference in general parametric models. Biometrical journal. Biometrische Zeitschrift 50, 346–363. [DOI] [PubMed] [Google Scholar]
- Ironside M, Admon R, Maddox SA, Mehta M, Douglas S, Olson DP, Pizzagalli DA, 2019. Inflammation and depressive phenotypes: evidence from medical records from over 12 000 patients and brain morphology. Psychol Med, 1–9. [DOI] [PMC free article] [PubMed] [Google Scholar]
- Jacob Y, Morris LS, Huang KH, Schneider M, Rutter S, Verma G, Murrough JW, Balchandani P, 2020. Neural correlates of rumination in major depressive disorder: A brain network analysis. Neuroimage Clin 25, 102142. [DOI] [PMC free article] [PubMed] [Google Scholar]
- Joffe RT, Levitt AJ, Sokolov ST, 1996. Augmentation strategies: focus on anxiolytics. J Clin Psychiatry 57 Suppl 7, 25–31; discussion 32-23. [PubMed] [Google Scholar]
- Kalluri R, LeBleu VS, 2020. The biology, function, and biomedical applications of exosomes. Science 367. [DOI] [PMC free article] [PubMed] [Google Scholar]
- Kiecolt-Glaser JK, Derry HM, Fagundes CP, 2015. Inflammation: depression fans the flames and feasts on the heat. Am J Psychiatry 172, 1075–1091. [DOI] [PMC free article] [PubMed] [Google Scholar]
- Knutson B, Fong GW, Adams CM, Varner JL, Hommer D, 2001. Dissociation of reward anticipation and outcome with event-related fMRI. Neuroreport 12, 3683–3687. [DOI] [PubMed] [Google Scholar]
- Knutson B, Westdorp A, Kaiser E, Hommer D, 2000. FMRI visualization of brain activity during a monetary incentive delay task. Neuroimage 12, 20–27. [DOI] [PubMed] [Google Scholar]
- Knutson B, Wimmer GE, 2007. Splitting the difference: how does the brain code reward episodes? Ann N Y Acad Sci 1104, 54–69. [DOI] [PubMed] [Google Scholar]
- Kohler CA, Freitas TH, Maes M, de Andrade NQ, Liu CS, Fernandes BS, Stubbs B, Solmi M, Veronese N, Herrmann N, Raison CL, Miller BJ, Lanctot KL, Carvalho AF, 2017. Peripheral cytokine and chemokine alterations in depression: a meta-analysis of 82 studies. Acta Psychiatr Scand 135, 373–387. [DOI] [PubMed] [Google Scholar]
- Kroenke K, Spitzer RL, Williams JB, 2001. The PHQ-9: validity of a brief depression severity measure. J Gen Intern Med 16, 606–613. [DOI] [PMC free article] [PubMed] [Google Scholar]
- Lai CH, 2018. The regional homogeneity of cingulate-precuneus regions: The putative biomarker for depression and anxiety. J Affect Disord 229, 171–176. [DOI] [PubMed] [Google Scholar]
- Lai CH, Wu YT, 2014. Frontal-insula gray matter deficits in first-episode medication-naive patients with major depressive disorder. J Affect Disord 160, 74–79. [DOI] [PubMed] [Google Scholar]
- Lamers F, Milaneschi Y, de Jonge P, Giltay EJ, Penninx B, 2018. Metabolic and inflammatory markers: associations with individual depressive symptoms. Psychol Med 48, 1102–1110. [DOI] [PubMed] [Google Scholar]
- Lamers F, Milaneschi Y, Smit JH, Schoevers RA, Wittenberg G, Penninx B, 2019. Longitudinal Association Between Depression and Inflammatory Markers: Results From the Netherlands Study of Depression and Anxiety. Biol Psychiatry 85, 829–837. [DOI] [PubMed] [Google Scholar]
- Lee SJ, Benveniste EN, 1999. Adhesion molecule expression and regulation on cells of the central nervous system. J Neuroimmunol 98, 77–88. [DOI] [PubMed] [Google Scholar]
- Lepine JP, Briley M, 2011. The increasing burden of depression. Neuropsychiatr Dis Treat 7, 3–7. [DOI] [PMC free article] [PubMed] [Google Scholar]
- Li G, Rossbach K, Zhang A, Liu P, Zhang K, 2018. Resting-state functional changes in the precuneus within first-episode drug-naive patients with MDD. Neuropsychiatr Dis Treat 14, 1991–1998. [DOI] [PMC free article] [PubMed] [Google Scholar]
- Liljeholm M, O’Doherty JP, 2012. Contributions of the striatum to learning, motivation, and performance: an associative account. Trends Cogn Sci 16, 467–475. [DOI] [PMC free article] [PubMed] [Google Scholar]
- Liu CH, Ma X, Yuan Z, Song LP, Jing B, Lu HY, Tang LR, Fan J, Walter M, Liu CZ, Wang L, Wang CY, 2017. Decreased Resting-State Activity in the Precuneus Is Associated With Depressive Episodes in Recurrent Depression. J Clin Psychiatry 78, e372– e382. [DOI] [PubMed] [Google Scholar]
- Liu Y, Ho RC, Mak A, 2012. Interleukin (IL)-6, tumour necrosis factor alpha (TNF-alpha) and soluble interleukin-2 receptors (sIL-2R) are elevated in patients with major depressive disorder: a meta-analysis and meta-regression. J Affect Disord 139, 230–239. [DOI] [PubMed] [Google Scholar]
- Lopez-Vilchez I, Diaz-Ricart M, Navarro V, Torramade S, Zamorano-Leon J, Lopez-Farre A, Galan AM, Gasto C, Escolar G, 2016. Endothelial damage in major depression patients is modulated by SSRI treatment, as demonstrated by circulating biomarkers and an in vitro cell model. Transl Psychiatry 6, e886. [DOI] [PMC free article] [PubMed] [Google Scholar]
- Maes M, Vandoolaeghe E, Ranjan R, Bosmans E, Bergmans R, Desnyder R, 1995. Increased serum interleukin-1-receptor-antagonist concentrations in major depression. J Affect Disord 36, 29–36. [DOI] [PubMed] [Google Scholar]
- Mann JJ, Apter A, Bertolote J, Beautrais A, Currier D, Haas A, Hegerl U, Lonnqvist J, Malone K, Marusic A, Mehlum L, Patton G, Phillips M, Rutz W, Rihmer Z, Schmidtke A, Shaffer D, Silverman M, Takahashi Y, Varnik A, Wasserman D, Yip P, Hendin H, 2005. Suicide prevention strategies: a systematic review. JAMA 294, 2064–2074. [DOI] [PubMed] [Google Scholar]
- Matthews KA, Schott LL, Bromberger JT, Cyranowski JM, Everson-Rose SA, Sowers M, 2010. Are there bi-directional associations between depressive symptoms and C-reactive protein in mid-life women? Brain Behav Immun 24, 96–101. [DOI] [PMC free article] [PubMed] [Google Scholar]
- Milaneschi Y, Corsi AM, Penninx BW, Bandinelli S, Guralnik JM, Ferrucci L, 2009. Interleukin-1 receptor antagonist and incident depressive symptoms over 6 years in older persons: the InCHIANTI study. Biol Psychiatry 65, 973–978. [DOI] [PMC free article] [PubMed] [Google Scholar]
- Milenkovic VM, Sarubin N, Hilbert S, Baghai TC, Stoffler F, Lima-Ojeda JM, Manook A, Almeqbaali K, Wetzel CH, Rupprecht R, Nothdurfter C, 2017. Macrophage-Derived Chemokine: A Putative Marker of Pharmacological Therapy Response in Major Depression? Neuroimmunomodulation 24, 106–112. [DOI] [PubMed] [Google Scholar]
- Muller N, 2019. The Role of Intercellular Adhesion Molecule-1 in the Pathogenesis of Psychiatric Disorders. Front Pharmacol 10, 1251. [DOI] [PMC free article] [PubMed] [Google Scholar]
- Ovaskainen Y, Koponen H, Jokelainen J, Keinanen-Kiukaanniemi S, Kumpusalo E, Vanhala M, 2009. Depressive symptomatology is associated with decreased interleukin-1 beta and increased interleukin-1 receptor antagonist levels in males. Psychiatry Res 167, 73–79. [DOI] [PubMed] [Google Scholar]
- Pan Z, Rosenblat JD, Swardfager W, McIntyre RS, 2017. Role of Proinflammatory Cytokines in Dopaminergic System Disturbances, Implications for Anhedonic Features of MDD. Curr Pharm Des 23, 2065–2072. [DOI] [PubMed] [Google Scholar]
- Passos GF, Figueiredo CP, Prediger RD, Pandolfo P, Duarte FS, Medeiros R, Calixto JB, 2009. Role of the macrophage inflammatory protein-1alpha/CC chemokine receptor 5 signaling pathway in the neuroinflammatory response and cognitive deficits induced by beta-amyloid peptide. Am J Pathol 175, 1586–1597. [DOI] [PMC free article] [PubMed] [Google Scholar]
- Peirce JW, 2007. PsychoPy--Psychophysics software in Python. J Neurosci Methods 162, 8–13. [DOI] [PMC free article] [PubMed] [Google Scholar]
- Peng D, Liddle EB, Iwabuchi SJ, Zhang C, Wu Z, Liu J, Jiang K, Xu L, Liddle PF, Palaniyappan L, Fang Y, 2015. Dissociated large-scale functional connectivity networks of the precuneus in medication-naive first-episode depression. Psychiatry Res 232, 250–256. [DOI] [PubMed] [Google Scholar]
- Pepys MB, Hirschfield GM, 2003. C-reactive protein: a critical update. J Clin Invest 111, 1805–1812. [DOI] [PMC free article] [PubMed] [Google Scholar]
- Pizzagalli DA, 2014. Depression, stress, and anhedonia: toward a synthesis and integrated model. Annu Rev Clin Psychol 10, 393–423. [DOI] [PMC free article] [PubMed] [Google Scholar]
- Pizzagalli DA, Holmes AJ, Dillon DG, Goetz EL, Birk JL, Bogdan R, Dougherty DD, Iosifescu DV, Rauch SL, Fava M, 2009. Reduced caudate and nucleus accumbens response to rewards in unmedicated individuals with major depressive disorder. Am J Psychiatry 166, 702–710. [DOI] [PMC free article] [PubMed] [Google Scholar]
- Poole L, Steptoe A, 2020. The combined association of depressive symptoms and C-reactive protein for incident disease risk up to 12 years later. Findings from the English Longitudinal Study of Ageing (ELSA). Brain Behav Immun 88, 908–912. [DOI] [PubMed] [Google Scholar]
- Raffaele De Caterina GB, Guido Lazzerini, Giulia Dell’Omo, Roberto Petrucci, Marco Morale, Franco Carmassi, and Roberto Pedrinelli, 1997. Soluble Vascular Cell Adhesion Molecule-1 as a Biohumoral Correlate of Atherosclerosis. Arteriosclerosis, Thrombosis, and Vascular Biology 17, 8. [DOI] [PubMed] [Google Scholar]
- Rich T, Zhao F, Cruciani RA, Cella D, Manola J, Fisch MJ, 2017. Association of fatigue and depression with circulating levels of proinflammatory cytokines and epidermal growth factor receptor ligands: a correlative study of a placebo-controlled fatigue trial. Cancer Manag Res 9, 1–10. [DOI] [PMC free article] [PubMed] [Google Scholar]
- Schaefer M, Horn M, Schmidt F, Schmid-Wendtner MH, Volkenandt M,Ackenheil M, Mueller N, Schwarz MJ, 2004. Correlation between sICAM-1 and depressive symptoms during adjuvant treatment of melanoma with interferon-alpha. Brain Behav Immun 18, 555–562. [DOI] [PubMed] [Google Scholar]
- Sheehan DV, Lecrubier Y, Sheehan KH, Amorim P, Janavs J, Weiller E, Hergueta T, Baker R, Dunbar GC, 1998. The Mini-International Neuropsychiatric Interview (M.I.N.I.): the development and validation of a structured diagnostic psychiatric interview for DSM-IV and ICD-10. J Clin Psychiatry 59 Suppl 20, 22–33;quiz 34-57. [PubMed] [Google Scholar]
- Simmons WK, Burrows K, Avery JA, Kerr KL, Taylor A, Bodurka J, Potter W, Teague TK, Drevets WC, 2018. Appetite changes reveal depression subgroups with distinct endocrine, metabolic, and immune states. Mol Psychiatry. [DOI] [PMC free article] [PubMed] [Google Scholar]
- Spechler PA, Stewart JL, Kuplicki R, Paulus MP, 2020. Attenuated reward activations associated with cannabis use in anxious/depressed individuals. Translational Psychiatry 10. [DOI] [PMC free article] [PubMed] [Google Scholar]
- Strawbridge R, Arnone D, Danese A, Papadopoulos A, Herane Vives A, Cleare AJ, 2015. Inflammation and clinical response to treatment in depression: A meta-analysis. Eur Neuropsychopharmacol 25, 1532–1543. [DOI] [PubMed] [Google Scholar]
- Stuart MJ, Singhal G, Baune BT, 2015. Systematic Review of the Neurobiological Relevance of Chemokines to Psychiatric Disorders. Front Cell Neurosci 9, 357. [DOI] [PMC free article] [PubMed] [Google Scholar]
- Treadway MT, Admon R, Arulpragasam AR, Mehta M, Douglas S, Vitaliano G, Olson DP, Cooper JA, Pizzagalli DA, 2017. Association Between Interleukin-6 and Striatal Prediction-Error Signals Following Acute Stress in Healthy Female Participants. Biol Psychiatry 82, 570–577. [DOI] [PMC free article] [PubMed] [Google Scholar]
- Treadway MT, Cooper JA, Miller AH, 2019. Can’t or Won’t? Immunometabolic Constraints on Dopaminergic Drive. Trends Cogn Sci 23, 435–448. [DOI] [PMC free article] [PubMed] [Google Scholar]
- Utevsky AV, Smith DV, Huettel SA, 2014. Precuneus is a functional core of the default-mode network. J Neurosci 34, 932–940. [DOI] [PMC free article] [PubMed] [Google Scholar]
- Valkanova V, Ebmeier KP, Allan CL, 2013. CRP, IL-6 and depression: a systematic review and meta-analysis of longitudinal studies. J Affect Disord 150, 736–744. [DOI] [PubMed] [Google Scholar]
- van Agtmaal MJM, Houben A, Pouwer F, Stehouwer CDA, Schram MT, 2017. Association of Microvascular Dysfunction With Late-Life Depression: A Systematic Review and Meta-analysis. JAMA Psychiatry 74, 729–739. [DOI] [PMC free article] [PubMed] [Google Scholar]
- Victor TA, Khalsa SS, Simmons WK, Feinstein JS, Savitz J, Aupperle RL, Yeh HW, Bodurka J, Paulus MP, 2018. Tulsa 1000: a naturalistic study protocol for multilevel assessment and outcome prediction in a large psychiatric sample. BMJ Open 8, e016620. [DOI] [PMC free article] [PubMed] [Google Scholar]
- Wilson RP, Colizzi M, Bossong MG, Allen P, Kempton M, Mtac, Bhattacharyya S, 2018. The Neural Substrate of Reward Anticipation in Health: A Meta-Analysis of fMRI Findings in the Monetary Incentive Delay Task. Neuropsychol Rev 28, 496–506. [DOI] [PMC free article] [PubMed] [Google Scholar]
- Yang RC, Qu XY, Xiao SY, Li L, Xu BJ, Fu JY, Lv YJ, Amjad N, Tan C, Kim KS, Chen HC, Wang XR, 2019a. Meningitic Escherichia coli-induced upregulation of PDGF-B and ICAM-1 aggravates blood-brain barrier disruption and neuroinflammatory response. J Neuroinflammation 16, 101. [DOI] [PMC free article] [PubMed] [Google Scholar]
- Yang YL, Cheng X, Li WH, Liu M, Wang YH, Du GH, 2019b. Kaempferol Attenuates LPS-Induced Striatum Injury in Mice Involving Anti-Neuroinflammation, Maintaining BBB Integrity, and Down-Regulating the HMGB1/TLR4 Pathway. Int J Mol Sci 20. [DOI] [PMC free article] [PubMed] [Google Scholar]
- Zhang WN, Chang SH, Guo LY, Zhang KL, Wang J, 2013. The neural correlates of reward-related processing in major depressive disorder: a meta-analysis of functional magnetic resonance imaging studies. J Affect Disord 151, 531–539. [DOI] [PubMed] [Google Scholar]
Associated Data
This section collects any data citations, data availability statements, or supplementary materials included in this article.