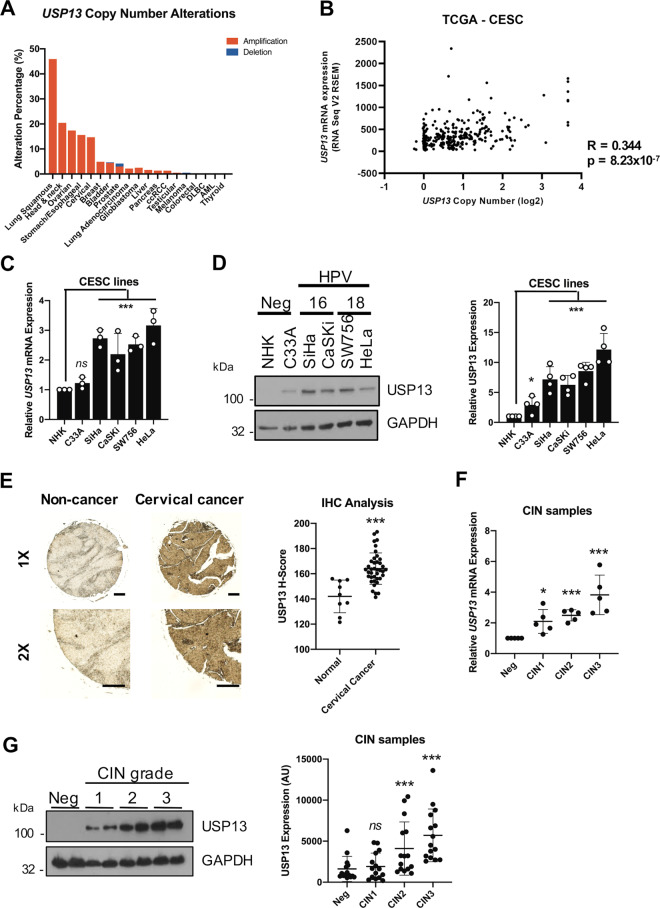
Fig. 1. USP13 expression is upregulated in pre-malignant cervical disease and cervical cancer.
A Genomic alterations of USP13 across human cancers determined by cBioportal analysis of TCGA data. B Scatter dot plot analysis of USP13 mRNA expression against USP13 copy number alterations in cervical cancer determined by cBioportal analysis of TCGA data. Correlation was determined using Spearman’s analysis. C RT-qPCR analysis of USP13 mRNA expression in normal human keratinocytes (NHKs), HPV- C33A cells, HPV16 + SiHa and CaSKi cells and HPV18 + SW756 and HeLa cells. mRNA expression was normalized against U6 mRNA levels. D Representative western blot of USP13 expression in NHKs, C33A cells, SiHa, CaSKi, SW756 and HeLa cells. GAPDH served as a loading control. Quantification of the protein band intensities from four biological, independent repeats are shown on the right. E Representative immunohistochemical (IHC) staining of USP13 expression in cervical cancer tissues and normal cervical epithelium from a tissue microarray (TMA). Scale bars, 100 μm. Scatter dot plot analysis of USP13 expression from a larger cohort of cervical cancer cases (n = 41) and normal cervical epithelium (n = 9) is shown on the right. F Scatter dot plot of RT-qPCR analysis of USP13 mRNA expression from a panel of cervical cytology samples representing CIN lesions of increasing grade. Five samples from each clinical grade (negative (Neg) and CIN I-III) were analysed and mRNA levels were normalized to the negative samples. Samples were normalized against U6 mRNA levels. G Representative western blot of cervical cytology samples of CIN lesions of increasing grade analysed for USP13 protein expression. GAPDH served as a loading control. Scatter dot plot analysis of a larger cohort of samples (n = 15 for each grade) is shown on the right. Bars represent the mean ± standard deviation from at least three biological repeats unless otherwise stated. *p < 0.05; **p < 0.01; ***p < 0.001 (Student’s t-test).

