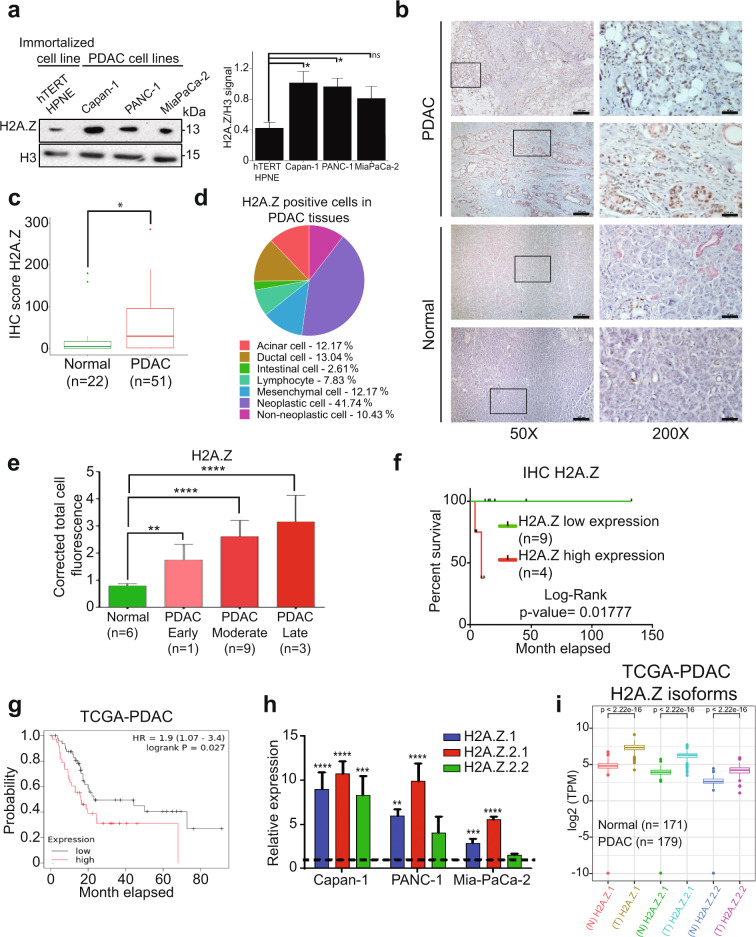
Fig. 1. The three H2A.Z isoforms are overexpressed in PDAC cell lines and in PDAC patients.
a Histone-enriched protein extracts from PDAC cell lines and the non-cancerous hTERT-HPNE cell line were analyzed by western blot using an anti-H2A.Z antibody. H3 was used as loading control. The graph shows the WB quantification depicting means ± SEM of four biological replicates. Statistical differences between two groups were evaluated using two-way ANOVA. *p value ≤ 0.05. b Normal and PDAC tissues were analyzed by IHC using an anti-H2A.Z antibody (color brown) and an anti-CK7 antibody (pink). Two representative images of PDAC and control samples at 50× are shown. The magnifications at 200× on the right correspond to the squares on the left. Scale bars = 50 μm. c IHC scores of H2A.Z staining in normal and PDAC tissues. Statistical differences between the two groups were evaluated by unpaired two-tailed Student’s t test. *p value ≤ 0.05. d Percentage of H2A.Z-positive cells. e Corrected total cell fluorescence of H2A.Z in different stages of PDAC progression. Statistical differences between two groups were evaluated using two-way ANOVA. **p value ≤ 0.01; ***p value ≤ 0.001. f Kaplan–Meier curves generated using the H2A.Z IHC score showing the average survival of Mexican PDAC patients. Log-Rank analysis gave a p value = 0.01777. g Kaplan–Meier curves generated using expression data from TCGA database. The graph shows the average survival of 90 PDAC patients with low levels of both H2A.Z isoforms (gray) and 53 PDAC patients with high levels of both H2A.Z isoforms (red). Log-Rank analysis gave a p value = 0.027. h Expression of the isoforms H2A.Z.1, H2A.Z.2.1, and H2A.Z.2.2 were analyzed by RT-qPCR in the cell lines CAPAN-1, PANC-1 and Mia-PaCa-2. Relative expression values normalized to the non-cancerous cell line hTERT-HPNE (dotted line). The means ± SEM of three biological replicates is shown. Two-way ANOVA analysis gave p values of: **p = 0.0085; ***p = < 0.001 ****p ≤ 0.0001. i Expression analysis of the three H2A.Z isoforms from the 179 PDAC samples available in the TCGA database, and 171 normal tissues available in the GTEx database. Statistical differences were evaluated by unpaired two-tailed Student’s t test.

