

Abstract
Objectives
To systematically review studies on the diagnostic accuracy of spleen stiffness measurement (SSM) for the detection of clinical significant portal hypertension (CSPH), severe portal hypertension (SPH), esophageal varices (EV), and high-risk esophageal varices (HREV) in patients with chronic liver diseases (CLD).
Methods
Through a systematic search, we identified 32 studies reporting the accuracy of SSM for the diagnosis of portal hypertension (PH) and/or EV in adults with CLD. A bivariate random-effects model was performed to estimate pooled sensitivity, specificity, likelihood ratio, positive predictive value (PPV), negative predictive value (NPV), and diagnostic odds ratios (DOR). The clinical utility of SSM was evaluated by Fagan plot.
Results
A total of 32 studies assessing 3952 patients were included in this meta-analysis. The pooled sensitivities of SSM were 0.85 (95% confidence interval (CI), 0.69–0.93) for CSPH; 0.84 (95% CI, 0.75–0.90) for SPH; 0.90 (95% CI, 0.83–0.94) for any EV; and 0.87 (95% CI, 0.77–0.93) for HREV. The pooled specificities of SSM were 0.86 (95% CI, 0.74–0.93) for CSPH; 0.84 (95% CI, 0.72–0.91) for SPH; 0.73 (95% CI, 0.66–0.79) for EV; and 0.66 (95% CI, 0.53–0.77) for HREV. Summary PPV and NPV of SSM for detecting HREV were 0.54 (95% CI, 0.47–0.62) and 0.88 (95% CI, 0.81–0.95), respectively.
Conclusions
Our meta-analysis suggests that SSM could be used as a helpful surveillance tool in management of CLD patients and was quite useful for ruling out the presence of HREV thereby avoiding unnecessary endoscopy.
Key Points
• SSM could be used to rule out the presence of HREV in patients with CLD thereby avoiding unnecessary endoscopy.
• SSM has significant diagnostic value for CSPH and SPH with high sensitivity and specificity in patients with CLD.
• SSM could be used as a helpful surveillance tool for clinicians managing CLD patients.
Electronic supplementary material
The online version of this article (10.1007/s00330-020-07223-8) contains supplementary material, which is available to authorized users.
Keywords: Elasticity imaging techniques, Spleen, Portal hypertension, Esophageal varices, Diagnosis
Introduction
Portal hypertension (PH) is a set of clinical syndromes caused by increased pressure in the portal venous system and is one of the primary consequences of chronic liver diseases (CLD), which can lead to the formation of extensive collateral circulation [1]. Clinical significant portal hypertension (CSPH) is defined as hepatic venous pressure gradient (HVPG) ≥ 10 mmHg, which could result in clinical complications of PH such as esophageal varices (EV), ascites, hepatic encephalopathy, and hepatorenal syndrome. Furthermore, severe portal hypertension (SPH) defined as HVPG ≥ 12 mmHg is a risk factor of variceal bleeding [2]. EV is the most important collateral circulation of PH and occurs in approximately 50% of cirrhotic patients, while variceal bleeding is associated with high mortality [3, 4]. Therefore, timely detection and accurate assessment are important in patients with PH and EV to ensure appropriate patient management.
HVPG and esophagogastroduodenoscopy (EGD) are currently considered the gold standards for evaluating PH and EV, respectively [5, 6]. However, measurement of the HVPG and EGD are invasive and potentially associated with complications, the application of the two types of detection methods is limited due to poor patient compliance [7]. In addition, the equipment used for HVPG measurement is demanding and requires professional technicians, so it is difficult to carry out routinely in clinical practice. Hence, alternative noninvasive techniques, with favorable diagnostic performance for evaluating PH and EV would be extremely attractive.
Elasticity imaging techniques including ultrasound elastography (USE) and magnetic resonance elastography (MRE) have been used to assess changes in spleen stiffness in various diseases [8]. Recent studies have shown that spleen stiffness is related to the progression of hepatic fibrosis, and in patients with hepatitis B/C infection, spleen stiffness is increased even though the liver stiffness is unchanged [9, 10]. Subsequent studies have demonstrated that spleen stiffness was positively correlated with HVPG and has good performance in predicting CSPH and EV in CLD patients [11, 12]. Other studies have indicated that although spleen stiffness is associated with PH, it is not sufficient to accurately assess the severity of PH [13]. Further studies have suggested that SSM could reliably rule out the presence of high-risk esophageal varices (HREV) in cirrhotic patients, independently of the etiology of cirrhosis [14, 15]. Therefore, the aim of this meta-analysis is to comprehensively assess the diagnostic performance of SSM for evaluating PH and EV in patients with CLD.
Materials and methods
This study was performed in accordance with the Preferred Reporting Items for Systematic Reviews and Meta-analyses of Diagnostic Test Accuracy Studies (PRISMA-DTA) [16], and this review was registered in the International Prospective Register of Systematic Reviews (PROSPERO, http://www.crd.york.ac.uk/PROSPERO): CRD42019122407.
Literature search
To identify studies evaluating SSM for the diagnosis of CSPH, SPH, any EV, or HREV in CLD patients, a systematic literature search was performed in PubMed, Embase, and Web of Science up to 30 April 2020. The Medical Subject Headings (MeSH) terms and free-text words terms used were as follows: spleen stiffness, portal hypertension, esophageal varices, chronic liver diseases, elastography, and diagnosis. For a comprehensive search of potentially suitable studies, a manual search was carried out by screening references of eligible articles.
Selection criteria
Eligible studies were selected by two reviewers independently with disagreements resolved by consensus. The eligible studies were identified according to the following criteria. (1) The accuracy of SSM was evaluated for the diagnosis of CSPH, SPH, EV, or HREV in adults with CLD. (2) Portal pressure was evaluated using HVPG, and EGD was used as the reference standard for EV [17]. (3) Sufficient data was provided to calculate the true positive (TP), false positive (FP), true negative (TN), and false negative (FN) of SSM for detecting CSPH, SPH, EV, or HREV. (4) At least 30 patients were evaluated to obtain good reliability. (5) Full articles were available and written in English. Duplicate publication, animal studies, and ex vivo studies were excluded.
Data extraction and quality assessment
Two reviewers independently extracted data and evaluated the quality of the included studies, disagreements were resolved by consensus. The following data was retrieved: first author, publication year, location, study design, technique of SSM, proportion of successful SSM, gold standard, the number of patients, age, sex, body mass index (BMI), proportion of cirrhosis, etiology of CLD, Child–Pugh score, cutoff values. TP, FP, TN, and FN were extracted directly or calculated. We limited extraction of data only to a validation cohort when both training and validation cohorts are provided in the same study. The quality of the studies was assessed according to the Quality Assessment of Diagnostic Accuracy Studies 2 tool (QUADAS-2) [18].
Statistical analysis and data synthesis
Summary sensitivity, specificity, positive likelihood ratio (PLR), negative likelihood ratio (NLR), positive predictive value (PPV), negative predictive value (NPV), and diagnostic odds ratio (DOR) with corresponding 95% confidence intervals (CI) were calculated using the bivariate random-effects model to examine the diagnostic accuracy of SSM. Afterwards, the hierarchical summary receiver operating characteristic (HSROC) curve and the area under the curve (AUC) were calculated. Heterogeneity was evaluated using the Cochrane Q-test and the Higgins inconsistency index (I2), with p < 0.05 or I2 > 50% suggested substantial heterogeneity [19, 20]. Sensitivity analysis was performed by restricting analysis to patients with chronic viral liver disease. Univariate meta-regression analysis and subgroup analysis were also utilized to explore possible sources of heterogeneity. The covariates included the following: (1) measurement technique (MRE vs. USE), (2) study location (European vs. Asian), (3) study design (prospective vs. retrospective or cross-sectional), (4) prevalence of diseases (≥ 50% vs. < 50%), (5) proportion of cirrhosis (total vs. mixed sample), (6) etiology of CLD (viral vs. mixed), (7) proportion of Child A (≥ 50% vs. < 50%), (8) success rate of SSM (≥ 90% vs. < 90%). Fagan plots were used to assess the clinical utility of SSM for diagnosing CSPH, SPH, EV, and HREV [21]. Publication bias was assessed by Deeks’ funnel plot, with a value of p < 0.1 for the slope coefficient suggesting significant asymmetry [22]. All of the above analyses were performed using “midas” and “metandi” modules of Stata version 13.0 (StataCorp).
Results
Search results and study characteristics
The flow chart summarizing the literature screening is illustrated in Fig. 1. A total of 379 initial articles were identified with the predefined search strategies; after 146 duplicates were removed, 165 irrelevant studies were further eliminated; 68 studies were left for further evaluation. Of these, 36 articles were excluded after full-text review for the following reasons: undesirable article types, not diagnostic accuracy study, not relevant to CLD, small sample size (fewer than 30 participants), insufficient data (TP, FP, TN, and FN not reported or could not be calculated), and not in English. Ultimately, 32 articles estimating the accuracy of SSM for the diagnosis of PH and/or EV were included [11, 13–15, 23–50].
Fig. 1.
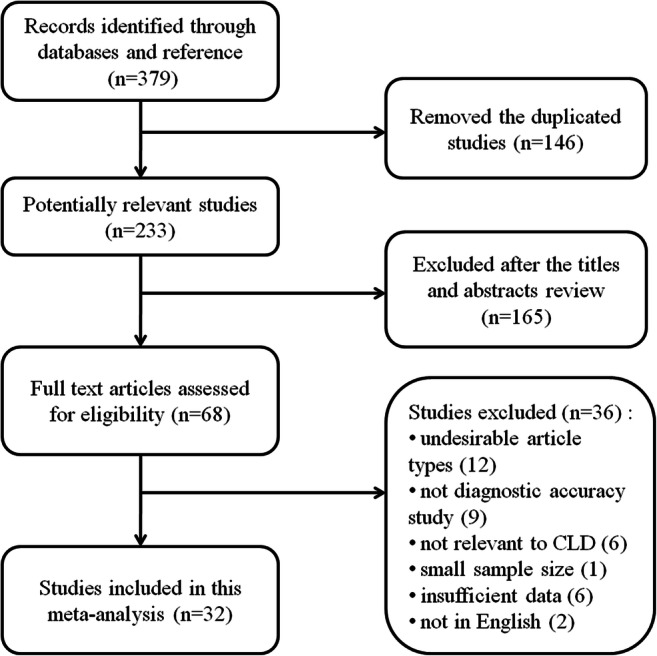
Flow chart of study selection process
According to different gold standards (HVPG and EGD), the detailed characteristics of the 32 studies were summarized in Tables 1 and 2, respectively. A total of 3952 patients with an average age of 58.8 were investigated. The 32 original articles included 15 prospective studies, 4 retrospective studies, and 13 cross-sectional studies. The results of quality assessment of the studies are shown in Fig. 2. Most studies were identified as low-risk for risk of bias and applicability concerns, with all of the studies satisfying four or more of the seven total domains (Supplementary Table 1).
Table 1.
Characteristics of the studies evaluating the performance of spleen stiffness measurement (SSM) for the detection of portal hypertension
| Author, year | Location | Study design | Technique | Manufacturer | Success rate of SSM (%) | Gold standard | No. of patients | Mean age (year) | Male (%) | Mean BMI (kg/m2) | Cirrhosis (%) | Etiology of CLD (viral, %) | Child–Pugh score (A/B/C) | Cutoff values-1 (CSPH) | Cutoff values-2 (SPH) |
|---|---|---|---|---|---|---|---|---|---|---|---|---|---|---|---|
| Hirooka, 2011 [23] | Japan | Prospective | RTE | Hitachi, Japan | NR | HVPG | 210 | 62 | 53.8 | < 25.0 | NR | 78.6 | 161/28/21 | 8.24 | 9.99 |
| Zykus, 2015 [40] | Lithuania | Prospective | TE | FibroScan, France | 92.5 | HVPG | 99 | 52 | 46.7 | 26.7 | NR | 63.6 | 69/32/1 | 47.60 kPa | 50.70 kPa |
| Colecchia, 2012 [11] | Italy | Cross-sectional | TE | FibroScan, France | 88.5 | HVPG | 100 | 54 | 71.0 | 25.0 | 100 | 100 | 68/32/0 | 52.80 kPa | 55.00 kPa |
| Tseng, 2018 [45] | China | Cross-sectional | TE | FibroScan, France | 90.0 | HVPG | 99 | 57 | 68.7 | NR | 100 | 71.2 | NR | NR | 48.90 kPa |
| Takuma, 2016 [41] | Japan | Prospective | pSWE | Siemens, Germany | 96.8 | HVPG | 60 | 71 | 56.7 | 23.4 | 100 | 71.6 | 41/18/1 | 3.10 m/s | 3.15 m/s |
| Attia, 2015 [34] | Germany | Cross-sectional | pSWE | Siemens, Germany | NR | HVPG | 78 | 53 | 61.5 | NR | 86.0 | 15.0 | 21/46/11 | 2.32 m/s | 2.53 m/s |
| Elkrief, 2015 [35] | France | Prospective | 2D-SWE | Supersonic Imagine, France | 97.5 | HVPG | 77 | 55 | 78.5 | 26.0 | 100 | 45.6 | 24/20/35 | 34.70 kPa | NR |
| Jansen, 2017 [13] | Germany | Prospective | 2D-SWE | Supersonic Imagine, France | NR | HVPG | 112 | 56 | 61.4 | NR | 100 | 7.6 | 99/45/14 | 26.30 kPa | 28.50 kPa |
| Zhu, 2019 [49] | China | Prospective | 2D-SWE | Supersonic Imagine, France | 75.4 | HVPG | 104 | 55 | 62.5 | 20.9 | 100 | 100 | 65/29/10 | 25.30 kPa | 33.40 kPa |
| Ronot, 2014 [32] | France | Prospective | MRE | Philips, The Netherlands | 86.0 | HVPG | 36 | 56 | 78.0 | 26.0 | 100 | 42.0 | 7/13/16 | NR | 2.5 kPa |
SSM spleen stiffness measurement, CSPH clinical significant portal hypertension, SPH severe portal hypertension, RTE real-time tissue elastography, TE transient elastography, MRE magnetic resonance elastography, 2D-SWE two-dimensional shear wave elastography, pSWE point shear wave elastography, HVPG hepatic venous pressure gradient
Table 2.
Characteristics of the studies evaluating the performance of spleen stiffness measurement (SSM) for the detection of esophageal varices
| Author, year | Location | Study design | Technique | Manufacturer | The proportion of successful SSM (%) | Gold standard | No. of patients | Mean age (year) | Male (%) | Mean BMI (kg/m2) | Cirrhosis (%) | Etiology of CLD (viral, %) | Child–Pugh score (A/B/C) | Cutoff values-3 (EV) | Cutoff values-4 (HREV) |
|---|---|---|---|---|---|---|---|---|---|---|---|---|---|---|---|
| Hirooka, 2011 [23] | Japan | Prospectively | RTE | Hitachi, Japan | NR | EGD | 210 | 62 | 53.8 | < 25.0 | NR | 78.6 | 161/28/21 | 8.24 | NR |
| Stefanescu, 2011 [24] | Romania | Prospectively | TE | FibroScan, France | 85.4 | EGD | 122 | 56 | 56.2 | 26.4 | 100 | NR | 65/28/7 | 46.40 kPa | NR |
| Calvaruso, 2013 [28] | Italy | Prospective | TE | FibroScan, France | 85.7 | EGD | 96 | 63 | 69.8 | 27.0 | 100 | 100 | 100/0/0 | 50.00 kPa | 54.00 kPa3 |
| Fraquelli, 2014 [30] | Italy | Prospective | TE | FibroScan, France | 83.3 | EGD | 110 | 52 | 59.1 | 23.0 | 23.6 | 100 | NR | 65.00 kPa | NR |
| Colecchia, 2012 [11] | Italy | Cross-sectional | TE | FibroScan, France | 88.5 | EGD | 100 | 54 | 71.0 | 25.0 | 100 | 100 | 68/32/0 | 55.00 kPa | NR |
| Sharma, 2013 [29] | India | Cross-sectional | TE | FibroScan, France | 89.0 | EGD | 174 | 49 | 88.5 | 24.6 | 100 | 29.9 | 55/99/20 | 40.80 kPa | NR |
| Stefanescu, 2015 [39] | Romania | Cross-sectional | TE | FibroScan, France | NR | EGD | 90 | 56 | 55.6 | 26.7 | 100 | 53.3 | 56/32/2 | NR | 53.00 kPa2 |
| WONG, 2016 [42] | China | Cross-sectional | TE | FibroScan, France | 84.1 | EGD | 144 | 58 | 79.2 | 24.4 | 100 | 100 | NR | 50.50 kPa | NR |
| Bastard, 2018 [43] | France | Cross-sectional | TE | FibroScan, France | NR | EGD | 193 | 59 | 67.9 | 26.2 | NR | NR | NR | NR | 50.3 kPa3 |
| Takuma, 2013 [14] | Japan | Prospectively | pSWE | Siemens, Germany | 95.5 | EGD | 340 | 68 | 52.0 | 23.5 | 100 | 73.8 | 226/93/21 | 3.18 m/s | 3.30 m/s2 |
| Rizzo, 2014 [31] | Italy | Prospective | pSWE | Siemens, Germany | 100 | EGD | 54 | 72 | 53.7 | NR | 100 | 100 | A/B, 15/39 | 3.10 m/s | NR |
| Kim, 2015 [37] | Korea | Prospective | pSWE | Siemens, Germany | 95.5 | EGD | 125 | 59 | 64.0 | NR | 100 | 60.8 | 84/32/8 | 3.16 m/s | 3.40 m/s3 |
| Takuma, 2016 [41] | Japan | Prospective | pSWE | Siemens, Germany | 96.8 | EGD | 60 | 71 | 56.7 | 23.4 | 100 | 71.6 | 41/18/1 | 3.36 m/s | 3.51 m/s4 |
| Carmen, 2019 [47] | Romania | Prospective | pSWE | Siemens, Germany | NR | EGD | 135 | 60 | 57.4 | NR | 100 | 71.1 | NR | 3.00 m/s | 3.50 m/s4 |
| Bota, 2012 [25] | Romania | Cross-sectional | pSWE | Siemens, Germany | 97.9 | EGD | 142 | 59 | 60.0 | 26.7 | 100 | 50.3 | 66/63/16 | NR | 2.55 m/s2 |
| Vermehren, 2012 [26] | Germany | Cross-sectional | pSWE | Siemens, Germany | 100 | EGD | 166 | 54 | 65.7 | 26.0 | 100 | 48.2 | A/B + C, 90/76 | NR | 4.13 m/s3 |
| Lucchina, 2018 [44] | Italy | Cross-sectional | pSWE | Philips, The Netherlands | 77.8 | EGD | 42 | NR | NR | NR | 100 | 61.9 | NR | 23.87 kPa | NR |
| Darweesh, 2019 [46] | Egypt | Cross-sectional | pSWE | Siemens, Germany | 99.0 | EGD | 200 | 55 | 55.5 | NR | 95.5 | 100 | A/B, 144/47 | 3.25 m/s | NR |
| Peagu, 2019 [48] | Romania | Cross-sectional | pSWE | Siemens, Germany | NR | EGD | 178 | 60 | 55.1 | NR | 100 | 100 | NR | 2.89 m/s | 3.30 m/s5 |
| Giuffre, 2019 [50] | Italy | Cross-sectional | pSWE | Philips, The Netherlands | 95.5 | EGD | 210 | 68 | 62.0 | 24.7 | 100 | 37.6 | A/B, 179/31 | 31.00 kPa | 46.00 kPa5 |
| Ye, 2012 [27] | China | Retrospective | pSWE | Siemens, Germany | NR | EGD | 73 | 39 | 59.9 | 21.9 | 100 | 100 | NR | 3.16 m/s | 3.39 m/s1 |
| Elkrief, 2015 [35] | France | Prospective | 2D-SWE | Supersonic Imagine, France | 97.5 | EGD | 77 | 55 | 78.5 | 26.0 | 100 | 45.6 | 24/20/35 | NR | 32.30 kPa4 |
| Karagiannakis, 2019 [15] | Greece | Prospective | 2D-SWE | Supersonic Imagine, France | 90.2 | EGD | 64 | 60 | 50.7 | NR | 100 | 48.9 | A/B, 53/18 | NR | 33.70 kPa5 |
| Grqurevic, 2015 [36] | Croatia | Retrospective | 2D-SWE | Supersonic Imagine, France | 84.9 | EGD | 87 | 63 | 78.2 | NR | 100 | 45.6 | 24/20/35 | 30.30 kPa | NR |
| Ronot, 2014 [32] | France | Prospective | MRE | Philips, The Netherlands | 86.0 | EGD | 36 | 56 | 78.0 | 26.0 | 100 | 42.0 | 7/13/16 | NR | 4.2 kPa4 |
| Shin, 2014 [33] | South Korea | Retrospective | MRE | GE, America | 96.8 | EGD | 139 | 57 | 73.4 | NR | 100 | 81.3 | NR | 7.23 kPa | 7.60 kPa3 |
| Morisaka, 2015 [38] | Japan | Retrospective | MRE | GE, America | NR | EGD | 93 | 69 | 63.4 | 20.8 | 15.1 | 76.3 | 74/17/2 | 5.6 kPa | 7.1 kPa2 |
SSM spleen stiffness measurement, EGD esophagogastroduodenoscopy, EV esophageal varices, HREV high-risk esophageal varices, RTE real-time tissue elastography, TE transient elastography, MRE magnetic resonance elastography, 2D-SWE two-dimensional shear wave elastography, pSWE point shear wave elastography
1HREV were defined as any grade III EV
2HREV were defined as grade I EV with red color signs and any grade II and III EV
3HREV were defined as any grade II and III EV
4HREV were defined as any grade II and III EV or as grade I EV with red color signs or Child–Pugh class C disease
5HREV were defined as esophageal varices ≥ 5 mm and/or red spots and any gastric varices
Fig. 2.

Quality assessment of the included studies according to Quality Assessment of Diagnostic Accuracy Studies-2 (QUADAS-2) criteria
Diagnostic accuracy of SSM for the detection of CSPH
The performance of SSM for the diagnosis of CSPH was evaluated in 7 studies. The pooled sensitivity and specificity of spleen stiffness for detecting CSPH were 0.85 (95% CI, 0.69–0.93) and 0.86 (95% CI, 0.74–0.93), respectively (Fig. 3a). The pooled PLR, NLR, and DOR were 5.95 (95% CI: 3.35–10.55), 0.18 (95% CI: 0.09–0.35), and 33.76 (95% CI, 16.72–68.16), respectively. Figure 4 a illustrates the HSROC curve with AUC of 0.92 (95% CI, 0.89–0.94).
Fig. 3.

Sensitivity and specificity forest plots of spleen stiffness measurement (SSM) for detecting CSPH (a), SPH (b), EV (c), and HREV (d)
Fig. 4.

Hierarchical summary receiver operating characteristic (HSROC) curve of spleen stiffness measurement (SSM) for detecting CSPH (a), SPH (b), EV (c), and HREV (d)
Diagnostic accuracy of SSM for the detection of SPH
The performance of SSM for the diagnosis of SPH was evaluated in 7 studies. The pooled sensitivity and specificity of SSM for detecting SPH were 0.84 (95% CI, 0.75–0.90) and 0.84 (95% CI, 0.72–0.91), respectively (Fig. 3b). The pooled PLR, NLR, and DOR were 5.17 (95% CI: 2.94–9.10), 0.19 (95% CI: 0.12–0.30), and 27.47 (95% CI, 12.79–59.00), respectively. Figure 4b illustrates the HSROC curve with AUC of 0.91 (95% CI, 0.88–0.93).
Diagnostic accuracy of SSM for the detection of any EV
The diagnostic accuracy of SSM for EV was evaluated in 20 studies. The pooled sensitivity and specificity of SSM for detecting CSPH were 0.90 (95% CI, 0.83–0.94) and 0.73 (95% CI, 0.66–0.79), respectively (Fig. 3c). The pooled PLR, NLR, and DOR were 3.34 (95% CI: 2.63–4.24), 0.14 (95% CI: 0.08–0.23), and 23.84 (95% CI, 12.70–44.74), respectively. Figure 4c illustrates the HSROC curve with AUC of 0.87 (95% CI, 0.84–0.90). On restricting analysis to 8 studies performed in pure chronic viral liver disease, the pooled sensitivity and specificity was 0.85 (95% CI, 0.72–0.92) and 0.76 (95% CI, 0.67–0.84), with an AUC of 0.86 (95% CI, 0.83–0.89). The sensitivity analysis did not significantly increase the diagnostic performance of SSM.
Diagnostic accuracy of SSM for the detection of HREV
The diagnostic accuracy of SSM for HREV was evaluated in 17 studies. HREV were variably defined in the included studies (Table 2). The pooled sensitivity and specificity of SSM for detecting HREV were 0.87 (95% CI, 0.77–0.93) and 0.66 (95% CI, 0.53–0.77), respectively (Fig. 4c). The pooled PLR, NLR, and DOR were 2.56 (95% CI: 1.76–3.72), 0.20 (95% CI: 0.10–0.38), and 13.01 (95% CI, 5.19–32.64), respectively. Figure 4d illustrates the HSROC curve with AUC of 0.83 (95% CI, 0.79–0.86). On the basis of these values, and assuming a 29.9% HREV (as observed in the included studies), the pooled PPV and NPV were 0.54 (95% CI: 0.47–0.62) and 0.88 (95% CI: 0.81–0.95), respectively. Considering the pooled NPV and the prevalence of HREV in the included studies, a total of 50.6% (95% CI, 43.4–59.0%) patients would avoid endoscopies with a risk of missing HREV of 8.4% (95% CI, 4.1–17.2%) in patients with the “negative” results of SSM, and 4.7% (95% CI, 2.3–9.4%) among the overall population of 2214 patients evaluated (Table 3).
Table 3.
Summary diagnostic accuracy and the post-test probabilities of spleen stiffness measurement (SSM) for CSPH, SPH, EV, and HREV
| No. of studies | Sensitivity (95% CI) | Specificity (95% CI) | PPV (95% CI) | NPV (95% CI) | PLR (95% CI) | NLR (95% CI) | DOR (95% CI) | I2 | AUC (95% CI) | Pre-test probability (%) | Post-test probability (+) (%) | Post-test probability (−) (%) | |
|---|---|---|---|---|---|---|---|---|---|---|---|---|---|
| CSPH | 7 | 0.85 (0.69–0.93) | 0.86 (0.74–0.93) | 0.94 (0.90–0.98) | 0.68 (0.54–0.84) | 5.95 (3.35–10.55) | 0.18 (0.09–0.35) | 33.76 (16.72–68.16) | 97.24% | 0.92 (0.89–0.94) | 25 | 66 | 6 |
| 50 | 86 | 15 | |||||||||||
| 75 | 95 | 35 | |||||||||||
| SPH | 7 | 0.84 (0.75–0.90) | 0.84 (0.72–0.91) | 0.89 (0.82–0.96) | 0.78 (0.67–0.90) | 5.17 (2.94–9.10) | 0.19 (0.12–0.30) | 27.47 (12.79–59.00) | 99.34% | 0.91 (0.88–0.93) | 25 | 63 | 6 |
| 50 | 84 | 16 | |||||||||||
| 75 | 94 | 36 | |||||||||||
| EV | 20 | 0.90 (0.83–0.94) | 0.73 (0.66–0.79) | 0.76 (0.69–0.83) | 0.81 (0.74–0.89) | 3.34 (2.63–4.24) | 0.14 (0.08–0.23) | 23.84 (12.70–44.74) | 100.00% | 0.87 (0.84–0.90) | 25 | 53 | 4 |
| 50 | 77 | 12 | |||||||||||
| 75 | 91 | 30 | |||||||||||
| HREV | 17 | 0.87 (0.77–0.93) | 0.66 (0.53–0.77) | 0.54 (0.47–0.62) | 0.88 (0.81–0.95) | 2.56 (1.76–3.72) | 0.20 (0.10–0.38) | 13.01 (5.19–32.64) | 100.00% | 0.83 (0.79–0.86) | 25 | 46 | 6 |
| 50 | 72 | 16 | |||||||||||
| 75 | 88 | 37 |
SSM spleen stiffness measurement, CSPH clinical significant portal hypertension (HVPG ≥ 10 mmHg), SPH severe portal hypertension (HVPG ≥ 12 mmHg), EV esophageal varices, HREV high-risk esophageal varices, PPV positive predictive value, NPV negative predictive value, PLR positive likelihood ratio, NLR negative likelihood ratio, DOR diagnostic odds ratio, AUC area under the curve
Significant heterogeneity among studies was observed in DOR (p < 0.001). The Deeks’ plot showed that there was no potential publication bias for the studies (p = 0.60, 0.95, 0.15, 0.14) (Supplementary Fig. 1).
Results of meta-regression and subgroup analysis
Univariate meta-regressions showed that the types of elastography technique, study location, study design, prevalence of diseases, etiology of CLD, proportion of Child A, and success rate of SSM were associated with the heterogeneity. SSM showed better performance for the diagnosis of any EV in Asian populations than in European populations. In addition, compared with the studies having a success rate of SSM < 90%, studies with a success rate ≥ 90% had a lower specificity for the diagnosis of any EV. The details of subgroup analysis are demonstrated in Table 4.
Table 4.
Results of subgroup analysis of spleen stiffness measurement (SSM) for the diagnosis of CSPH, SPH, EV, and HREV
| Covariates | Subgroup | CSPH | SPH | EV | HREV | ||||
|---|---|---|---|---|---|---|---|---|---|
| Sensitivity | Specificity | Sensitivity | Specificity | Sensitivity | Specificity | Sensitivity | Specificity | ||
| Technique | 1-MRE | / | / | 0.67 (0.32–1.00) | 0.92 (0.78–1.00) | 0.92 (0.78–1.00) | 0.61 (0.39–0.84) | 0.77 (0.50–1.00) | 0.34 (0.08–0.61)* |
| 0-USE | / | / | 0.85 (0.78–0.92) | 0.82 (0.72–0.92) | 0.90 (0.84–0.95) | 0.74 (0.68–0.81) | 0.88 (0.81–0.96) | 0.72 (0.62–0.82)* | |
| Location | 1-European | 0.80 (0.65–0.95) | 0.89 (0.83–0.95) | 0.85 (0.76–0.94) | 0.86 (0.75–0.97) | 0.88 (0.80–0.97)* | 0.72 (0.62–0.81)* | 0.85 (0.74–0.95) | 0.65 (0.50–0.80) |
| 0-Asian | 0.93 (0.82–1.00) | 0.69 (0.51–0.86) | 0.83 (0.71–0.95) | 0.81 (0.65–0.96) | 0.92 (0.85–0.98)* | 0.76 (0.68–0.85)* | 0.90 (0.81–1.00) | 0.68 (0.48–0.87) | |
| Design | 1-Prospective | 0.79 (0.65–0.94) | 0.83 (0.71–0.95) | 0.79 (0.68–0.90)* | 0.76 (0.64–0.88)** | 0.92 (0.85–0.98) | 0.75 (0.67–0.84) | 0.86 (0.74–0.98) | 0.63 (0.45–0.82) |
| 0-Retrospective or cross-sectional | 0.93 (0.83–1.00) | 0.91 (0.79–1.00) | 0.88 (0.79–0.96)* | 0.91 (0.83–0.98)** | 0.88 (0.81–0.96) | 0.71 (0.62–0.80) | 0.88 (0.78–0.98) | 0.53 (0.53–0.84) | |
| Prevalence | 1–≥ 50% | / | / | 0.83 (0.75–0.92) | 0.85 (0.75–0.95) | 0.86 (0.78–0.94)** | 0.73 (0.64–0.81)* | 0.73 (0.38–1.00) | 0.63 (0.26–1.00) |
| 0–< 50% | / | / | 0.87 (0.73–1.00) | 0.79 (0.59–0.99) | 0.94 (0.90–0.99)** | 0.73 (0.64–0.83)* | 0.88(0.81–0.96) | 0.66 (0.54–0.79) | |
| Cirrhosis | 1-total | 0.82 (0.68–0.96) | 0.87 (0.75–0.99) | 0.82 (0.74–0.91)* | 0.85 (0.73–0.96) | 0.88 (0.82–0.94) | 0.73 (0.67–0.79) | 0.87 (0.79–0.96) | 0.67 (0.54–0.80) |
| 0-mixed | 0.97 (0.89–1.00) | 0.91 (0.71–1.00) | 0.94 (0.86–1.00)* | 0.89 (0.66–1.00) | 0.91 (0.79–1.00) | 0.61 (0.47–0.75) | 0.95 (0.77–1.00) | 0.44 (0.10–0.98) | |
| Etiology (% viral) | 1-viral | 0.86 (0.68–1.00) | 0.87 (0.73–1.00) | 0.82 (0.68–0.96) | 0.79 (0.59–0.98) | 0.86 (0.75–0.96)* | 0.76 (0.67–0.86)* | 0.89 (0.73–1.00) | 0.80 (0.61–1.00) |
| 0-mixed | 0.84 (0.70–0.98) | 0.85 (0.73–0.96) | 0.85 (0.77–0.94) | 0.86 (0.75–0.96) | 0.93 (0.87–0.98)* | 0.71 (0.62–0.80)* | 0.87 (0.78–0.96) | 0.61 (0.47–0.76) | |
| Child A (%) | 1–≥ 50% | 0.87 (0.75–0.99) | 0.80 (0.68–0.93) | 0.85 (0.75–0.95) | 0.75 (0.66–0.83)* | 0.94 (0.89–0.99) | 0.68 (0.58–0.78)* | 0.90 (0.79–1.00) | 0.70 (0.57–0.83)* |
| 0–< 50% | 0.79 (0.51–1.00) | 0.97 (0.92–1.00) | 0.87 (0.72–1.00) | 0.90 (0.80–1.00)* | 0.92 (0.82–1.00) | 0.80 (0.66–0.95)* | 0.75 (0.43–1.00) | 0.26 (0.04–0.48)* | |
| Successful rate of SSM (%) | 1–≥ 90% | 0.76 (0.55–0.98) | 0.85 (0.67–1.00) | 0.84 (0.74–0.94) | 0.83 (0.68–0.98) | 0.95 (0.90–0.99) | 0.68 (0.60–0.76)*** | 0.88 (0.76–0.99) | 0.68 (0.51–0.84) |
| 0–< 90% | 0.86 (0.69–1.00) | 0.88 (0.70–1.00) | 0.79 (0.67–0.90) | 0.84 (0.69–0.99) | 0.80 (0.68–0.93) | 0.77 (0.70–0.83)*** | 0.68 (0.22–1.00) | 0.26 (–0.08–0.63) | |
SSM spleen stiffness measurement, CSPH clinical significant portal hypertension (HVPG ≥ 10 mmHg), SPH severe portal hypertension (HVPG ≥ 12 mmHg), EV esophageal varices, HREV high-risk esophageal varices, TE transient elastography, SWE shear wave elastography
*There were significant differences between two subgroups (p < 0.05)
**There were significant differences between two subgroups (p < 0.01)
***There were significant differences between two subgroups (p < 0.001)
Clinical utility of SSM for detecting CSPH, SPH, EV, and HREV
The Fagan plot analysis indicated that when pre-test probability was 50%, SSM was very informative with an 86% probability of correctly detecting CSPH following a “positive” measurement and lowering the probability of disease to 15% when “negative” measurement; and the probability of correctly diagnosing SPH following a “positive” measurement reached 84%. However, the probability of a correct diagnosis rate did not exceed 80% for diagnosing any EV and HREV when the pre-test probability was 50% (Table 3).
Discussion
The results of this meta-analysis indicated that spleen stiffness measured by current techniques had a fairly good accuracy for the detection of PH and EV in CLD patients. AUCs for the diagnosis of CSPH and SPH exceeded 90%, and AUCs for diagnosis of any EV and HREV reached 87% and 83%, respectively. SSM was able to predict the presence of CSPH with good sensitivity and specificity (85% and 86%, respectively). Notably, we observed that the pooled sensitivity and NPV of SSM for detecting HREV were fairly good, and was 0.87 (95% CI, 0.77–0.93) and 0.88 (95% CI, 0.81–0.95), respectively, which suggested that HREV could be ruled out in most CLD patients evaluated by SSM, thereby avoiding unnecessary endoscopy.
PH results in progressive splenomegaly and remodeled spleen, which, due to passive congestion, increased arterial blood flow and fibrogenesis that may enhance spleen stiffness, lending support to the physiological feasibility of SSM for detecting PH and EV [51, 52]. Previous studies have confirmed that USE showed good diagnostic performance for significant liver fibrosis and liver cirrhosis [53, 54]. MRE is a newly developed method to quantitatively evaluate the elasticity of living tissue that provides full-field-of-view elastograms of the abdomen with excellent diagnostic accuracy for staging hepatic fibrosis [55, 56]. Studies have demonstrated that MRE-based spleen stiffness is strongly associated with the presence of EV, and with the cutoff value of 7.23 kPa, SSM showed good performance for detecting EV in cirrhosis patients, with an AUC of 0.83 (95% CI, 0.76–0.89) [33, 38]. In the past several years, MRE-based spleen stiffness has been suggested as a valid parameter to identify the presence of EV [57].
The prevalence of varices needing treatment (VNT) is very low in patients with compensated cirrhosis [58]. Previous studies suggest that liver stiffness measurement (LSM) plus platelet count can be used to exclude the presence of HREV in patients with Child–Pugh A cirrhosis [59]. However, the performance of LSM alone in predicting PH is controversial due to lack of consistent results, which may be due to the reason that it is affected by confounding factors, such as hepatocyte inflammation and cholestasis, and it only reflects the increase of intrahepatic resistance to portal blood flow, while is unable to account for dynamic changes of the splanchnic blood flow [8]. In a meta-analysis focusing on the diagnostic performance of LSM, the DOR for evaluating any EV and HREV was 7.54 (95% CI, 4.46–12.73) and 8.85 (95% CI, 5.93–13.19), respectively [60]. In our meta-analysis, the comparable DOR of SSM were 21.92 (95% CI, 11.53-41.68) and 16.07 (95% CI, 7.15-36.14), respectively. The results show that the diagnostic accuracy of SSM for detecting EV was significantly better than that of LSM. Considering the pooled NPV (0.88) and the prevalence of HREV observed in the included studies (29.9%), a total of 1120 (50.6%) patients would avoid endoscopies with a risk of missing HREV of 4.7% among the overall 2214 patients evaluated. As compared with the Expanded-Baveno VI criteria, SSM would spare more unnecessary endoscopies (50.6% vs. 40.0%); however, the number of HREV missed increased as well (4.7% vs. 1.6%) [61]. The increase of missed diagnosis rate may be due to the prevalence rate of HREV, which is significantly greater in our meta-analysis than in the cohort of the Expanded-Baveno VI criteria (29.9% vs. 9.9%), and the NPV is affected by the prevalence of disease. When the prevalence rate is high, the NPV is relatively low, resulting in an increased rate of missed diagnosis. Accordingly, our meta-analysis demonstrated that SSM was useful for ruling out the presence of HREV in CLD patients, and a new model combined with SSM and other noninvasive criteria would probably safely avoid more endoscopies [62].
Considerable heterogeneity was observed in our study and a meta-regression analysis was performed to identify probable causes. We observed that the diagnostic performance of SSM for detecting any EV was better across Asian populations than in European populations. Previous studies have shown that BMI and central obesity are independent influencing factors for the failure and unreliability of USE [63]. The mean BMI of the subjects from European was higher (range: 23.0–27.0 kg/m2) than that of Asian subjects (range: 20.8–24.6 kg/m2). In addition, compared with the studies with a success rate of SSM < 90%, the studies with a success rate ≥ 90% had a lower specificity for detecting any EV. This may be due to the thickness of spleen, which may have affected the success rate of SSM, and when the thickness of the spleen was less than 4 cm, the success rate of SSM was low. Furthermore, the prevalence of EV increases with the degree of splenomegaly, which would lead to a decrease in the specificity of the detection.
The main strength of our study is that we comprehensively evaluated the diagnostic accuracy of spleen stiffness, measured by different techniques including USE and MRE, across variety of populations and chronic liver disease. Therefore, the result of our meta-analysis would reflect the diagnostic performance of SSM for detecting PH and EV in a real world. In addition, we separately assessed the diagnostic accuracy of SSM in detecting CSPH, SPH, any EV, and HREV, in order to evaluate the clinical application value of SSM comprehensively.
There were several limitations in this study. First, a considerable amount of heterogeneity was detected across the included studies, attributable to the types of elastography technique, study location, study design, the prevalence of disease, and several other covariates which were unrecorded in the included studies. Second, the number of eligible studies was relatively low, with only 3 studies having assessed MRE, and some relatively small samples of studies were included in our meta-analysis. In the future, large-sample and multicenter studies are needed for more comprehensive evaluation. In addition, our meta-analysis included only studies written in English, putting the results at risk of language bias. Considering these limitations, caution must be taken when interpreting the results of our study.
In conclusion, SSM was a promising method to detecting PH and EV with good diagnostic accuracy and it would be a helpful noninvasive surveillance tool for clinicians in management CLD patients. In addition, SSM could rule out the presence of HREV in most CLD patients and would be used as an initial screening method thereby avoiding unnecessary endoscopy. Future, prospective studies with larger sample size and in diverse clinical settings are required to further assess the effectiveness of SSM.
Electronic supplementary material
(DOCX 12391 kb)
Abbreviations
- CLD
Chronic liver diseases
- CSPH
Clinical significant portal hypertension
- EGD
Esophagogastroduodenoscopy
- EV
Esophageal varices
- HREV
High-risk esophageal varices
- HVPG
Hepatic venous pressure gradient
- LSM
Liver stiffness measurement
- MRE
Magnetic resonance elastography
- PH
Portal hypertension
- RTE
Real-time tissue elastography
- SPH
Severe portal hypertension
- SSM
Spleen stiffness measurement
- SWE
Shear wave elastography
- TE
Transient elastography
- USE
Ultrasound elastography
- VNT
Varices needing treatment
Funding
This work was supported by the National Science and Technology Major Project (2018ZX10302205-005), the national science and technology major project of China during the 13th five-year plan period (2017ZX10201101), the National Natural Science Foundation of China (No. 81701984), the Beijing Excellent Talent Plan (2018000021223ZK04), and 2018 Beijing Youan Hospital Scientific Research Project for Young & Middle-Aged Talent's Cultivation (YNKTTS20180106).
Compliance with ethical standards
Guarantor
The scientific guarantor of this publication is Xing Hu, MD.
Conflict of interest
The authors of this manuscript declare no relationships with any companies whose products or services may be related to the subject matter of the article.
Statistics and biometry
One of the authors, Professor Jianhua Hou, has significant statistical expertise.
Informed consent
Written informed consent was not required for this study because this study was a meta-analysis.
Ethical approval
Institutional review board approval was not required because this study was a meta-analysis.
Methodology
• Diagnostic accuracy test
• Systematic review
• Meta-analysis
Footnotes
Publisher’s note
Springer Nature remains neutral with regard to jurisdictional claims in published maps and institutional affiliations.
Xing Hu and Xiaojie Huang contributed equally to this study and share first authorship.
Change history
11/18/2020
A Correction to this paper has been published: 10.1007/s00330-020-07446-9
References
- 1.Garcia-Tsao G, Bosch J, Groszmann RJ. Portal hypertension and variceal bleeding--unresolved issues. Summary of an American Association for the study of liver diseases and European Association for the study of the liver single-topic conference. Hepatology. 2008;47:1764–1772. doi: 10.1002/hep.22273. [DOI] [PubMed] [Google Scholar]
- 2.Bosch J, Abraldes JG, Berzigotti A, Garcia-Pagan JC. The clinical use of HVPG measurements in chronic liver disease. Nat Rev Gastroenterol Hepatol. 2009;6:573–582. doi: 10.1038/nrgastro.2009.149. [DOI] [PubMed] [Google Scholar]
- 3.Garcia-Tsao G, Sanyal AJ, Grace ND, Carey W. Prevention and management of gastroesophageal varices and variceal hemorrhage in cirrhosis. Hepatology. 2007;46:922–938. doi: 10.1002/hep.21907. [DOI] [PubMed] [Google Scholar]
- 4.Carbonell N, Pauwels A, Serfaty L, Fourdan O, Levy VG, Poupon R. Improved survival after variceal bleeding in patients with cirrhosis over the past two decades. Hepatology. 2004;40:652–659. doi: 10.1002/hep.20339. [DOI] [PubMed] [Google Scholar]
- 5.Bosch J, Berzigotti A, Garcia-Pagan JC, Abraldes JG. The management of portal hypertension: rational basis, available treatments and future options. J Hepatol. 2008;48(Suppl 1):S68–S92. doi: 10.1016/j.jhep.2008.01.021. [DOI] [PubMed] [Google Scholar]
- 6.Spiegel BM, Targownik L, Dulai GS, Karsan HA, Gralnek IM. Endoscopic screening for esophageal varices in cirrhosis: is it ever cost effective? Hepatology. 2003;37:366–377. doi: 10.1053/jhep.2003.50050. [DOI] [PubMed] [Google Scholar]
- 7.Sharma VK, Nguyen CC, Crowell MD, Lieberman DA, de Garmo P, Fleischer DE. A national study of cardiopulmonary unplanned events after GI endoscopy. Gastrointest Endosc. 2007;66:27–34. doi: 10.1016/j.gie.2006.12.040. [DOI] [PubMed] [Google Scholar]
- 8.Castera L, Garcia-Tsao G. When the spleen gets tough, the varices get going. Gastroenterology. 2013;144:19–22. doi: 10.1053/j.gastro.2012.11.015. [DOI] [PubMed] [Google Scholar]
- 9.Leung VY, Shen J, Wong VW, et al. Quantitative elastography of liver fibrosis and spleen stiffness in chronic hepatitis B carriers: comparison of shear-wave elastography and transient elastography with liver biopsy correlation. Radiology. 2013;269:910–918. doi: 10.1148/radiol.13130128. [DOI] [PubMed] [Google Scholar]
- 10.Pawlus A, Inglot M, Chabowski M, et al. Shear wave elastography (SWE) of the spleen in patients with hepatitis B and C but without significant liver fibrosis. Br J Radiol. 2016;89:20160423. doi: 10.1259/bjr.20160423. [DOI] [PMC free article] [PubMed] [Google Scholar]
- 11.Colecchia A, Montrone L, Scaioli E, et al. Measurement of spleen stiffness to evaluate portal hypertension and the presence of esophageal varices in patients with HCV-related cirrhosis. Gastroenterology. 2012;143:646–654. doi: 10.1053/j.gastro.2012.05.035. [DOI] [PubMed] [Google Scholar]
- 12.Abe H, Midorikawa Y, Matsumoto N, et al. Prediction of esophageal varices by liver and spleen MR elastography. Eur Radiol. 2019;29:6611–6619. doi: 10.1007/s00330-019-06230-8. [DOI] [PubMed] [Google Scholar]
- 13.Jansen C, Bogs C, Verlinden W, et al. Shear-wave elastography of the liver and spleen identifies clinically significant portal hypertension: a prospective multicentre study. Liver Int. 2017;37:396–405. doi: 10.1111/liv.13243. [DOI] [PubMed] [Google Scholar]
- 14.Takuma Y, Nouso K, Morimoto Y, et al. Measurement of spleen stiffness by acoustic radiation force impulse imaging identifies cirrhotic patients with esophageal varices. Gastroenterology. 2013;144:92–101.e102. doi: 10.1053/j.gastro.2012.09.049. [DOI] [PubMed] [Google Scholar]
- 15.Karagiannakis DS, Voulgaris T, Koureta E, Chloupi E, Papatheodoridis GV, Vlachogiannakos J. Role of spleen stiffness measurement by 2D-shear wave elastography in ruling out the presence of high-risk varices in cirrhotic patients. Dig Dis Sci. 2019;64:2653–2660. doi: 10.1007/s10620-019-05616-4. [DOI] [PubMed] [Google Scholar]
- 16.McInnes MDF, Moher D, Thombs BD, et al. Preferred reporting items for a systematic review and meta-analysis of diagnostic test accuracy studies: the PRISMA-DTA statement. JAMA. 2018;319:388–396. doi: 10.1001/jama.2017.19163. [DOI] [PubMed] [Google Scholar]
- 17.de Franchis R. Revising consensus in portal hypertension: report of the Baveno V consensus workshop on methodology of diagnosis and therapy in portal hypertension. J Hepatol. 2010;53:762–768. doi: 10.1016/j.jhep.2010.06.004. [DOI] [PubMed] [Google Scholar]
- 18.Whiting PF, Rutjes AW, Westwood ME, et al. QUADAS-2: a revised tool for the quality assessment of diagnostic accuracy studies. Ann Intern Med. 2011;155:529–536. doi: 10.7326/0003-4819-155-8-201110180-00009. [DOI] [PubMed] [Google Scholar]
- 19.Higgins JP, Thompson SG, Deeks JJ, Altman DG. Measuring inconsistency in meta-analyses. BMJ. 2003;327:557–560. doi: 10.1136/bmj.327.7414.557. [DOI] [PMC free article] [PubMed] [Google Scholar]
- 20.Guyatt GH, Oxman AD, Kunz R, et al. GRADE guidelines: 7. Rating the quality of evidence--inconsistency. J Clin Epidemiol. 2011;64:1294–1302. doi: 10.1016/j.jclinepi.2011.03.017. [DOI] [PubMed] [Google Scholar]
- 21.Hellmich M, Lehmacher W. A ruler for interpreting diagnostic test results. Methods Inf Med. 2005;44:124–126. [PubMed] [Google Scholar]
- 22.Deeks JJ, Macaskill P, Irwig L. The performance of tests of publication bias and other sample size effects in systematic reviews of diagnostic test accuracy was assessed. J Clin Epidemiol. 2005;58:882–893. doi: 10.1016/j.jclinepi.2005.01.016. [DOI] [PubMed] [Google Scholar]
- 23.Hirooka M, Ochi H, Koizumi Y, et al. Splenic elasticity measured with real-time tissue elastography is a marker of portal hypertension. Radiology. 2011;261:960–968. doi: 10.1148/radiol.11110156. [DOI] [PubMed] [Google Scholar]
- 24.Stefanescu H, Grigorescu M, Lupsor M, Procopet B, Maniu A, Badea R. Spleen stiffness measurement using Fibroscan for the noninvasive assessment of esophageal varices in liver cirrhosis patients. J Gastroenterol Hepatol. 2011;26:164–170. doi: 10.1111/j.1440-1746.2010.06325.x. [DOI] [PubMed] [Google Scholar]
- 25.Bota S, Sporea I, Sirli R, et al. Can ARFI elastography predict the presence of significant esophageal varices in newly diagnosed cirrhotic patients? Ann Hepatol. 2012;11:519–525. [PubMed] [Google Scholar]
- 26.Vermehren J, Polta A, Zimmermann O, et al. Comparison of acoustic radiation force impulse imaging with transient elastography for the detection of complications in patients with cirrhosis. Liver Int. 2012;32:852–858. doi: 10.1111/j.1478-3231.2011.02736.x. [DOI] [PubMed] [Google Scholar]
- 27.Ye XP, Ran HT, Cheng J, et al. Liver and spleen stiffness measured by acoustic radiation force impulse elastography for noninvasive assessment of liver fibrosis and esophageal varices in patients with chronic hepatitis B. J Ultrasound Med. 2012;31:1245–1253. doi: 10.7863/jum.2012.31.8.1245. [DOI] [PubMed] [Google Scholar]
- 28.Calvaruso V, Bronte F, Conte E, Simone F, Craxi A, Di Marco V. Modified spleen stiffness measurement by transient elastography is associated with presence of large oesophageal varices in patients with compensated hepatitis C virus cirrhosis. J Viral Hepat. 2013;20:867–874. doi: 10.1111/jvh.12114. [DOI] [PubMed] [Google Scholar]
- 29.Sharma P, Kirnake V, Tyagi P, et al. Spleen stiffness in patients with cirrhosis in predicting esophageal varices. Am J Gastroenterol. 2013;108:1101–1107. doi: 10.1038/ajg.2013.119. [DOI] [PubMed] [Google Scholar]
- 30.Fraquelli M, Giunta M, Pozzi R, et al. Feasibility and reproducibility of spleen transient elastography and its role in combination with liver transient elastography for predicting the severity of chronic viral hepatitis. J Viral Hepat. 2014;21:90–98. doi: 10.1111/jvh.12119. [DOI] [PubMed] [Google Scholar]
- 31.Rizzo L, Attanasio M, Pinzone MR. A new sampling method for spleen stiffness measurement based on quantitative acoustic radiation force impulse elastography for noninvasive assessment of esophageal varices in newly diagnosed HCV-related cirrhosis. Biomed Res Int. 2014;2014:365982. doi: 10.1155/2014/365982. [DOI] [PMC free article] [PubMed] [Google Scholar]
- 32.Ronot M, Lambert S, Elkrief L, et al. Assessment of portal hypertension and high-risk oesophageal varices with liver and spleen three-dimensional multifrequency MR elastography in liver cirrhosis. Eur Radiol. 2014;24:1394–1402. doi: 10.1007/s00330-014-3124-y. [DOI] [PubMed] [Google Scholar]
- 33.Shin SU, Lee JM, Yu MH, et al. Prediction of esophageal varices in patients with cirrhosis: usefulness of three-dimensional MR elastography with echo-planar imaging technique. Radiology. 2014;272:143–153. doi: 10.1148/radiol.14130916. [DOI] [PMC free article] [PubMed] [Google Scholar]
- 34.Attia D, Schoenemeier B, Rodt T, et al. Evaluation of liver and spleen stiffness with acoustic radiation force impulse quantification elastography for diagnosing clinically significant portal hypertension. Ultraschall Med. 2015;36:603–610. doi: 10.1055/s-0041-107971. [DOI] [PubMed] [Google Scholar]
- 35.Elkrief L, Rautou PE, Ronot M, et al. Prospective comparison of spleen and liver stiffness by using shear-wave and transient elastography for detection of portal hypertension in cirrhosis. Radiology. 2015;275:589–598. doi: 10.1148/radiol.14141210. [DOI] [PubMed] [Google Scholar]
- 36.Grgurevic I, Bokun T, Mustapic S, et al. Real-time two-dimensional shear wave ultrasound elastography of the liver is a reliable predictor of clinical outcomes and the presence of esophageal varices in patients with compensated liver cirrhosis. Croat Med J. 2015;56:470–481. doi: 10.3325/cmj.2015.56.470. [DOI] [PMC free article] [PubMed] [Google Scholar]
- 37.Kim HY, Jin EH, Kim W, et al. The role of spleen stiffness in determining the severity and bleeding risk of esophageal varices in cirrhotic patients. Medicine (Baltimore) 2015;94:e1031. doi: 10.1097/MD.0000000000001031. [DOI] [PMC free article] [PubMed] [Google Scholar]
- 38.Morisaka H, Motosugi U, Ichikawa S, Sano K, Ichikawa T, Enomoto N. Association of splenic MR elastographic findings with gastroesophageal varices in patients with chronic liver disease. J Magn Reson Imaging. 2015;41:117–124. doi: 10.1002/jmri.24505. [DOI] [PubMed] [Google Scholar]
- 39.Stefanescu H, Radu C, Procopet B, et al. Non-invasive menage a trois for the prediction of high-risk varices: stepwise algorithm using lok score, liver and spleen stiffness. Liver Int. 2015;35:317–325. doi: 10.1111/liv.12687. [DOI] [PubMed] [Google Scholar]
- 40.Zykus R, Jonaitis L, Petrenkiene V, Pranculis A, Kupcinskas L. Liver and spleen transient elastography predicts portal hypertension in patients with chronic liver disease: a prospective cohort study. BMC Gastroenterol. 2015;15:183. doi: 10.1186/s12876-015-0414-z. [DOI] [PMC free article] [PubMed] [Google Scholar]
- 41.Takuma Y, Nouso K, Morimoto Y, et al. Portal hypertension in patients with liver cirrhosis: diagnostic accuracy of spleen stiffness. Radiology. 2016;279:609–619. doi: 10.1148/radiol.2015150690. [DOI] [PubMed] [Google Scholar]
- 42.Wong GL, Kwok R, Chan HL, et al. Measuring spleen stiffness to predict varices in chronic hepatitis B cirrhotic patients with or without receiving non-selective beta-blockers. J Dig Dis. 2016;17:538–546. doi: 10.1111/1751-2980.12359. [DOI] [PubMed] [Google Scholar]
- 43.Bastard C, Miette V, Cales P, Stefanescu H, Festi D, Sandrin L. A novel fibroscan examination dedicated to spleen stiffness measurement. Ultrasound Med Biol. 2018;44:1616–1626. doi: 10.1016/j.ultrasmedbio.2018.03.028. [DOI] [PubMed] [Google Scholar]
- 44.Lucchina N, Recaldini C, Macchi M, et al. Point shear wave elastography of the spleen: its role in patients with portal hypertension. Ultrasound Med Biol. 2018;44:771–778. doi: 10.1016/j.ultrasmedbio.2017.11.019. [DOI] [PubMed] [Google Scholar]
- 45.Tseng Y, Li F, Wang J, et al. Spleen and liver stiffness for noninvasive assessment of portal hypertension in cirrhotic patients with large esophageal varices. J Clin Ultrasound. 2018;46:442–449. doi: 10.1002/jcu.22635. [DOI] [PubMed] [Google Scholar]
- 46.Darweesh SK, Yosry A, Salah M, et al. Acoustic radiation forced impulse-based splenic prediction model using data mining for the noninvasive prediction of esophageal varices in hepatitis C virus advanced fibrosis. Eur J Gastroenterol Hepatol. 2019;31:1533–1539. doi: 10.1097/MEG.0000000000001458. [DOI] [PubMed] [Google Scholar]
- 47.Fierbinteanu-Braticevici C, Tribus L, Peagu R, Petrisor A, Baicus C, Cretoiu D. Spleen stiffness as predictor of esophageal varices in cirrhosis of different etiologies. Sci Rep. 2019;9:16190. doi: 10.1038/s41598-019-52407-y. [DOI] [PMC free article] [PubMed] [Google Scholar]
- 48.Peagu R, Sararu R, Necula A, Moldoveanu A, Petrisor A, Fierbinteanu-Braticevici C. The role of spleen stiffness using ARFI in predicting esophageal varices in patients with hepatitis B and C virus-related cirrhosis. Rom J Intern Med. 2019;57:334–340. doi: 10.2478/rjim-2019-0017. [DOI] [PubMed] [Google Scholar]
- 49.Zhu YL, Ding H. Portal hypertension in hepatitis B-related cirrhosis: diagnostic accuracy of liver and spleen stiffness by 2-D shear-wave elastography. Hepatol Res. 2019;49:540–549. doi: 10.1111/hepr.13306. [DOI] [PubMed] [Google Scholar]
- 50.Giuffre M, Macor D, Masutti F, et al. Spleen Stiffness Probability Index (SSPI): a simple and accurate method to detect esophageal varices in patients with compensated liver cirrhosis. Ann Hepatol. 2020;19:53–61. doi: 10.1016/j.aohep.2019.09.004. [DOI] [PubMed] [Google Scholar]
- 51.Iwakiri Y, Groszmann RJ. The hyperdynamic circulation of chronic liver diseases: from the patient to the molecule. Hepatology. 2006;43:S121–S131. doi: 10.1002/hep.20993. [DOI] [PubMed] [Google Scholar]
- 52.Mejias M, Garcia-Pras E, Gallego J, Mendez R, Bosch J, Fernandez M. Relevance of the mTOR signaling pathway in the pathophysiology of splenomegaly in rats with chronic portal hypertension. J Hepatol. 2010;52:529–539. doi: 10.1016/j.jhep.2010.01.004. [DOI] [PubMed] [Google Scholar]
- 53.Tsochatzis EA, Gurusamy KS, Ntaoula S, Cholongitas E, Davidson BR, Burroughs AK. Elastography for the diagnosis of severity of fibrosis in chronic liver disease: a meta-analysis of diagnostic accuracy. J Hepatol. 2011;54:650–659. doi: 10.1016/j.jhep.2010.07.033. [DOI] [PubMed] [Google Scholar]
- 54.Berzigotti A. Non-invasive evaluation of portal hypertension using ultrasound elastography. J Hepatol. 2017;67:399–411. doi: 10.1016/j.jhep.2017.02.003. [DOI] [PubMed] [Google Scholar]
- 55.Talwalkar JA, Yin M, Venkatesh S, et al. Feasibility of in vivo MR elastographic splenic stiffness measurements in the assessment of portal hypertension. AJR Am J Roentgenol. 2009;193:122–127. doi: 10.2214/AJR.07.3504. [DOI] [PMC free article] [PubMed] [Google Scholar]
- 56.Reiter R, Tzschätzsch H, Schwahofer F, et al. Diagnostic performance of tomoelastography of the liver and spleen for staging hepatic fibrosis. Eur Radiol. 2020;30:1719–1729. doi: 10.1007/s00330-019-06471-7. [DOI] [PMC free article] [PubMed] [Google Scholar]
- 57.Nedredal GI, Yin M, McKenzie T, et al. Portal hypertension correlates with splenic stiffness as measured with MR elastography. J Magn Reson Imaging. 2011;34:79–87. doi: 10.1002/jmri.22610. [DOI] [PMC free article] [PubMed] [Google Scholar]
- 58.Ding NS, Nguyen T, Iser DM, et al. Liver stiffness plus platelet count can be used to exclude high-risk oesophageal varices. Liver Int. 2016;36:240–245. doi: 10.1111/liv.12916. [DOI] [PubMed] [Google Scholar]
- 59.de Franchis R. Expanding consensus in portal hypertension: report of the Baveno VI Consensus Workshop: stratifying risk and individualizing care for portal hypertension. J Hepatol. 2015;63:743–752. doi: 10.1016/j.jhep.2015.05.022. [DOI] [PubMed] [Google Scholar]
- 60.Shi KQ, Fan YC, Pan ZZ, et al. Transient elastography: a meta-analysis of diagnostic accuracy in evaluation of portal hypertension in chronic liver disease. Liver Int. 2013;33:62–71. doi: 10.1111/liv.12003. [DOI] [PubMed] [Google Scholar]
- 61.Augustin S, Pons M, Maurice JB, et al. Expanding the Baveno VI criteria for the screening of varices in patients with compensated advanced chronic liver disease. Hepatology. 2017;66:1980–1988. doi: 10.1002/hep.29363. [DOI] [PubMed] [Google Scholar]
- 62.Colecchia A, Ravaioli F, Marasco G, et al. A combined model based on spleen stiffness measurement and Baveno VI criteria to rule out high-risk varices in advanced chronic liver disease. J Hepatol. 2018;69:308–317. doi: 10.1016/j.jhep.2018.04.023. [DOI] [PubMed] [Google Scholar]
- 63.Bota S, Sporea I, Sirli R, et al. Factors associated with the impossibility to obtain reliable liver stiffness measurements by means of acoustic radiation force impulse (ARFI) elastography--analysis of a cohort of 1,031 subjects. Eur J Radiol. 2014;83:268–272. doi: 10.1016/j.ejrad.2013.11.019. [DOI] [PubMed] [Google Scholar]
Associated Data
This section collects any data citations, data availability statements, or supplementary materials included in this article.
Supplementary Materials
(DOCX 12391 kb)