

Summary
The complex architecture of transmembrane proteins requires quality control (QC) of folding, membrane positioning, and trafficking as prerequisites for cellular homeostasis and intercellular communication. However, it has remained unclear whether transmembrane protein-specific QC hubs exist. Here we identify cereblon (CRBN), the target of immunomodulatory drugs (IMiDs), as a co-chaperone that specifically determines chaperone activity of HSP90 toward transmembrane proteins by means of counteracting AHA1. This function is abrogated by IMiDs, which disrupt the interaction of CRBN with HSP90. Among the multiple transmembrane protein clients of CRBN-AHA1-HSP90 revealed by cell surface proteomics, we identify the amino acid transporter LAT1/CD98hc as a determinant of IMiD activity in multiple myeloma (MM) and present an Anticalin-based CD98hc radiopharmaceutical for MM radio-theranostics. These data establish the CRBN-AHA1-HSP90 axis in the biogenesis of transmembrane proteins, link IMiD activity to tumor metabolism, and nominate CD98hc and LAT1 as attractive diagnostic and therapeutic targets in MM.
Keywords: chaperones, IMiDs, ubiquitin, HSP90, multiple myeloma, CD98hc, LAT1, radio-theranostics, protein quality control, CRBN
Graphical abstract
Highlights
-
•
CRBN functions as a transmembrane protein-specific co-chaperone of HSP90
-
•
Disruption of CRBN-HSP90 interaction determines the anti-tumor activity of IMiDs
-
•
The CD98hc/LAT1 complex is a central target of IMiDs in multiple myeloma
-
•
CD98hc-Anticalin is a theranostic tool in multiple myeloma
Heider et al. investigate the molecular function of immunomodulatory drugs (IMiDs) and describe their target, CRBN, as a transmembrane protein (TP)-specific co-chaperone of the HSP90-AHA1 axis. By disrupting CRBN-HSP90 interaction, IMiDs lead to destabilization of various TPs as CD98hc/LAT1, which serve as therapeutic targets in multiple myeloma.
Introduction
Faithful biogenesis of transmembrane proteins (TPs) is vital for cellular homeostasis, adhesion, migration, and intercellular communication (Guna and Hegde, 2018). Aberrant TPs have been established as cancer hallmarks and are successfully targeted by immunotherapeutic and molecular cancer treatments (Lin et al., 2019). Central tasks in TP biogenesis include the folding of extra-membrane domains as well as membrane insertion of the hydrophobic transmembrane domains, thereby avoiding aggregation and erroneous interactions (Cymer et al., 2015; Guna and Hegde, 2018). Cytoplasmic chaperone machineries that specialize on TP quality control would be considered central to these processes, yet their identity remains largely unknown. One example marks the quality control of CF-transmembrane conductance regulator (CFTR). Here, a specific mutation (ΔF508) results in defective folding and trafficking of CFTR from the endoplasmic reticulum (ER) to the plasma membrane, which is considered to be the molecular cause of cystic fibrosis (CF) (Goetz and Ren, 2019; Kerem et al., 1989). The underlying mechanism is a failure of this mutant to pass heat shock protein of 90 kDa (HSP90)-dependent protection/folding with the consequence of sorting to the ER-associated degradation (ERAD) pathway. Downregulation of the activator of HSP90 ATPase activity 1 (AHA1) was shown to rescue cell surface expression of ΔF508 CFTR by increasing the client-HSP90 dwelling time, suggesting a fundamental role of the AHA1-HSP90 axis in CFTR quality control (Koulov et al., 2010; Retzlaff et al., 2010; Wang et al., 2006).
AHA1 is the most potent ATPase activity stimulator of HSP90, an essential chaperone that facilitates the maturation, stability, and activity of several hundred client proteins (Taipale et al., 2012; Schopf et al., 2017; Wolmarans et al., 2016). AHA1 promotes the formation of the N-terminally dimerized, closed state of HSP90 and binds to HSP90 in the middle domain as well as in the ATP-binding N-terminal domain in an asymmetric manner, with one AHA1 molecule per HSP90 dimer being sufficient to stimulate the ATPase activity of the HSP90 dimer (Meyer et al., 2004; Retzlaff et al., 2010). In addition, tyrosine phosphorylation of AHA1 has been suggested to increase HSP90 ATPase activity (Dunn et al., 2015). Despite these insights, it has remained unclear how specific activity of the AHA1-HSP90 nexus toward TPs is procured.
Cereblon (CRBN) is the primary target by which immunomodulatory drugs (IMiDs) such as thalidomide and its derivatives lenalidomide and pomalidomide mediate their anti-tumor and teratogenic activities (Ito et al., 2010; Lopez-Girona et al., 2012; Zhu et al., 2011). IMiDs have evolved as key treatment modalities for different hematological malignancies, particularly multiple myeloma (MM), mantle cell lymphoma, and del(5q) myelodysplastic syndromes (Raza et al., 2017). CRBN has been characterized as a substrate-recruiting determinant of the CUL4-RBX1-DDB1 ubiquitin ligase complex (CRL4) that becomes re-directed toward neo-substrates such as IKZF1/3 and CK1α by certain IMiDs, thereby promoting their ubiquitylation and proteasomal degradation (Fischer et al., 2014; Gandhi et al., 2014; Krönke et al., 2014, 2015; Lu et al., 2014; Zhu et al., 2014). This has led to the development of IMiD-based proteolysis-targeting chimeras (PROTACs), which mediate interaction between CRL4CRBN and typically undruggable neo-targets to induce their degradation (Winter et al., 2015). However, the pleiotropic anti-tumor effects of IMiDs, their adverse effects such as teratogenicity and neurotoxicity, and most important their striking synergy with proteasome inhibitors (PIs) in MM suggest additional mechanisms of action. Along this line, the structure of CRBN, which comprises a large LON domain shared with Clp family chaperones and Lon proteases (Smith et al., 1999), next to the hydrophobic pocket of the thalidomide binding domain (TBD), suggests functions beyond ubiquitin ligase activity. Indeed, we previously found CRBN to exist in ubiquitin ligase-independent complexes, where it stabilizes two TPs, CD147 (also known as basigin) and monocarboxylate transporter 1 (MCT1) (Eichner et al., 2016). We further demonstrated that IMiDs interfere with this function of CRBN in a competitive manner to mediate anti-tumor and teratotoxic effects (Eichner et al., 2016). However, it has remained unclear how CRBN confers such quality control functions toward client proteins and whether CRBN has other clients whose functional loss may contribute to IMiD efficacy.
Here, we set out to study the underlying mechanism of CRBN quality control activity. Starting from an approach that combined unbiased cell surface proteomics with functional CRBN interactome screens, we identified a global TP-specific chaperone network comprising CRBN, HSP90, and AHA1. Herein, CRBN regulates HSP90 function by antagonizing AHA1, which allows correct folding and maturation of TPs. Among the various novel CRBN/HSP90/AHA1 client candidates, we specify the amino acid transporter complex LAT1 (SLC7A5)/CD98hc (SLC3A2) as a new vulnerability in MM, which becomes destabilized and inactivated upon IMiD treatment. We thus link IMiD activity to tumor metabolism and characterize CD98hc as target for radio-theranostic approaches.
Results
Cell surface proteomics reveal a broad effect of IMiDs on TP abundance and specify CD98hc/LAT1 as novel CRBN clients
To start investigating the impact of IMiDs on TPs, we performed quantitative unbiased proteomic screens of the MM cell surface proteome using cell surface biotinylation, streptavidin affinity purification, and mass spectrometry (Figures 1A, S1A, and S1B). Strikingly, we observed broad alterations of cell surface protein abundance in response to lenalidomide treatment (Figure 1A). We cross-validated these results with our previous CRBN interactome dataset (Eichner et al., 2016) in order to distinguish direct CRBN clients. This approach yielded CD98hc (CD98 heavy chain) as the most significant hit that becomes destabilized upon IMiD treatment and binds to CRBN (Figure 1A; Figure S1C).
Figure 1.

Cell surface proteomics reveal a broad effect of IMiDs on transmembrane protein abundance and specify CD98hc/LAT1 as novel CRBN clients
(A) Quantitative cell surface proteome of MM1s cells treated with lenalidomide versus solvent. MM1S cells were cultured in SILAC and control medium and subjected to treatment with 10 μM lenalidomide or DMSO for 48 h, followed by cell surface biotinylation, streptavidin affinity purification, and mass spectrometry (MS) analysis. Plasma membrane proteins (according to Gene Ontology cellular component [GOCC]) are depicted by blue circles. Solute carrier protein family members are marked by a yellow dot. Potential interactors of CRBN identified by tandem-affinity purification and MS are circled in red.
(B) Representative immunoblot analysis of MM1S cells that were treated with DMSO, 10 μM lenalidomide (Len), 1 μM pomalidomide (Pom), or 100 μM thalidomide (Thal) for 72 h.
(C) Representative immunoblot analysis of MM1SWT or MM1S with CRISPR-Cas9-mediated homozygous deletion of CRBN (clones T11 and T21).
(D) Representative immunofluorescence images of HeLa cells that were transfected with constructs encoding both HA-CD98hc and FLAG-LAT1 and expressing the indicated short hairpin RNAs (shRNAs). Cells were stained with antibodies to HA (green) and FLAG (red), and DNA was stained with DAPI (blue). Scale bars, 10 μm. Quantification and confirmation of knockdown are presented in Figure S1E.
(E) Immunoprecipitation (IP) of FLAG-tagged LAT1 from HEK293T cells. Immunocomplexes and respective whole-cell extracts (WCE) were probed with antibodies to the indicated proteins.
(F) IP of FLAG-CD98hc from HEK293T cells. Immunoblot analysis of whole-cell extracts and immunocomplexes was performed as indicated.
(G) IP of FLAG-CRBNWT or CRBNYW/AA from CRBN−/− HEK293T co-expressing LAT1. Cells were pretreated with lenalidomide (50 μM) or DMSO for 24 h prior to harvest and immunoblot analysis.
CD98hc forms a heterodimeric amino acid transporter complex with LAT1, which preferentially transports neutral branched or aromatic amino acids (Yan et al., 2019). LAT1 expression levels increase with progression of plasma cell disorders and have been associated with high proliferation and poor prognosis in MM patients (Bolzoni et al., 2016; Isoda et al., 2014).
To validate the screen, we treated MM cells with thalidomide, lenalidomide, and pomalidomide and observed a substantial destabilization of CD98hc and LAT1 (Figure 1B). We therefore went on to investigate CD98hc/LAT1 as potential novel CRBN-dependent IMiD target proteins. CRISPR-Cas9-mediated depletion of CRBN led to reduced protein abundance of CD98hc and LAT1 (Figure 1C). Unchanged or elevated CD98hc and LAT1 mRNA levels upon lenalidomide treatment confirmed a post-transcriptional mechanism independent of the CRL4CRBN neo-substrate transcription factors IKZF1/3 (Figure S1D). In addition, depletion of CRBN led to subcellular mis-localization of the CD98hc/LAT1 complex and cytoplasmic accumulation at the ER/Golgi, indicative of protein misfolding (Figures 1D, S1E, S6F, and S6G). We further found specific and direct interaction of CRBN with CD98hc/LAT1 (Figures 1E, 1F, and S1F) and mapped the binding site to the N-terminal intracellular regions of CD98hc and LAT1 (Figure S1F). The IMiD binding-defective mutant CRBNYW/AA (mutation of Tyr384 and Trp386 to Ala) (Ito et al., 2010) failed to interact with CD98hc and LAT1, and IMiD treatment abrogated the interaction of CRBN with CD98hc and LAT1, suggesting that IMiDs compete with these TPs for binding to CRBNs TBD (Figures 1G and S1G).
Together, our cross-validated, unbiased screens and biochemical experiments identify the CD98hc/LAT1 complex as a new CRBN interactor that becomes destabilized upon IMiD treatment.
CRBN interacts with the ATP-bound conformation of HSP90
We next elucidated the mechanism by which CRBN mediates quality control activity toward its client proteins. Further interrogation of the CRBN interactome revealed AHA1 as a specific interactor of CRBN (Figure S1C). We therefore hypothesized that CRBN may be involved in the HSP90-AHA1 chaperone complex. Indeed, we found AHA1 and HSP90α to specifically interact with endogenous CRBN in MM cells (Figures 2A and S2A). Importantly, we ruled out the possibility of CRBN being an HSP90 client. Although treatment of MM cells with different HSP90 inhibitors destabilized the HSP90 client glucocorticoid receptor in a concentration- and time-dependent manner and induced HSP70 (Sittler et al., 2001), CRBN levels remained stable (Figures S2B and S2C) and did not accumulate in the insoluble fraction (Figure S2D).
Figure 2.

CRBN interacts with the ATP-bound conformation of HSP90
(A) Endogenous IP of CRBN from U266 cells and analysis of co-purified endogenous proteins as indicated. The asterisk marks an unspecific band. LE, long exposure; SE, short exposure.
(B) IP analysis of different FLAG-HSP90⍺ mutants transfected into HEK293T cells (right). Models of HSP90 dimer conformations induced by the indicated mutations (left).
(C) IP analysis of FLAG-HSP90⍺ transfected into HEK293T cells. Lysis and IP was performed in the absence or presence of 20 mM sodium molybdate.
(D) Sequential FLAG/HA IP from HEK293T WCE transfected with the indicated HSP90⍺ constructs. After lysis and FLAG IP, bait was eluted with FLAG peptide and used for an HA IP, resulting in complexes consisting of one FLAG- and one HA-tagged HSP90 protomer. The second lane contains complexes with both unmutated promoters; in the third lane, one protomer carries a V410E mutation.
(E) IP analysis of FLAG-HSP90⍺ transfected into CRBN−/− HEK293T WCE reconstituted with CRBNWT or CRBNYW/AA as indicated. Cells were pretreated with lenalidomide (50 μM), 17-AAG (1 μM), or DMSO for 24 h prior to harvest.
(F) Quantification of IP analysis presented in (E) (n = 3 independent experiments).
Data are mean ± SD. ∗∗p < 0.01 and ∗∗∗p < 0.001 by one-sample t test.
Using bidirectional mapping studies, we found CRBN to interact with the middle and C-terminal domains of HSP90 (Figures S3A and S3B) and HSP90 to bind to the LON domain and DDB1-binding region of CRBN (Figures S3C–S3F). Notably, HSP90 also co-precipitated with the IMiD binding-defective mutant CRBNYW/AA (Figure S3C).
To investigate the relation of CRBN binding to the HSP90 folding cycle, we made use of mutants that keep the HSP90 dimer locked in the N-terminally closed (HSP90E47A) or open (HSP90D93A) state (Panaretou et al., 2002). We found CRBN to preferentially interact with the closed conformation, a pattern that is shared with AHA1 and p23 (Figure 2B) (Ali et al., 2006; Meyer et al., 2004). A point mutation in the middle domain of HSP90 (HSP90V410E) (Retzlaff et al., 2010) abrogated the CRBN-HSP90 interaction, thus further supporting binding of CRBN with the HSP90 middle domain (Figure 2B). Molybdate stabilizes the nucleotide-bound state of the HSP90 dimer and has been shown to increase the interaction of HSP90 with its conformation-specific co-chaperones p23 and AHA1 (Sullivan et al., 1997; Sun et al., 2015). Indeed, addition of molybdate to cell extracts markedly stabilized the CRBN-HSP90 interaction, thus confirming conformation-specific binding (Figures 2C and S3G). In contrast, the interaction of HSP90 with the proposed client proteins CD98hc or LAT1 was not changed by molybdate (Figures S3H and S3I). To investigate if CRBN binds to both or just one protomer within the HSP90 dimer, we chose an established approach based on overexpressing either HA-tagged and FLAG-tagged HSP90WT protomers or HA-HSP90WT and FLAG-HSP90V410E mutant protomers (abrogating CRBN and AHA1 binding to HSP90) (Retzlaff et al., 2010; Woodford et al., 2017). Using sequential FLAG and HA immunoprecipitation (IP), we isolated HSP90 dimers consisting of either a wild-type HA-HSP90WT and a FLAG-HSP90WT protomer (Figure 2D, lane 2) or a wild-type HA-HSP90WT and a mutated FLAG-HSP90V410E protomer (Figure 2D, lane 3). As opposed to AHA1, which has been shown to bind asymmetrically to the HSP90 molecule and require only one wild-type protomer, (Retzlaff et al., 2010), CRBN required two wild-type HSP90WT protomers for interaction (Figure 2D).
Next, we investigated the impact of IMiDs and HSP90 inhibitors on the HSP90-CRBN interaction. Strikingly, lenalidomide almost completely abrogated CRBN binding to HSP90, while the interaction with the IMiD binding-defective mutant CRBNYW/AA remained unaffected (Figures 2E, 2F, S4A, and S4B). The HSP90 inhibitor geldanamycin (GA) mimics an ADP-bound state, thus inhibiting ATPase activity and locking the chaperone cycle in the early complex (Neckers, 2003; Zhang et al., 2008). Notably, treatment with the GA analog 17-N-allylamino-17-demethoxygeldanamycin (17-AAG) suppressed HSP90 association with both CRBNWT and CRBNYW/AA, thus confirming the conformation-specific interaction (Figures 2E and 2F).
Together, these findings suggest that CRBN specifically interacts with the middle domain of the nucleotide bound, N-terminally closed state of the HSP90α dimer via its LON domain. At the same time, IMiD binding to the YW motif containing hydrophobic pocket of CRBN abrogates HSP90 association with the LON domain of CRBN.
CRBN modulates HSP90-AHA1 activity toward client proteins
Because HSP90 and AHA1 have been implicated in the folding of CFTR (Koulov et al., 2010; Wang et al., 2006), we reasoned that CRBN may exert its stabilizing effects on the identified TPs via modulation of this axis. Importantly, a previous study on the phosphorylation-dependent interactome of AHA1 found CRBN to preferentially interact with a phospho-mimic form of AHA1 (AHA1Y223E) (Wolfgeher et al., 2015). Phosphorylation of AHA1 at Y223 enhances binding to HSP90, thereby leading to increased HSP90 ATPase activity and compromised folding of CFTR (Dunn et al., 2015). To test if CRBN affects the HSP90-AHA1 interplay, we first confirmed increased binding between AHA1Y223E and CRBN (Figure 3A). Surprisingly, in contrast to HSP90, lenalidomide treatment did not affect the CRBN-AHA1 interaction, suggesting that CRBN additionally binds to AHA1 independent of HSP90 (Figures 3B and S4C). The introduction of the AHA1E67K mutation, which disrupts HSP90 binding (Meyer et al., 2004), did also not alter AHA1-CRBN interaction (Figures 3C and S4D), and lenalidomide did not change the AHA1-HSP90 interaction (Figure S4E). We also excluded the possibility of CRBN indirectly interacting with HSP90 via AHA1 by performing interaction studies upon AHA1 depletion (Figures 3D and S4F). Together, these data suggest that CRBN independently binds to both AHA1 and HSP90.
Figure 3.

CRBN modulates HSP90-AHA1 activity toward client proteins
(A) IP analysis of FLAG-CRBN from HEK293T cells with co-expression of either AHA1WT or AHA1Y223E using low-salt buffer.
(B) IP analysis of FLAG-CRBNWT or CRBNYW/AA from CRBN−/− HEK293T WCE in low-salt buffer. Cells were treated with DMSO or lenalidomide (50 μM) for 24 h prior to harvest and immunoblot analysis.
(C) IP analysis of FLAG-AHA1 mutants transfected into HEK293T cells using low-salt buffer.
(D) IP analysis of FLAG-CRBN transfected into HEK293T cells, in which AHA1 was lentivirally silenced using the indicated shRNAs.
(E) Immunoblot analysis of HEK293T cells transfected with CFTR, FLAG-AHA1Y223E, and different CRBN constructs as indicated. Cells were treated with DMSO or lenalidomide (50 μM) for 24 h prior to harvest and immunoblot analysis.
(F) Quantification of the immunoblot analysis (lanes 2–4) presented in (C) (n = 3 independent experiments).
(G) In vitro ATPase activity of HSP90 with addition of CRBN, AHA1WT purified from 293T cells. Lenalidomide (1 μM) was added as indicated. Purified proteins are shown in Figure S4H.
Data in this figure are mean ± SD. ∗∗p < 0.01, ∗∗∗p < 0.001, and ∗∗∗∗p < 0.0001 by one-sample t test or Student’s t test.
Next, we tested the effect of CRBN on the stability of CFTR. Strikingly, forced expression of CRBN reversed the negative impact of AHA1 on CFTR protein stability, whereas lenalidomide abrogated this effect (Figures 3E and 3F). Both IMiD and TP binding-defective (CRBNYW/AA) as well as DDB1 and HSP90 binding-defective (CRBNΔmid) mutants had no effect on the AHA1-induced CFTR destabilization, excluding any unspecific effects of forced CRBN expression (Figure 3E). Importantly, CRBNYW/AA and lenalidomide treatment showed reduced CRBN binding to CFTR (Figure S4G), which is in line with our data on CD98hc/LAT1 (Figures 1G and S1G).
To investigate whether CRBN directly regulates the ATPase activity of HSP90 in vitro, we determined the impact of CRBN on HSP90-AHA1, applying an assay that detects ATP hydrolysis (Dunn et al., 2015). Strikingly, addition of CRBN to HSP90-AHA1 complexes dramatically reduced ATP hydrolysis, while addition of lenalidomide restored HSP90 ATPase activity (Figures 3G and S4H). In a second approach, CRBN was purified together with DDB1 from insect cells (Figure S4I). Addition of this complex to HSP90-AHA1 also reduced ATP hydrolysis significantly, which could be reversed by lenalidomide (Figure S4J). Validity was ascertained by addition of the HSP90 inhibitor 17-AAG (Figure S4K).
Together, these data identify CRBN as an HSP90-AHA1 co-chaperone, which counteracts the negative effect of AHA1 on client protein stability by attenuating HSP90’s ATPase activity. Although CRBN allows sufficient HSP90 client dwelling time and client folding, IMiD treatment abrogates CRBN binding to HSP90 and reverses its stabilizing effect.
CRBN is a TP-specific co-chaperone of the HSP90-AHA1 axis
We next elucidated whether the stabilizing effect of CRBN toward CD98hc and LAT1 results from modulation of HSP90 chaperoning activity and if this HSP90 function extends to a larger panel of TPs. First, we treated MM cells with lenalidomide and the HSP90 inhibitor 17-AAG and analyzed different TPs identified in our surface screen as well as non-TP HSP90 clients. Importantly, both lenalidomide and 17-AAG destabilized all probed TPs, including CD98hc and LAT1 as well as CD147, MCT1, and CFTR (Figure 4A). In contrast, all non-TPs were destabilized only by 17-AAG and remained unaffected by IMiD treatment, indicating that IMiD effects are restricted to TPs (Figure 4A). Indeed, knockdown of CRBN destabilized only TPs, whereas non-TPs remained unaltered (Figure S5A). Moreover, we found these TPs to interact with both CRBN and HSP90 (Figures S5B and S5C), whereas non-TP HSP90 clients did not co-immunoprecipitate with CRBN, with the exception of CUL4A and DDB1, which are components of the CRL4CRBN ligase (Figures S5D and S5E).
Figure 4.

CRBNs is a transmembrane protein-specific co-chaperone of the HSP90-AHA1 axis
(A) Immunoblot analysis of TM proteins identified in the cell surface analysis (left panel) and known non-TM HSP90 clients (right panel) from MM1S cells that were treated with 10 μM lenalidomide or 1 μM 17-AAG for 72 h before harvest.
(B) Representative immunofluorescence images of HeLa cells that were transfected with constructs encoding HA-CD98hc and FLAG-LAT1. The cells were stained with antibodies to HA (green) and FLAG (red). DNA was stained with DAPI (blue). Cells were treated with 50 μM lenalidomide, 50nM 17-AAG, and DMSO for 16 h as indicated. Scale bars, 10 μm. Quantification is presented in Figures S6D and S6E.
(C) IP analysis of FLAG-CD98hc from HEK293T cells that were treated with cycloheximide (CHX) for the indicated times before harvest to block de novo protein synthesis.
(D) IP analysis of FLAG-LAT1 from HEK293T cells that were processed and analyzed as in (C).
(E) Immunoblot analysis of MM1S cells, in which AHA1 was lentivirally silenced using the indicated shRNAs.
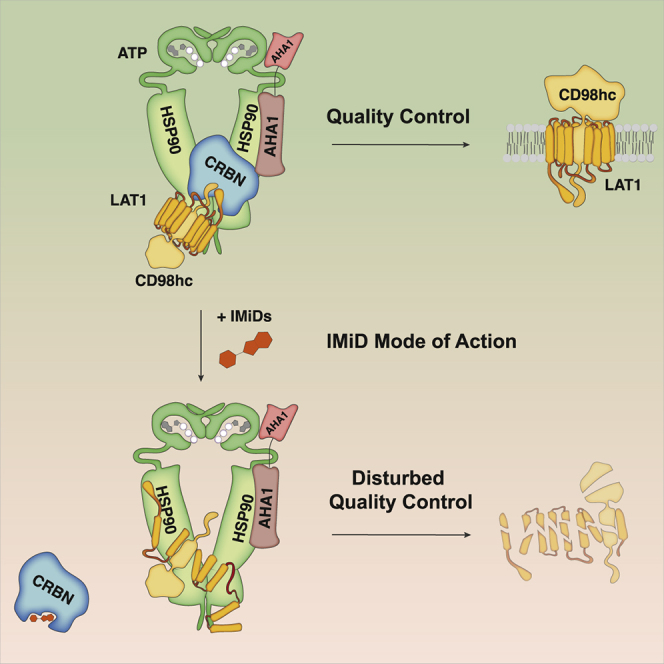
(F) Schematic representation of CRBNs function toward TP clients in the absence and presence of IMiDs.
We next investigated the impact of the CRBN-HSP90-AHA1 axis on CD98hc/LAT1, the top-scoring hit from our cell surface screen. First, we confirmed time- and dose-dependent destabilization of both proteins upon 17-AAG treatment (Figures S6A–S6C). Thereafter, we investigated the effects of HSP90 inhibition and IMiD treatment on the subcellular localization of CD98hc/LAT1. Both drugs impaired plasma membrane localization while leading to an accumulation at the ER and Golgi, comparable with the effects upon CRBN depletion and typical for misfolded proteins (Figures 1D, S1E, 4B, and S6D–S6G). In a further effort, we confirmed and mapped the binding of CRBN and HSP90 to the intracellular N-terminal domains of CD98hc and LAT1 (Figure S6H), studied maturation-dependent interaction by blocking de novo protein synthesis with cycloheximide (CHX) and found preferential binding of CRBN and HSP90 to newly synthesized CD98hc and LAT1 (Figures 4C and 4D).
Finally, we determined whether AHA1 has an impact on our novel HSP90 TP clients. Next to stabilization of CFTR, which is in line with previous findings (Wang et al., 2006), AHA1 silencing showed the same stabilizing effect toward CD98hc/LAT1 and CD147/MCT1 (Figure 4E). In further support of an important role of AHA1 on the stability of these TPs, a recent study detected CD98hc, LAT1, and MCT1 in an AHA1 interactome using a mass spectroscopy-based approach (Sun et al., 2015).
Together, the above data suggest a model in which CRBN is a TP-specific co-chaperone of HSP90, which assures proper client folding by counteracting AHA1. IMiDs abrogate binding of CRBN to both HSP90 and de novo synthesized TPs, resulting in increased AHA1 activity, insufficient client folding, and subsequent destabilization of TPs such as CD98hc and LAT1 (Figure 4F).
Loss of CD98hc/LAT1 quality control blocks MM cell proliferation and perturbs cellular amino acid metabolism
Next, we assessed the contribution of CD98hc/LAT1 destabilization to the versatile anti-myeloma effects of IMiDs. Indeed, RNAi-mediated knockdown of CD98hc and LAT1 markedly reduced proliferation of both IMiD-sensitive and IMiD-resistant MM cell lines (Figures 5A and S7A), while overexpression of CD98hc and LAT1 increased proliferation (Figures 5B and S7B). In contrast, lenalidomide destabilized CD98hc and LAT1 in IMiD-sensitive cell lines such as MM1S and U266, while their levels remained unaffected in naturally IMiD-resistant cell lines such as KMS12BM and RPMI8226 (Figure 5C). Moreover, cell surface expression of CD98hc, as measured by flow cytometry, was significantly reduced upon lenalidomide in sensitive but not in resistant cells (Figures 5D and 5E). Importantly, overexpression of CD98hc or LAT1 mitigated the anti-proliferative effect of IMiDs in MM1S cells, confirming that persistence of CD98hc and LAT1 associates with resistance to IMiD treatment (Figures 5F and S7C). These findings nominate CD98hc or LAT1 as attractive therapeutic targets in both the IMiD-sensitive and IMiD-resistant setting. Notably, JPH-203, a specific LAT1 inhibitor, is currently being tested for the treatment of various malignancies (Okano et al., 2018). In MM, we found JPH-203 to significantly reduce cell growth of both IMiD-sensitive and IMiD-resistant cell lines (Figure 5G). Likewise, the HSP90 inhibitor 17-AAG destabilized CD98hc/LAT1 and substantially reduced proliferation in IMiD-resistant cell lines (Figures 5H and S7D). The combination of 17-AAG and lenalidomide moreover showed synergistic anti-myeloma effects in MM1S cells (Figure S7E).
Figure 5.

Loss of CD98hc/LAT1 quality control blocks MM cell proliferation and perturbs cellular amino acid metabolism
(A) Cell proliferation analysis of the indicated MM cell lines, in which CD98hc or LAT1 were lentivirally silenced with the indicated shRNAs. The corresponding immunoblot analysis is presented in Figure S7A.
(B) Cell proliferation analysis of MM1S cells that were lentivirally infected with empty vector (EV) constructs or constructs to induce both CD98hc and LAT1 expression. The corresponding immunoblot analysis is presented in Figure S7B.
(C) Representative immunoblot analysis of lenalidomide-sensitive (MM1S, U266) and lenalidomide-resistant (KMS12BM, RPMI8226) MM cell lines treated with 10 μM lenalidomide or DMSO for 72 h.
(D) Representative flow cytometry analysis of endogenous CD98hc cell surface expression in a lenalidomide-sensitive (MM1S) and lenalidomide-resistant (KMS12BM) MM cell line treated with 10 μM lenalidomide or DMSO for 72 h.
(E) Quantification of three independent experiments presented in (D) using median fluorescence intensity (MFI). Data are shown as relative ratios of Len/DMSO control.
(F) Cell proliferation analysis of MM1s cells, which were lentivirally infected with empty vector (EV) constructs or constructs to induce CD98hc or LAT1 expression treated with DMSO or 10 μM lenalidomide for 72 h. The corresponding immunoblot analysis is presented in Figure S7C.
(G) Cell proliferation analysis of the indicated MM cell lines, which were treated with DMSO or 1 μM of the LAT1 inhibitor JPH-203 for the indicated times.
(H) Cell proliferation analysis of the indicated IMiD-resistant MM cell lines, which were treated with 1 μM 17-AAG or 10 μM lenalidomide for 72 h. The corresponding immunoblot analysis is presented in Figure S7D.
(H) Radioactive amino acid uptake analysis in MM1S cells, which were pulsed with 14C-labeled L-leucine. Cells were treated for 10 min with the LAT1 inhibitors BCH (1 M) and JPH-203 (1 μM) or 72 h with lenalidomide (10 μM) or DMSO prior to the analysis.
(I) Radioactive amino acid uptake analysis in MM1S cells performed as in (H). LAT1 was silenced using the indicated shRNAs. The corresponding immunoblot analysis is presented in Figure S7F.
Data in this figure are expressed as mean ± SD. ∗p < 0.05, ∗∗p < 0.01, and ∗∗∗p < 0.001 by one-sample t test or Student’s t test (B and F).
Extracellular supply of amino acids such as glutamine and leucine marks a strong dependency for MM cell growth (Bolzoni et al., 2016). The CD98hc/LAT1 complex is a sodium-independent exchanger of bulky aliphatic and aromatic amino acids, including the essential amino acid L-leucine (Yan et al., 2019), and is functionally linked to glutamine transport and amino acid-dependent mTOR activity, two further dependencies of MM (Eichner et al., 2019; Fernández-Sáiz et al., 2013; Nicklin et al., 2009). We therefore tested whether IMiDs influence the uptake of essential amino acids. Strikingly, lenalidomide treatment significantly reduced the uptake of 14C-labeled L-leucine in MM cells (Figure 5I), to a similar extent as RNAi-mediated depletion of LAT1 or specific inhibition using BCH and JPH-203 (Figures 5I, 5J, and S7F).
These data further distinguish CD98hc/LAT1 as an important vulnerability in MM, whose direct inhibition or IMiD-induced destabilization results in reduced proliferation and inhibition of essential amino acid uptake.
IMiDs exert anti-myeloma activity via destabilization of CD98hc and LAT1 in vivo and in primary patient samples
To assess the relevance of CD98hc/LAT1 destabilization in vivo, we extended our investigations to MM xenograft experiments. First, we injected human MM cells with silenced CD98hc and LAT1 expression subcutaneously into opposing flanks of NOD-SCID mice. In agreement with our in vitro data, depletion of CD98hc and LAT1 led to significantly reduced tumor growth as assessed by 18F-fluorodeoxyglucose positron emission tomography (18F-FDG-PET) (Figures 6A–6D). Reduced CD98hc and LAT1 levels were ascertained via immunohistochemistry (IHC) (Figure 6E). In addition to 18F-FDG-PET, mice also underwent 18F-fluoroethyltyrosine PET (18F-FET-PET) (Figure 6A, lower panel). 18F-FET is a radiolabeled amino acid analog predominantly transported by LAT1 (Habermeier et al., 2015). Notably, we observed a significantly lower 18F-FET-PET/18F-FDG-PET signal ratio in CD98hc/LAT1-depleted tumors, indicating reduced amino acid uptake (Figure 6F). In a second approach, unmodified IMiD-sensitive MM1S cells were injected subcutaneously, and mice were randomly assigned to receive lenalidomide or control treatment upon tumor engraftment. Lenalidomide treatment halted tumor progression and reduced CD98hc and LAT1 expression as shown by IHC analyses (Figures 6G, S7G, and S7H).
Figure 6.

IMiDs exert anti-myeloma activity via destabilization of CD98hc and LAT1 in vivo and in primary patient samples
(A) Representative positron emission tomography (PET) image using either 18F-fluorodeoxyglucose (FDG) (upper panel) or 18F-fluoroethyltyrosine (FET) (lower panel) of a representative NOD-SCID mouse that was injected subcutaneously with human MM1S cells that had been transduced with constructs expressing both CD98hc- and LAT1-specific shRNAs (1) or control shRNA (shCtrl) (2) before grafting. Images were taken 21 and 28 days after injection, with white arrows pointing to xenograft tumors. Color scale indicates percentage of injected dose per gram (% ID/g).
(B) Quantification of metabolic tumor volume as determined by FDG uptake (n = 4 tumors per condition).
(C and D) Metric quantification of tumors obtained after necropsy (n = 5 tumors per condition).
(E) Representative immunohistochemistry (IHC) analysis of tumors described in (A). Analysis was performed on ten high-power fields for each stain. Scale bars, 20 μm.
(F) Comparison of metabolic volumes obtained from 18F-FET-PET images versus 18F-FDG-PET images in mice described in (A).
(G) Representative immunohistochemistry (IHC) analysis of tumors derived from mice that were treated with either vehicle control or lenalidomide. Analysis was performed on ten high-power fields for each stain. Scale bars, 20 μm.
(H) Immunoblot analysis of primary CD138+ cells obtained from patients diagnosed with lenalidomide-sensitive (Len. sens.) or lenalidomide-resistant (Len. res.) MM that were cultured in vitro with DMSO or 10 μM lenalidomide for 48 h.
(I) Flow cytometry analysis of endogenous CD98hc cell surface expression of primary CD138+ cells that were treated as in (H). Data are presented as relative ratios (Len/DMSO) of median fluorescence intensity (MFI).
Data in this figure are expressed as mean ± SD. n.s., not significant; ∗p < 0.05 and ∗∗p < 0.01 by Student’s t test (B–D and F) and one-sample t test (I).
Finally, CD138+ MM cells were isolated from bone marrow aspirates from either lenalidomide-sensitive or resistant patients and treated with lenalidomide in vitro. In line with our observation in MM cell lines, we found decreased CD98hc/LAT1 levels and CD98hc cell surface expression in cells obtained from IMiD-sensitive patients, while no change was noted in patients with documented lenalidomide resistance (Figures 6H, 6I; and S7I). The close correlation of CD98hc/LAT1 destabilization with IMiD sensitivity implies that IMiD-induced change of CD98hc/LAT1 levels could serve as a predictive marker for IMiD response.
A CD98hc-directed Anticalin (D11vs) provides a radio-theranostic tool for MM
Anticalins constitute a clinical stage class of non-immunoglobulin-binding proteins, derived from human lipocalins, that provide functional benefits such as small size, robust and compact fold, and pronounced target specificity (Rothe and Skerra, 2018). Recently, we developed an Anticalin on the basis of the human lipocalin Lcn2, which specifically binds and detects the human CD98hc ectodomain with picomolar affinity (Deuschle et al., 2020). Indeed, when used in our MM model, a PASylated variant (Schlapschy et al., 2013) of this Anticalin (Anticalin-PAS200) coupled to the fluorophore sulfoCy5.5 (sCy5.5) specifically stained CD98hc on human MM1S cells (Figures 7A–7F). Specificity was further established using the corresponding PASylated wild-type Lcn2 (wtLcn2-PAS200) and by blocking with an excess of unlabeled Anticalin-PAS200 (Figure 7G). Importantly, Anticalin-PAS200 was able to detect IMiD-induced destabilization of CD98hc in MM1S cells and also in primary CD138+ MM cells, which were treated with lenalidomide in vitro (Figures 7H and 7I). For application in vivo, the Anticalin-PAS200 was site-specifically conjugated with deferoxamine and labeled with zirconium-89, and MM1S cells were subcutaneously injected into NOD SCID mice. Following tumor engraftment, mice were injected with Anticalin-PAS200-89Zr and imaged using PET/CT. Although specific accumulation of the radio ligand was detectable in the xenograft tumor (Figure 7J), additional intravenous (i.v.) application of an excess amount of the unlabeled Anticalin-PAS200 blocked this accumulation (Figure 7K), thus ascertaining specificity (Figures 7J–7L).
Figure 7.

A CD98hc-directed Anticalin (D11vs) provides a radio-theranostic tool for MM
(A) Flow cytometry analysis of CD98hc cell surface expression using Anticalin-PAS200-sCy5.5 with MM1S cells that were lentivirally transduced with a control construct (empty vector [EV]) or constructs overexpressing CD98hc and/or LAT1.
(B) Flow cytometry analysis of cells shown in (A) using a commercial anti-CD98hc-mAb-APC.
(C) Immunoblot analysis of cells shown in (A).
(D) Flow cytometry analysis of CD98hc cell surface expression using Anticalin-PAS200-sCy5.5 with MM1S cells in which CD98hc was lentivirally silenced with the indicated shRNAs.
(E) Flow cytometry analysis of cells shown in (D) using a commercial anti-CD98hc-mAb-APC.
(F) Immunoblot analysis of cells shown in (D).
(G) Specificity assay using flow cytometry analysis of CD98hc cell surface expression of MM1S cells using sCy5.5 labeled wild-type Lipocalin (wtLcn2) or Anticalin-PAS200-sCy5.5 with or without an excess of unlabeled Anticalin-PAS200 for target blockade.
(H) Flow cytometry analysis using Anticalin-PAS200-sCy5.5 of CD98hc cell surface expression on MM1S cells treated with 10 μM lenalidomide or DMSO for 72 h using Anticalin-PAS200-sCy5.5.
(I) Flow cytometry analysis (Anticalin-PAS200-sCy5.5 staining) of endogenous CD98hc cell surface expression of primary CD138+ cells obtained from patients with lenalidomide-sensitive (Len. sens.) or lenalidomide-resistant (Len. res.) disease which were cultured in vitro with 10 μM lenalidomide or DMSO for 48 h.
(J) 89Zirconium immuno-PET/CT of mice bearing a MM1S xenograft tumor with the radio ligand Anticalin-PAS200-89Zr. Mice were injected with 5.0 ± 0.4 MBq of the radiopharmaceutical, and PET/CT images were recorded 24 h post-injection (p.i.) (n = 4). Maximum intensity projection, transversal, and coronal sections are depicted; tumor highlighted by an arrowhead and joint accumulation of the 89Zr radiometal indicated by asterisks.
(K) In a control cohort, the specific binding of Anticalin-PAS200-89Zr was blocked by a 1,000-fold excess of non-radioactive Anticalin-PAS200 (n = 4).
(L) Biodistribution of tumors from mice specified in (J) and (K) sacrificed after PET/CT imaging, expressed as percentage injected dose per gram (%ID/g). p = 0.11 by Student’s t test.
Data in this figure are expressed as mean ± SD. ∗p < 0.05, ∗∗p < 0.01, and ∗∗∗p < 0.001 by Student’s t test (G) and one-sample t test (A, B, D, E, H, and I).
Taken together, these findings provide a novel CD98hc-specific theranostic tool for further research and potential clinical application in MM.
Discussion
The protein CRBN has received particular attention as the primary target of IMiDs (Fischer et al., 2014; Ito et al., 2010), which have been shown to induce the interaction between CRBN and a set of neo-substrates including IKZF1, IKZF3, and CK1α, resulting in their ubiquitination and the subsequent proteasomal degradation (Gandhi et al., 2014; Krönke et al., 2014, 2015; Lu et al., 2014). Although the ubiquitin-dependent degradation of neo-substrates accounts for some of the known IMiDs effects, many open questions remained because they do not explain the plethora of IMiD functions such as the anti-angiogenic, anti-invasive, and also immune-modulatory effects. Most important, however, the well-documented synergy of IMiDs with the reversible and irreversible proteasome inhibitors bortezomib and carfilzomib creates a paradox, as they would be predicted to antagonize each other. Instead, this synergy suggests the presence of ubiquitin-independent mechanisms of IMiD action (Attal et al., 2017; Stewart et al., 2015). Indeed, we previously found CRBN to bind and stabilize the TPs CD147 and MCT1 in a ubiquitin-independent manner and demonstrated that IMiDs mediate anti-tumor and teratotoxic effects by interfering with this complex (Eichner et al., 2016).
This initial observation proved to be an invaluable portal to gain insight into the physiological functions of CRBN and eventually distinguish CRBN as a fundamental player in the quality control of TPs, which is further supported by previous findings that CRBN binds chloride and potassium channels (Higgins et al., 2008; Hohberger and Enz, 2009; Jo et al., 2005). Indeed, we here characterize CRBN as an HSP90 co-chaperone that interacts with the ATP-bound and N-terminally closed HSP90α dimer and attenuates the negative effect of AHA1 on TP stability. These findings provide different new aspects of how HSP90 function and TP quality control are regulated. By investigating a panel of TPs and non-TP HSP90 client proteins, we show that IMiD treatment or CRBN loss specifically destabilize TPs, whereas non-TP HSP90 clients remain unaffected, thus distinguishing CRBN as TP-specific HSP90 co-chaperone (Figures 4A and S5A). So far, CDC37 is the only other co-chaperone that has been demonstrated to provide HSP90 specificity to a distinct protein family, namely, kinases (Schopf et al., 2017; Verba et al., 2016). Selectivity via distinct co-chaperones may thus be a more general theme by which HSP90 clients are determined.
Our data also provide a new level of regulation of AHA1. Faithful processing of individual HSP90 clients depends on the client HSP90 dwelling time, which is determined by AHA1’s stimulation of ATP turnover (Koulov et al., 2010). CRBN reduces HSP90 ATP turnover via attenuation of AHA1, an effect that is reversed by lenalidomide. We therefore propose that the ratio of CRBN and AHA1 within the HSP90 complex tightly regulates HSP90 ATPase activity to provide an ideal dwelling time for TP maturation and energetically stable folding. IMiDs disturb this balance by disrupting the CRBN-HSP90 interaction, leading to an imbalance in favor of AHA1. As a consequence, exceedingly rapid ATP turnover reduces the chaperone client dwelling time and results in poorly folded TP intermediates.
The broad impact of CRBN on TP quality control opens a new perspective on IMiD function, which may eventually account for the broad plethora of their clinical effects. Indeed, the anti-angiogenic, anti-invasive, anti-proliferative, and immune-modulatory but also the teratotoxic effects as well as the width of side effects such as thrombosis or neuropathy could be explained by altered TP expression. We acknowledge that a full picture of all relevant TPs affected by IMiDs goes beyond the insights provided herein. In this regard, a recent paper reported that IMiD resistance in isogenic MM cell line pairs could not be overcome by the sole silencing of CD147 (Zhu et al., 2019). This finding appears conceivable in light of the fundamental impact of CRBN on different TPs.
Among the TPs affected by IMiDs, we here focused on the amino acid transporter complex CD98hc/LAT1, which is highly expressed in MM and scored as the most significant overlapping hit between cell surface proteome and CRBN interactome analyses. This candidate makes sense in many ways, particularly in the context of MM. Upregulation of amino acid transporters is particularly relevant for MM cells, in which the production of large amounts of monoclonal immunoglobulins is a characteristic hallmark of the disease, necessitating enormous amounts of amino acids. This particular dependency may thus explain why IMiDs exert their highest efficacy in this disease. The impact of IMiDs on amino acid uptake is well documented by our in vitro uptake assays (Figures 5I and 5J) and in vivo experiments using FET-PET (Figures 6A and 6F). Moreover, amino acid deprivation and proteasomal inhibition both reduce the pool of amino acids available for synthesis of proteins and may thus serve as a mechanistic rationale of why IMiDs and PIs act highly synergistically in MM. Along this line, the IMiD-induced accumulation of misfolded TPs would also be considered synergistic with proteasomal inhibition in terms of anti-myeloma efficacy.
Different therapeutic implications can be derived from the insights described herein. So far, HSP90 inhibitors have failed in clinical application because of toxicity, which can be well explained by the large number of HSP90 clients. Therefore, a more selective targeting of HSP90-co-chaperone complexes would be desirable. IMiDs could represent such molecules as they disrupt the CRBN-HSP90α interplay to destabilize a limited number of TPs. At the same time, specific targeting of the CRBN-AHA1 interaction could be a complementary approach (Stiegler et al., 2017). Actionable therapeutic implications can also be deduced from the identification of CD98hc/LAT1 as novel IMiD targets and meaningful vulnerabilities in MM. We show that refractoriness to IMiD treatment consistently associates with the persistence of CD98hc/LAT1expression in MM cells, while knockdown of CD98hc/LAT1 in such cells induces their death. Targeting CD98hc/LAT1 thus appears to be a highly attractive therapeutic approach in IMiD-refractory patients or patients with cancers, where CD98hc/LAT overexpression has been observed. Indeed, treatment of IMiD-resistant MM cells with JPH-203, a specific LAT1 inhibitor, reduced cell proliferation to a similar extent as in IMiD-sensitive cells (Figure 5G), thus warranting further development of such agents. At the same time, early analysis of CD98hc/LAT1 expression may serve as a biomarker to predict IMiD sensitivity in MM patients.
Finally, we show that a CD98hc-directed Anticalin is highly enriched in xenogeneic MM tumors when linked to the diagnostic isotope 89Zr and imaged using PET. This tool can be further therapeutically exploited in the context of a radio-theranostic approach when linked to a therapeutic isotope such as 177Lu. This additional therapy option for IMiD-refractory patients appears promising, as they exhibit persistent high expression of the target and are highly sensitive to ionizing radiation (Mesguich et al., 2016). Future studies will elucidate whether such an approach represents a successful treatment modality in patients with relapsed/refractory MM and high expression of CD98hc.
Limitations
Our data provide clear evidence for a highly specific co-chaperone function of CRBN toward TPs. However, our study did not reveal a distinct recognition motif or binding site specificity in TPs by which selective binding to CRBN is procured. Such insights may be revealed by structural studies of CRBN bound to TPs such as CD98hc and LAT in the presence and absence of IMiDs. These additional mechanistic details will be subject of further investigations. The present findings also open the field of inhibiting protein family-specific fractions of HSP90 activity, as broad inhibition of HSP90 by currently available inhibitors have failed in most clinical applications because of significant toxicity. The present study focuses on IMiDs as subset-specific HSP90 modulators, but future strategies could include inhibitors of other HSP90-co-chaperone interactions, other client-specific inhibitors, and modulators of subcellular localization.
STAR★methods
Key resources table
| REAGENT or RESOURCE | SOURCE | IDENTIFIER | |
|---|---|---|---|
| Antibodies | |||
| Mouse monoclonal anti-CULLIN1-2H4C9 | Invitrogen | Cat.#: 32-2400 RRID: AB_2533070 |
|
| Mouse monoclonal anti-FLAG-M2 | Sigma | Cat.#: F3165 RRID:AB_259529 |
|
| Mouse monoclonal anti-β-actin | Sigma | Cat.#: A-1978 RRID:AB_476692 |
|
| Mouse monoclonal anti-p23 | Enzo Life Sciences | Cat.#: ADI-SPA-670D RRID:AB_2039433 |
|
| Mouse monoclonal anti-HOP | Enzo Life Sciences | Cat.#: ADI-SRA-1500D RRID:AB_2039198 |
|
| Mouse monoclonal anti-HSP90β | Enzo Life Sciences | Cat.#: ADI-SPA-843-D RRID:AB_2039291 |
|
| Mouse monoclonal anti-HA-16B12 | Covance | Cat.#: MMS-101P RRID:AB_2314672 |
|
| Mouse monoclonal anti-HA-16B12 | Biolegend | Cat.#: 901501 RRID:AB_2565006 |
|
| Mouse monoclonal anti-CD147 8D6 | Santa Cruz Biotechnology | Cat.#: sc-21746 RRID:AB_626911 |
|
| Mouse monoclonal anti-CD98hc | Santa Cruz Biotechnology | Cat.#: sc-376815 RRID: N/A |
|
| Mouse monoclonal anti-NHE1 | Santa Cruz Biotechnology | Cat.#: sc-136239 | |
| Mouse monoclonal anti-ENT1 | Santa Cruz Biotechnology | Cat.#: sc-377283 | |
| Mouse monoclonal anti-CD44 | Santa Cruz Biotechnology | Cat.#: sc-7297 | |
| Mouse monoclonal anti-CFTR M3A7 | Merck Millipore | Cat.#: 05-583 RRID:AB_309819 |
|
| Mouse monoclonal anti-CHK1 | Cell Signaling Technology | Cat.#: 2360S RRID:AB_2080320 |
|
| Rabbit polyclonal anti-MCT1 | Merck Millipore | Cat.#: AB-3538P RRID:AB_11210679 |
|
| Rabbit polyclonal anti-FLAG | Sigma | Cat.#: F7425 RRID:AB_439687 |
|
| Rabbit polyclonal anti-IKZF1 | Cell Signaling Technology | Cat.#: 5443 RRID:AB_10691693 |
|
| Rabbit polyclonal anti-IKZF3 | Cell Signaling Technology | Cat.#: 12720 RRID: N/A |
|
| Rabbit polyclonal anti-HSP90 | Cell Signaling Technology | Cat.#: 4877S RRID:AB_2233307 |
|
| Rabbit polyclonal anti-LAT1 | Cell Signaling Technology | Cat.#: 5347S RRID:AB_10695104 |
|
| Rabbit polyclonal anti-GR | Cell Signaling Technology | Cat.#: 12041T RRID:AB_2631286 |
|
| Rabbit polyclonal anti-CHIP | Cell Signaling Technology | Cat.#: 2080S RRID:AB_2198052 |
|
| Rabbit polyclonal anti-p53 | Cell Signaling Technology | Cat.#: 9282 RRID:AB_331476 |
|
| Rabbit monoclonal anti-BCL6 | Cell Signaling Technology | Cat.#: 5650S RRID:AB_10949970 |
|
| Rabbit monoclonal anti-GLUT1 | Cell Signaling Technology | Cat.#: 12939S | |
| Rabbit monoclonal anti-ASCT2 | Cell Signaling Technology | Cat.#: 8057S | |
| Rabbit polyclonal anti-AHA1 | Abcam | Cat.#: ab83036 RRID:AB_2223967 |
|
| Rabbit polyclonal anti-HA Y-11 | Santa Cruz Biotechnology | Cat.#: sc-805 RRID:AB_631618 |
|
| Rabbit polyclonal anti-MCT4 | Santa Cruz Biotechnology | Cat.#: sc-50329 RRID:AB_2189333 |
|
| Rabbit monoclonal anti-SLC7A5/LAT1 | Abcam | Cat.#: ab208776 RRID: N/A |
|
| Rabbit polyclonal anti-CD38 | Abcam | Cat.#: ab125038 RRID:AB_10976505 |
|
| Rabbit polyclonal anti-TEL2 | Proteintech | Cat.#: 15975-1-AP RRID:AB_2203337 |
|
| Rabbit polyclonal anti-HAX1 | Proteintech | Cat.#: 11266-1-AP RRID:AB_2263720 |
|
| Rabbit polyclonal anti-WT1 | Proteintech | Cat.#: 12609-1-AP RRID:AB_2216225 |
|
| Rabbit polyclonal anti-CUL4B | Proteintech | Cat.#: 12916-1-AP RRID:AB_2086699 |
|
| Rabbit polyclonal anti-CUL4A | Bethyl Laboratories | Cat.#: A300-739A RRID:AB_533380 |
|
| Rabbit polyclonal anti-RAPTOR | Bethyl Laboratories | Cat.#: A300-553A RRID:AB_2130793 |
|
| Rabbit polyclonal anti-HSP90α | Enzo Life Sciences | Cat.#: ADI-SPS-771F RRID:AB_1534201 |
|
| Rabbit polyclonal anti-FBXO9 | In house made polyclonal rabbit antibody | N/A | |
| Individually generated Rabbit polyclonal anti-CRBN | Innovagen | N/A | |
| Anti-rabbit IgG-HRP | GE Healthcare | Cat.#: NA934-1ML RRID:AB_772206 |
|
| Anti-mouse IgG-HRP | GE Healthcare | Cat.#: NA931-1ML RRID:AB_772210 |
|
| Protein-A-HRP | GE Healthcare | Cat.#: NA9120V RRID: N/A |
|
| Anti-goat IgG-HRP | Santa Cruz Biotechnology | Cat.#: sc-2354 RRID:AB_628490 |
|
| Anti-rabbit IgG-Alexa Fluor 488 (IF) | Invitrogen | Cat.#: A11008 RRID:AB_143165 |
|
| Anti-mouse IgG-Alexa Fluor 594 (IF) | Invitrogen | Cat.#: A11005 RRID:AB_2534073 |
|
| Anti-sheep IgG-Alexa Fluor 633 (IF) | Invitrogen | Cat.#: A21100 | |
| Alexa Fluor-546-conjugated Streptavidin (IF) | Invitrogen | Cat.#: S11225 | |
| Sheep polyclonal Anti-TGN46 (IF) | BioRad | Cat.#: AHP500GT | |
| Mouse monoclonal Biotin-conjugated anti-Calnexin AF18 (IF) | Novus Biologicals | Cat.#: NB300-518B | |
| Anti-CD98hc-PE, clone UM7F8 (FACS) | BD PharMingen | Cat.#: 556077 RRID:AB_396344 |
|
| Anti-Isotype control mIgG1k- PE, clone MOPC-21 (FACS) | BD PharMingen | Cat.#: 559320 RRID:AB_397218 |
|
| Anti-CD98hc-APC (FACS) | Miltenyi | Cat.#: 130-105-662 RRID:AB_2659685 |
|
| Anti-Isotype control REA Control APC (FACS) | Miltenyi | Cat.#: 130-104-615 RRID:AB_2661679 |
|
| Anti-CD138-biotin (FACS) | Miltenyi | Cat.#: 130-099-162 RRID:AB_2655045 |
|
| Anti-CD38-biotin (FACS) | Miltenyi | Cat.#: 130-092-288 RRID:AB_871667 |
|
| Streptavidin- eFluor450 (FACS) | eBioscience | Cat.#: 48431782 RRID:AB_10359737 |
|
| APC Annexin V (FACS) | BD PharMingen | Cat.#: 550474 RRID: N/A |
|
| Bacterial and virus strains | |||
| E. Coli BL21 | NEB | Cat.#: C2530H | |
| Biological samples | |||
| Mononuclear cells from bone marrow aspirates from lenalidomide-sensitive and –refractory MM patients | Isolated from patients | N/A | |
| Chemicals, peptides, and recombinant proteins | |||
| Lenalidomide | Sigma | Cat.#: SML2283 | |
| Pomalidomide | Selleckchem | Cat.#: S1567 | |
| Thalidomide | Tocris | Cat.#: 0652 | |
| BCH | Sigma | Cat.#: A7902 | |
| JPH-203 | Tocris | Cat.#: 5026 | |
| 17-aag | Selleckchem | Cat.#: S1141 | |
| Geldanamycin | AdooQ Bioscience | Cat.#: A11025 | |
| Ganetespib | AdooQ Bioscience | Cat.#: A11402 | |
| HSP990 | AdooQ Bioscience | Cat.#: A12850 | |
| SNX-2112 | AdooQ Bioscience | Cat.#: A11189 | |
| PU-H71 | AdooQ Bioscience | Cat.#: A11130 | |
| Biocoll Separating Solution | Biochrom | Cat.#: L 6115 | |
| CD138+ micro beads | MACS, MiltenyiBiotech |
Cat.#: 130-051-301 | |
| Sodium molybdate | Sigma | Cat.#: 331058-M | |
| FLAG-M2 agarose beads | Sigma | Cat.#: A2220 | |
| HA-7 agarose beads | Sigma | Cat.#: A2095 | |
| Lipofectamine 2000 | Thermo Fischer | Cat.#: 11668019 | |
| ViaFect transfection reagent | Promega | Cat.#: E4981 | |
| Polybrene | Sigma | Cat.#: TR-1003 | |
| Isopropyl-β-D-thiogalactopyranoside (IPTG) | Sigma | Cat.#: I6758 | |
| Glutathione Sepharose 4B beads | Amersham Biosciences | Cat.#: 17075601 | |
| rProtein A Sepharose Fast Flow | Merck/GE Healthcare | Cat.#: 17-1279-01 | |
| Gold Antifade Mountant | Invitrogen | Cat.#: P36930 | |
| 14C-L-Leucine | Moravek Inc. | Cat.#: MC175 | |
| Ultima Gold XR scintillation cocktail | Perkin Elmer | Cat.#: 6013119 | |
| Strep-Tactin Superflow Sepharose | IBA Lifesciences | Cat.#: 2-1208-002 | |
| Amicon Ultra-0.5 mL 10k Centrifugal Filters | Merck Millipore | Cat.#: UFC501008 | |
| Critical commercial assays | |||
| TNT T7 quick-coupled transcription/translation system | Promega | Cat.#: L1171 | |
| Molecular Probes PiPer Phosphat-Assay-Kit | Thermo Fisher | Cat.#: P22061 | |
| RNeasy Kit | QIAGEN | Cat.#: 74104 | |
| Deposited data | |||
| Mass spectrometric data | PRIDE database | PXD018244 | |
| Experimental models: cell lines | |||
| HEK293T | ATCC | Cat.#: CRL-3216 RRID:CVCL_0063 |
|
| CRBN−/− HEK293FT | Laboratory of WG Kaelin | N/A | |
| HeLa | ATCC | Cat.#: CCL-2 RRID:CVCL_0030 |
|
| Human: MM1.S | ATCC | Cat#CRL-2974 RRID:CVCL_8792 |
|
| Human: MM1.S CRBN−/− clones T11 and T21 | Laboratory of WG Kaelin | N/A | |
| Human: U266B1 | DSMZ | Cat.#: ACC-9 RRID:CVCL_0566 |
|
| Human: KMS 12BM | DSMZ | Cat.#: ACC-551 RRID:CVCL_1334 |
|
| Human: RPMI 8226 | DSMZ | Cat.#: ACC-402 RRID:CVCL_0014 |
|
| Human: JJN3 | DSMZ | Cat.#: ACC-541 RRID:CVCL_2078 |
|
| Experimental models: organisms/strains | |||
| Mice: NOD.CB17/AlhnRj-Prkdcscid/Rj | Janvier/Charles River | N/A | |
| Oligonucleotides | |||
| shRNA CRBN: (#1) 5′-CGCTGGCTGTATTCCTTATAT-3′ and (#2) 5′- CCAGAAACATCTACTTGGGTA −3′ | Krönke et al., 2014 | N/A | |
| shRNA CD98hc (#1) 5′- AGTCTCTTGCAATCGGCTAAA −3′ and (#2) 5′- GCCTACTCGAATCCAACAAAG −3′ | This paper | N/A | |
| shRNA LAT1 (#1) 5′- CTAGATCCCAACTTCTCATTT −3′ and (#2) 5′- GAACATTGTGCTGGCATTATA −3′ | This paper | N/A | |
| shRNA AHA1 (#1) 5′- CAATCGCAAAGGGAAACTTAT −3′ and (#2) TACTACTTTGAGGGCATTAAA −3′, | This paper | N/A | |
| CTRL / sh_scramble: 5′-CCTAAGGTTAAGTCGCCCTCG −3′. |
This paper | N/A | |
| mRNA primer: LAT1: 5′- GAAGAGGCGCGGGAGAAG AT-3′ and and 5′- GTTGAGCAGCGTGATGTT CC-3′ | This paper | N/A | |
| mRNA primer: CD98hc: 5′- ATGGAGCTACAGCCTCC TGA-3′ and 5′- CGCGCTGAGACCCTGG −3′ |
This paper | N/A | |
| mRNA primer: ARPP: 5′-GCACTGGAAGTCCAACTA CTTC-3′ and 5′-TGAGGTCCTCCTTGGTGAACAC-3′. |
This paper | N/A | |
| Recombinant DNA | |||
| pcDNA Human CRBN | Source Bioscience | N/A | |
| pcDNA CD98hc | Source Bioscience | N/A | |
| pcDNA LAT1 | Source Bioscience | N/A | |
| pcDNA HSP90A/B | Source Bioscience | N/A | |
| pcDNA AHA1 | Source Bioscience | N/A | |
| pcDNA ASCT2 | Source Bioscience | N/A | |
| pcDNA CFTR | Raymond A. Frizzell | N/A | |
| pcDNA HA | Life technologies | N/A | |
| pcDNA Flag | Life technologies | N/A | |
| pHIV-EGFP | Addgene | Cat.#: 21373 RRID:Addgene_21373 |
|
| pLKO.1 TRC | Addgene | Cat.#: 10878 RRID:Addgene_10878 |
|
| Scramble shRNA | Addgene | Cat.#: 1864 RRID:Addgene 1864 |
|
| pMD2.G | Addgene | Cat.#: 12259 RRID:Addgene_12259 |
|
| psPAX2 | Addgene | Cat.#: 12260 RRID:Addgene_12260 |
|
| pDONR221 GLUT1 | Addgene | Cat.#: 132103 RRID:Addgene_132103 |
|
| pDONR221 NHE1 | Addgene | Cat.#: 132246 RRID:Addgene_132246 |
|
| pDONR221 MCT4 | Addgene | Cat.#: 131899 RRID:Addgene_131899 |
|
| pcDNA3-HA2 CaUL4A | Addgene | Cat.#: 19907 RRID:Addgene_19907 |
|
| pcDNA3-Flag DDB1 | Addgene | Cat.#: 19918 RRID:Addgene_19918 |
|
| pcDNA3-FBXL6-Flag | Addgene | Cat.#: 19904 RRID:Addgene_19904 |
|
| pLPC-MYC hTel2 | Addgene | Cat.#: 22802 RRID:Addgene_22802 |
|
| pcDNA3.1/C-(K)DYK WT1 | GenScript | Cat.#: OHu27351 | |
| pGEX-4T2 | GE Healthcare | 28-9545-50 | |
| pcDNA3-HA HAX1 | J. Ihle (St. Jude Children’s Research Hospital)/Baumann et al., 2014 | N/A | |
| Software and algorithms | |||
| Quantity One software | Biorad |
http://www.bio-rad.com/de-de/product/quantity-one-1-d-analysis-software?ID=1de9eb3a-1eb5-4edb-82d2-68b91bf360fb RRID:SCR_014280 |
|
| FlowJo software | FlowJo |
https://www.flowjo.com/solutions/flowjo/downloads RRID:SCR_008520 |
|
| GraphPad Prism | GraphPad Software | https://www.graphpad.com/RRID:SCR_003070 | |
| ImageJ | ImageJ |
https://imagej.net/Downloads RRID:SCR_003070 |
|
| MaxQuant (v1.6.0.16) | MaxQuant | https://www.maxquant.org | |
| Inveon Research Workplace software | Siemens medical solutions | N/A | |
| Data availability | |||
| Proteomics raw data | PRIDE server | https://www.ebi.ac.uk/pride/archive/Accession number: PXD018244 | |
Resource availability
Lead contact
Further information and requests for resources and reagents should be directed to and will be fulfilled by the Lead Contact, Florian Bassermann (florian.bassermann@tum.de).
Materials availability
Plasmids and antibodies generated within this study can be provided upon request.
Data and code availability
The mass spectrometry proteomics raw data (cell surface proteome screen and CRBN interactome) have been deposited on the PRIDE server (https://www.ebi.ac.uk/pride/archive/) with the following accession number: PXD018244.
Experimental model and subject details
Cell lines and drug treatments
HEK293T (ATCC: CRL-3216), CRBN−/− HEK293FT (kindly provided by WG Kaelin) and HeLa (ATCC: CCL-2) cells were grown in Dulbecco’s modified Eagle’s medium (DMEM; GIBCO) supplemented with 10% fetal bovine serum (FBS) and 1% penicillin-streptomycin. The human multiple myeloma cell lines MM1.S (ATCC: CRL-2974), MM1.S CRBN−/− (independent clones T11 and T21; both kind gifts of WG Kaelin), U266 (DSMZ: ACC-9), KMS 12BM (DSMZ: ACC-551), RPMI 8226 (DSMZ: ACC-402), JJN3 (DSMZ: ACC-541) were cultured in RPMI-1640 (GIBCO) with 10% heat-inactivated FBS and 1% penicillin-streptomycin. All cells tested mycoplasma negative by a PCR detection method.
Primary multiple myeloma cells
The study of MM cells derived from patients treated in our hospital was in accordance with the ethical standards of the institutional and national research committee and with the 1964 Helsinki Declaration and its later amendments or comparable ethical standards. The investigation was approved by the Local Ethics Committee of our University Hospital (ethical approval # 438/19 S). Written informed consent was obtained from each patient.
Studies in mice
For CD98hc/LAT1 knockdown studies, female NOD.CB17/AlhnRj-Prkdcscid/Rj mice 8–10 weeks of age (Janvier) were used. For Anticalin xenograft experiments female NOD SCID mice 8-10 weeks of age (Charles River) were used. Mice were housed under SPF condition and animal experiments were conducted with permission from the District Government of Upper Bavaria (application no.: 55.2-2532.Vet_02-16-141 / 55.2-1-54-2532-216-15).
Method details
Cell culture drug treatment
Where indicated, lenalidomide (Sigma), pomalidomide (Selleckchem), thalidomide (Tocris), BCH (Sigma), JPH-203 (Tocris), 17-AAG (Selleckchem), Geldanamycin, Ganetespib, HSP990, SNX-4112, PU-H71 (all AdooQ Bioscience) were used at the indicated concentrations.
Isolation of CD138+ primary MM cells
Mononuclear cells from bone marrow aspirates from lenalidomide-sensitive and –refractory MM patients were isolated using Biocoll Separating Solution (Biochrom) and enriched for CD138+ cells by magnetic bead selection (MACS, MiltenyiBiotech) according to the manufacturer’s instructions. CD138+ cells were taken into culture in IMDM (GIBCO) with 20% heat-inactivated FBS and 1% penicillin-streptomycin for 48 hours in presence of 10μM lenalidomide or vehicle (DMSO) and subsequently analyzed by flow cytometry, and, where possible, harvested for immunoblot analysis.
Plasmids and shRNAs
Human CRBN, CD98hc, LAT1, ASCT2, HSP90⍺, HSP90B, AHA1 cDNA was purchased from Source Bioscience. Human GLUT1, NHE1, MCT4, CUL4A, DDB1, FBXL6, TEL2 cDNA was purchased from Addgene. Human WT1 cDNA was purchased from GenScript. A human HAX1 construct was kindly provided by J. Ihle. A human CFTR construct was kindly provided by Raymond A. Frizzell. Point mutants of CRBN, HSP90⍺ and AHA1 were generated using site-directed mutagenesis. cDNAs of CRBN CD98hc, LAT1, HSP90⍺, HSP90B, AHA1, CFTR were cloned without tag or with HA- or FLAG-tag into the expression plasmid pcDNA3.1 (Life technologies). FLAG-tagged fragments of CRBN (Sequences specified in Figure S3E) were subcloned into the expression plasmid pcDNA3.1 (Life technologies). cDNAs of CD98hc and LAT1 were cloned into the pHIV-EGFP plasmid (Addgene) or a pHIV-EGFP variant where the EGFP sequence was replaced by the cDNA coding for DsRed-Express2. Full-length CRBN and fragments of CD98hc (isoform 1 AA 1-184, isoform 3 AA 1-122), LAT1 (N-terminal AA 1-49, middle AA 340-395, C-terminal AA 479-507) and HSP90 (N-terminal AA 9-236, middle AA 272-617, C-terminal AA 626-732) were cloned into the pGEX-4T2 expression vector. All cDNAs were sequenced. For shRNA mediated silencing of CRBN, CD98hc, LAT1, AHA1, specific shRNAs were cloned into the pLKO.1 TRC plasmid (Addgene), where the puromycin resistance cassette was replaced by the cDNA coding for DsRed-Express2. sh_scramble (Addgene) was used as control. The shRNA target sequences for CRBN were: (#1) 5′-CGCTGGCTGTATTCCTTATAT-3′ and (#2) 5′- CCAGAAACATCTACTTGGGTA −3′ (derived from (Krönke et al., 2014)), for CD98hc were (#1) 5′- AGTCTCTTGCAATCGGCTAAA −3′ and (#2) 5′- GCCTACTCGAATCCAACAAAG −3′, for LAT1 were (#1) 5′- CTAGATCCCAACTTCTCATTT −3′ and (#2) 5′- GAACATTGTGCTGGCATTATA −3′, for AHA1 were (#1) 5′- CAATCGCAAAGGGAAACTTAT −3′ and (#2) TACTACTTTGAGGGCATTAAA −3′, for CTRL / sh_scramble were: 5′- CCTAAGGTTAAGTCGCCCTCG −3′.
Antibodies, cell lysis, immunoprecipitations and immunoblotting
Antibodies
Mouse monoclonal antibodies were purchased from Invitrogen (CUL1-2H4C9: #32-2400), Sigma (FLAG-M2: #F3165, β-actin: #A-1978), Enzo (p23: ADI-SPA-670D, HOP: ADI-SRA-1500D, HSP90β: #ADI-SPA843-D), Covance (HA-16B12: #MMS-101P), Cell Signaling (CHK1: 2360S) and Santa Cruz (CD147 8D6: #sc-21746, CD98hc: sc-376815, NHE1: #sc-136239, ENT1: sc-377283, CD44: sc-7297). Rabbit polyclonal antibodies were from Millipore (MCT1: #AB-3538P, CFTR: M3A7#), Sigma (FLAG: #F7425), Cell Signaling (IKZF1: #5443, IKZF3: #12720, HSP90: #4877S, LAT1: #5347S, GR: #12041T, CHIP: #2080S, BCL6: #5650S, GLUT1: #12939S, ASCT2: #8057S,), Abcam (AHA1 ab83036), Bethyl Laboratories (CUL4A: # A300-739A, RAPTOR: #A300-553A), Enzo (HSP90α: #ADI-SPS-771F), Proteintech (TEL2: #15975-1-AP, HAX1: #11266-1-AP, WT1: #12609-1-AP, CUL4B: #12916-1-AP) and Santa Cruz (HA Y-11: #sc-805, MCT4: #sc-50329). A rabbit polyclonal anti-FBXO9 antibody was a kind gift of Michele Pagano. A polyclonal antibody against CRBN was generated by immunizing rabbits with a mixture of two peptides containing amino acids 1-19 and 424-437 of human CRBN (MAGEDQQDAAHNMGNHLPC and CPTIDPTEDEISPDK) with Innovagen. Secondary antibodies (anti-rabbit IgG, anti-mouse IgG or protein-A) coupled with horseradish peroxidase were from GE Healthcare, an anti-goat IgG secondary antibody was from Santa Cruz. Secondary antibodies (anti-rabbit IgG and anti-mouse IgG) coupled to Alexa Fluor 594 or Alexa Fluor 488 for immunofluorescence and flow cytometry were from Life technologies.
Cell lysis, immunoprecipitations and immunoblotting
Cell samples were lysed in standard lysis buffer (NaCl 150mM, Tris-HCl 50mM pH 7.5, MgCl2 5mM, EDTA 1mM, NP-40 0.1%, Glycerol 5% and protease inhibitors) unless otherwise specified. 20mM sodium molybdate (Sigma) was added where indicated. Some experiments were conducted under low salt conditions (NaCl 20mM, Tris-HCl 50mM pH 7.5, EDTA 1mM, NP-40 0.1%, MgCl2 5mM, glycerol 5%) as indicated in the figure legends. Extract preparation, immunoprecipitation, and immunoblotting have been previously described (Bassermann et al., 2008; Baumann et al., 2014; Fernández-Sáiz et al., 2013). The cellular lysates were centrifuged 15 min at 14 000 rpm at 4°C to separate from cellular debris, protein concentration was measured using a Bio-Rad DC protein assay (Lowry assay) and Laemmli buffer was added. The lysates were separated by SDS-PAGE and blotted onto PVDF membranes (Millipore). Equal protein levels were confirmed by Ponceau S staining. After blocking unspecific binding in 5% milk, membranes were incubated with primary antibodies diluted in 5% milk or 5% BSA (bovine serum albumin). After addition of horseradish peroxidase coupled secondary antibodies, western blot membranes were developed using the ECL (enhanced chemo luminescence) method (SuperSignal West, Thermo Scientific). Densitometric quantification of bands was performed using Quantity One software (Biorad) on low saturation exposures. For immunoprecipitations (IPs), cell lysates were incubated with FLAG-M2 agarose beads (Sigma) for FLAG-IPs and HA-7 agarose beads (Sigma) for HA-IPs. For endogenous IPs, WCE were subjected to a pre-clear with Prot. A Sepharose (Merck) for 1h at 4°C and followed by an overnight incubation with 8μg α-CRBN or α-IgG rabbit (Bethyl) antibody. The next day Prot. A Agarose was added after blocking in 5% BSA for 30 minutes at 4°C. After washing the beads four times in lysis buffer, Laemmli buffer was added and proteins were analyzed by SDS-electrophoresis.
Transient transfections and lentivirus-mediated DNA transfer
HEK293T cells were transfected using the calcium phosphate method, HeLa cells were transfected with Lipofectamine transfection reagent (Invitrogen) or ViaFect transfection reagent (Promega) according to the manufacturer’s instructions. For lentivirus production, HEK293T cells were transfected with shRNA encoding pLKO.1 plasmids (Addgene) or, for overexpression, pHIV-EGFP (Addgene) based constructs, together with the envelope plasmid pMD2.G (Addgene) and the packaging plasmid psPAX2 (Addgene). 48 hours after transfection, the virus-containing medium was collected and supplemented with 8μg/ml Polybrene (Sigma).
For infection, MM cell lines or HeLa cells were plated in 6 well plates and incubated with the virus-containing supernatant for 24 hours. Cells were spin infected at 1000 rpm for 30 min at 37°C. Cell lines with low infection rates were subsequently sorted for positive cells using FACSAria (BD Biosciences).
Recombinant proteins and GST- affinity purifications
GST fusion proteins were purified from E. Coli BL21 cells after induction with isopropyl-β-D-thiogalactopyranoside (IPTG) in NETN buffer (NaCl 100mM, Tris-HCl 20mM pH 7.5, EDTA 1mM, NP-40 0.5%, PMSF 2mM and protease inhibitors). For GST affinity purifications, pre-cleared mammalian cell lysates were incubated with empty glutathione Sepharose 4B beads (Amersham Biosciences) or GST- purified proteins for 1.5 hours. For IVT assays, purified GST-Fragments of CD98hc and LAT1 were incubated with in vitro-translated CRBN in binding buffer (1 × phosphate-buffered saline [PBS], 0.1% NP-40, 0.5 mM dithiothreitol [DTT], 10% glycerol, supplemented with protease inhibitors). In vitro translation was done with the TNT T7 quick-coupled transcription/translation system (Promega Corporation, Madison, Wis.) following the manufacturer’s instructions.
Indirect immunofluorescence
Immunofluorescence was performed as previously described (Eichner et al., 2016) . Briefly, wild-type HeLa cells, or HeLa cells expressing shCRBN or shCtrl, were plated on chambered PCA tissue-culture slides (Sarstedt) and transfected with constructs expressing FLAG-LAT1 and HA-CD98 by using Lipofectamine (Invitrogen). Where indicated, cells were treated with 50 μM lenalidomide for 72 h or 50 nM 17-AAG for 16 h or DMSO as a control. For immunofluorescence, cells were washed in PBS, fixed and permeabilized in 100% methanol at −20°C for 10 min, and then incubated with the primary antibodies anti-FLAG rabbit (Merck), anti-HA mouse (Biolegend), anti-TGN46 sheep (BioRad) and Biotin-conjugated anti-Calnexin mouse (Novus Biologicals) for 1 h at 25°C in 0.5% Tween 20 in PBS (0.5% TBST). Slides were washed three times in 0.5% TBST for 5 min and incubated with the secondary antibodies Alexa Fluor-488-, Alexa Fluor-594-, or Alexa Fluor-633-conjugated anti-rabbit, anti-mouse, and anti-sheep antibodies (Invitrogen), or Alexa Fluor-546-conjugated Streptavidin, diluted 1:1,000 in 0.5% TBST. Slides were washed three times and subsequently mounted with Gold Antifade Mountant (Invitrogen) containing DAPI for counterstaining of nuclei. Images were acquired with a Leica TCS SP8 WLL confocal microscope.
mRNA analysis
For quantification of CD98hc, LAT1 and ARPP P0 mRNA expression in human cell lines, total RNA was extracted using the RNeasy Kit (QIAGEN). cDNA synthesis was performed using Superscript III (Life technologies). Quantitative PCR analysis (SYBR Green) was performed on the LC480 instrument (Roche) according to standard procedures. ARPP (acidic ribosomal phosphoprotein P0) was used as internal reference. Primer sequences were as follows:
LAT1: 5′- GAAGAGGCGCGGGAGAAG AT-3′ and 5′- GTTGAGCAGCGTGATGTT CC-3′; CD98hc: 5′- ATGGAGCTACAGCCTCCTGA-3′ and 5′- CGCGCTGAGACCCTGG −3′; ARPP: 5′-GCACTGGAAGTCCAACTACTTC-3′ and 5′-TGAGGTCCTCCTTGGTGAACAC-3′.
Flow cytometry
MM cell lines
MM1.S cells treated with lenalidomide or DMSO for 72 hours were incubated with CD98hc-PE (BD PharMingen, clone UM7F8) or its Isotype control mIgG1k- PE (BD PharMingen, clone MOPC-21) or CD98hc-APC (Miltenyi 130-105-662) or its Isotype control REA Control APC (Miltenyi 130-104-615). After washing, stained cells were analyzed for CD98hc expression using a FACSCalibur (Becton Dickinson) or BD FACSCanto (BD Biosciences) and data were analyzed using FlowJo software (TreeStar Inc.).
Primary MM cells
Cells were collected and washed with PBS. Subsequently, cells were stained with CD138-biotin (Miltenyi, cat.: 130099162) and CD38-biotin (Miltenyi, cat.: 130092288) antibodies, followed by incubation with Streptavidin- eFlour450 (PB) (eBioscience, cat.: 48431782) and CD98hc-PE (BD PharMingen, clone UM7F8) or its Isotype control mIgG1k- PE (BD PharMingen, clone MOPC-21) antibodies. The combination of APC Annexin V (BD PharMingen) and PI was added to each sample for the determination of apoptosis and necrosis. Flow cytometry was performed on a CyAn ADP LxP8 (Coulter-Cytomation) and data were analyzed using FlowJo software (TreeStar Inc.). Median fluorescence intensity was calculated on CD98hc-PE and its respective isotype control mIgG1k- PE. All human specimens were processed with informed consent in compliance with the institutional review board at the Faculty of Medicine of the Technical University of Munich.
Anticalin flow cytometry
Cells were resuspended in 250 μL FACS buffer (PBS + 10% (v/v) FBS) supplemented with 1 μM D11vs-PAS200-Cy5.5 and incubated for 1h at 4°C. Competition experiments were performed by adding a 100-fold molar concentration of the soluble hCD98hcED. The Sulfo-Cy5.5 conjugate of recombinant wtLcn2-PAS200 was used as a negative. After washing, stained cells were analyzed for CD98hc expression using a FACSCalibur (Becton Dickinson) or BD FACSCanto (BD Biosciences) and data were analyzed using FlowJo software (TreeStar Inc.).
Cell Proliferation
MM cells were subjected to treatment with various drugs for the indicated times or infected with lentiviral-shRNA. On days indicated, proliferation was assessed using the trypan blue exclusion method. Results are presented as ratios to vehicle, wild-type or sh_scramble controls.
L-Leucine transport assay
For L-Leucine import studies MM1S (wt or sh scr/sh LAT1) cells were pre-treated with 10 μM lenalidomide or DMSO for 72hrs. Fresh lenalidomide was added after 48h. 1 × 10⁶ Cells were harvested on day 3 and washed 3x in preheated sodium-free Hanks Balanced Salt Solution (HBSS: 125mM choline chloride, 4.8mM KCl, 1.2mM MgSO4, 1.2mM KH2PO4, 1.3mM CaCl2, 5.6 mM glucose, 25mM HEPES). Cells were incubated in HBSS with 1 μM JPH-203 (Sigma), 1mM BCH (Sigma) or vehicle control for 10min at 37°C, followed by a 1-minute incubation with 1 μM 14C-L-Leucine (MC175, Moravek Inc.) at 37°C. Cells were washed 3x with ice-cold HBSS (supplemented with 1 μM non-labeled L-Leucine) and lysed in 50 μL lysis buffer followed by a 15-minute incubation on ice. For the measurement the lysate was mixed with 1ml Ultima Gold XR scintillation cocktail (Perkin Elmer) and measured on a β-liquid scintillation counter (TRI-CARB4910TR, Perkin Elmer).
ATPase assays
AHA1-FLAG, HA-HSP90 and CRBN-Strep-Strep-FLAG were transiently expressed in HEK293T cells as described above. Proteins were immunoprecipitated using FLAG-, HA-agarose (both Sigma) or Streptactin Superflow Sepharose (IBA Lifesciences) respectively and washed five times with 250mM lysis buffer. Beads were then equilibrated into ATPase buffer (20mM KCl, 20mM MgCl2, 50mM TrisHCl pH 7.5). Proteins were then eluted using the corresponding FLAG/HA peptides or Desthiobiotin containing Buffer E. Proteins were concentrated and separated from peptides using Amicon Ultra-0.5 mL 10k Centrifugal Filters (Merck Millipore). Proteins were visualized by SDS-PAGE and Coomassie Brilliant Blue staining. The ATPase activity of human HSP90 was then measured using the purified proteins in the Molecular Probes PiPer Phosphate-Assay-Kit (Thermo Fisher) according to the manufacturer’s instructions.
Studies in mice
For knock-down xenograft experiments, MM1S cells were lentivirally infected with either shRNA constructs specifically targeting CD98hc and LAT1 or scrambled control shRNA. From both derived MM1S transduction-lines 0.6 × 10⁷ cells were suspended in PBS, mixed with Matrigel Basement Membrane Matrix (BD Bioscience) at a 1:1 ratio and injected subcutaneously into the opposite flanks of randomly selected female NOD.CB17/AlhnRj-Prkdcscid/Rj mice 8–10 weeks of age (Janvier). For Anticalin xenograft experiments, 0.6 × 10⁷ wild-type MM1S cells were injected together with Matrigel s.c. into the right flank of female NOD SCID mice 8-10 weeks of age (Charles River). Mice were housed under SPF condition and animal experiments were conducted with permission from the District Government of Upper Bavaria (application no.: 55.2-2532.Vet_02-16-141 / 55.2-1-54-2532-216-15)
Imaging and ex vivo analyses
Three to four weeks post xenograft implantation, all mice underwent imaging using an Inveon micro-PET/CT small animal scanner (Siemens Preclinical Solutions). For the knock-down study, a dose of 5-10 MBq 18F-FDG was administered by tail vein injection and a 15-min static image was acquired 45 min post injectionem. For the Anticalin study mice were injected with 5.0 ± 0.4 MBq of 89Zr-PAS(200)-D11vs that had be produced, conjugated and radiolabeled as described before (Deuschle et al., 2020) and static PET-images of 30 min were recorded 24 h post injectionem. The cohort in which the binding of the 89Zr-Anticalin was blocked competitively received an additional 1000-fold molar excess of the ‘cold’ PASylated Anticalin. Imaging data from both studies was reconstructed using the OSEM-3D algorithm and data analysis was performed using the Inveon Research Workplace software (Siemens Medical solutions). The metabolic tumor volume was determined from PET images placing a threshold-based three-dimensional region of interest of isocontour 50% around the maximum activity of the tumor.
Tumors were allowed to reach a maximal diameter of 15 mm, according to the predefined humane endpoint. At the end of the experiment, mice were sacrificed, xenograft tumors were explanted and subsequently weigh and radioactivity was determined. For immunoblotting, tumors were thereafter passed through 70-μm cell strainers and lysed in 150mM lysis buffer. Tumor tissue samples for IHC were fixed in 4% PFA.
For immunohistochemistry, sections were deparaffinized and rehydrated. Antigen retrieval was conducted in preheated 10 mM citrate buffer (pH 6.0) or EDTA buffer (ph 9.0) in a pressure cooker for 7 min. Subsequently slides were incubated with anti-SLC7A5/LAT1 antibody (Abcam EPR17573: ab208776), anti-CD98hc antibody (Santa Cruz, E-5: sc-376815), anti-CD38 antibody (ab125038, Abcam) for 1 hour at room temperature. Signal detection was performed using the Dako REAL detection system (DAKO, Glostrup, Denmark) according to the suppliers’ recommendations.
For all tumor growth studies, a group size of at least four animals per condition was chosen. Experiments were performed in accordance with the local ethical guidelines and approved by the responsible regional authorities (Regierung von Oberbayern).
Cell surface biotinylation and extraction
MM1S cells were grown in flasks and surface proteins of a minimum of 10 million of control cells or cells treated with 1 μM lenalidomide for 48h were biotinylated with EZ-Link Sulfo-NHS-SS-Biotin at 4°C for 30 minutes following manufacturer's instructions (Pierce Cell Surface Protein Isolation Kit Cat. Nr. 89881, Thermo Scienctific). Subsequently, biotinylated proteins were pulled down with Neutravidin beads. Cell surface proteins were eluted in Laemmli buffer under reducing conditions and analyzed by MS.
LC-MS/MS measurements
For mass spectrometry (MS) analysis, the whole cell lysate and the cell surface enriched fraction were reduced by adding fresh dithiothreitol (10 mM, 10 min, 90°C), alkylated with chloroacetamide (50 mM, 30 min, at room temperature in the dark) and run 1 cm into a 4%–12% Bis-Tris NuPAGE™ gel (Invitrogen). Digestion of proteins was performed using trypsin according to standard in-gel procedures. Tryptic peptides were reconstituted in 0.1% formic acid (FA) and analyzed by nanoLC-MS/MS on a Dionex Ultimate 3000 UHPLC+ system coupled to a Fusion Lumos Tribrid mass spectrometer (Thermo Fisher Scientific). After 10 min of washing (0.1% FA, 5 μL/min) on a trap column (75 um x 2 cm, 5 μm C18 resin; Reprosil PUR AQ, Dr. Maisch), peptides were transferred to an analytical column (75 um x 45 cm, 3 μm C18 resin; Reprosil Gold, Dr. Maisch) and separated at 300 nL/min using a 100 min linear gradient from 4% to 32% LC solvent B (0.1% FA, 5% dimethyl sulfoxide (DMSO) in acetonitrile) in LC solvent A (0.1% FA in 5% DMSO). The Fusion Lumos was operated in data dependent and positive ionization mode. MS1 spectra were recorded in the Orbitrap from 360 to 1300 m/z at a resolution of 60K (automatic gain control (AGC) target value of 4e5 charges, maximum injection time (maxIT) of 50 ms). After peptide fragmentation via higher energy collisional dissociation (normalized collision energy of 30%), MS2 spectra for peptide identification were recorded in the Orbitrap at 30K resolution via sequential isolation of up to 20 precursors (isolation window 1.7 m/z, AGC target value of 2e5, maxIT of 50 ms, dynamic exclusion of 35 s).
MS data base search and analysis
Peptide and protein identification and quantification in the cell surface fraction and whole cell lysate were performed using MaxQuant (v1.6.0.16) by searching the MS2 spectra against the SwissProt database (42,271 entries, downloaded on 07.02.2018) supplemented with common contaminants. Lys0/Arg0 and Lys6/Arg10 were specified as metabolic labels. The match-between-runs algorithm was enabled. All other search parameters were left as default. Protein intensities were computed as the sum of the area-under-the-curve of chromatographic elution profiles of peptides assigned to the proteins. Protein intensities in the cell surface fraction were normalized for SILAC mixing errors based on the total sums of peptide intensities in the light and heavy channel of the whole cell lysate. For calculation of normalization factors only peptides which were quantified in both channels were considered. Batch correction across the three MS injections of the cell surface fraction was performed by row-wise normalization (Zecha et al., 2018) under the premise that the sum of the light and heavy SILAC channel should be the same for a protein across all three MS injections. Before further data analysis using the Perseus software suite (v.1.6.2.3), hits to the reverse and contaminant databases and proteins with less than 2 unique peptides were removed. The enrichment of surface proteins was verified by performing a rank-based 1D functional enrichment (Cox and Mann, 2012) using gene ontology cellular component (GOCC) annotations and protein intensity ratios of the surface fraction to the whole cell lysate. Results were corrected for multiple testing applying 1% false discovery rate (FDR) using the Benjamini-Hochberg method. Proteins significantly regulated by lenalidomide in the cell surface fraction were determined using log2 transformed intensities and an unpaired, two-sided Student’s t test, assuming equal variances, and requiring a valid quantification in both SILAC channels in at least 2 replicates. Instead of choosing a fixed p value cut-off for the determination of statistical significance, the cut-off was adjusted on the fold-change level in a data-driven way. For this, the constant S0, which accounts for differing variances across the intensity range of measured values and adapts the significance cut-off of statistical analyses accordingly, was calculated in R v.3.4.1 using the function “samr” (S0 = 0.4). Further, the result was corrected for multiple testing at 5% FDR. For mapping of potential interaction partners of CRBN to proteins identified in the surface enriched sample, raw data of CRBN interaction experiments published previously (Eichner et al., 2016) were re-searched using MaxQuant as described above with following modifications: No metabolic labels were specified. Instead, the LFQ algorithm was enabled, but normalization was skipped. Proteins showing an at least 8-fold intensity increase in the sample containing tagged CRBN compared to untagged CRBN or the empty vector were considered to be potential interaction partners of CRBN. Mapping was performed based on the first gene name in each protein group.
MS data availability
The MS proteomics raw data and MaxQuant search results have been deposited to the ProteomeXchange Consortium (http://www.proteomexchange.org/) via the PRIDE partner repository with the dataset identifier PXD018244.
Quantification and statistical analysis
Statistical analyses of the results were performed by Student’s t test, one-sample t test or one-way ANOVA, according to assumptions of the test, using GraphPad Prism software as indicated in the figure legends. Statistical analysis of relative ratios was performed using one-sample t tests with hypothetical means of 1.0. The error bars shown in the figures and supplementary figures represent the mean ± SD. The p values are presented in the figure legends where a statistically significant difference was found: ∗, p < 0.05; ∗∗, p < 0.01; ∗∗∗, p < 0.001; ∗∗∗∗, p < 0.0001. n indicates the number of independent biological replicates of an experiment.
Acknowledgments
We thank Ritu Mishra for assistance with confocal microscopy; Markus Utzt for cell sorting; Elisabeth Bliemsrieder, Laura Jacobs, and Jolanta Slawska for assistance with xenograft tumor implantation and imaging; Sybille Reder, Markus Mittelhäuser, and Hannes Rolbieski for PET/CT acquisition; and Jakob Allmann and Behrooz Yousefi for suggestions regarding β-scintillation measurements. Raymond Frizzell is acknowledged for providing the CFTR expression construct and W. Kaelin for the kind gift of CRISPR-based HEK293FT CRBN–/– cells and two clones of MM1S CRBN–/– cells. This work was supported by a fellowship from TU München (KKF 8700000414) to M.H., a Deutsches Konsortium für Translationale Krebsforschung (DKTK) clinician scientist fellowship to R.E., and grants from the European Research Commission (project BCM-UPS, grant 682473) to F.B. and Deutsche Forschungsgemeinschaft (DFG; German Research Foundation) (project ID 360372040-SFB 1335 to F.B., V.F.-S., and U.K.; SFB1243 to F.B. and K.S.G.; SFB 1035 to J.B.; and SFB 824 to A.S., U.K., and W.A.W.).
Author contributions
M.H., R.E., V.F.-S., and F.B. conceived and designed the research. M.H., R.E., and V.F.-S. performed most of the experiments, with crucial help from J.S. and A.K. M.V. provided MM samples, and K.S.G. and A.-K.G. performed fluorescence-activated cell sorting (FACS) analyses thereof. M.R. performed immunohistochemical analyses of xenografted tumors. K.B. and B.A.S. provided purified CRBN protein. J.Z., S.L., and B.K. performed mass spectrometry. V.M., F.-C.D., A.S., and W.A.W. provided CD98hc-Anticalin (D11vs-PAS200) and performed respective PET imaging. J.L. and J.B. provided specific HSP90-related expertise and helped with HSP90 experiments. M.H., R.E., V.M., J.Z., J.L., A.-K.G., U.K., K.S.G., A.S., W.A.W., J.B., B.A.S., B.K., V.F.-S., and F.B. analyzed results. F.B. coordinated this work. M.H., R.E., V.F.-S., and F.B. wrote the manuscript. All authors discussed the results and commented on the manuscript.
Declaration of interests
F.B., K.S.G. and U.K. received honoraria and research funding from BMS/Celgene.
Published: February 10, 2021
Footnotes
Supplemental information can be found online at https://doi.org/10.1016/j.molcel.2020.12.046.
Contributor Information
Vanesa Fernández-Sáiz, Email: vanesa.fernandez@tum.de.
Florian Bassermann, Email: florian.bassermann@tum.de.
Supplemental information
References
- Ali M.M., Roe S.M., Vaughan C.K., Meyer P., Panaretou B., Piper P.W., Prodromou C., Pearl L.H. Crystal structure of an Hsp90-nucleotide-p23/Sba1 closed chaperone complex. Nature. 2006;440:1013–1017. doi: 10.1038/nature04716. [DOI] [PMC free article] [PubMed] [Google Scholar]
- Attal M., Lauwers-Cances V., Hulin C., Leleu X., Caillot D., Escoffre M., Arnulf B., Macro M., Belhadj K., Garderet L., IFM 2009 Study Lenalidomide, bortezomib, and dexamethasone with transplantation for myeloma. N. Engl. J. Med. 2017;376:1311–1320. doi: 10.1056/NEJMoa1611750. [DOI] [PMC free article] [PubMed] [Google Scholar]
- Bassermann F., Frescas D., Guardavaccaro D., Busino L., Peschiaroli A., Pagano M. The Cdc14B-Cdh1-Plk1 axis controls the G2 DNA-damage-response checkpoint. Cell. 2008;134:256–267. doi: 10.1016/j.cell.2008.05.043. [DOI] [PMC free article] [PubMed] [Google Scholar]
- Baumann U., Fernández-Sáiz V., Rudelius M., Lemeer S., Rad R., Knorn A.M., Slawska J., Engel K., Jeremias I., Li Z. Disruption of the PRKCD-FBXO25-HAX-1 axis attenuates the apoptotic response and drives lymphomagenesis. Nat. Med. 2014;20:1401–1409. doi: 10.1038/nm.3740. [DOI] [PubMed] [Google Scholar]
- Bolzoni M., Chiu M., Accardi F., Vescovini R., Airoldi I., Storti P., Todoerti K., Agnelli L., Missale G., Andreoli R. Dependence on glutamine uptake and glutamine addiction characterize myeloma cells: a new attractive target. Blood. 2016;128:667–679. doi: 10.1182/blood-2016-01-690743. [DOI] [PubMed] [Google Scholar]
- Cox J., Mann M. 1D and 2D annotation enrichment: a statistical method integrating quantitative proteomics with complementary high-throughput data. BMC Bioinformatics. 2012;13(Suppl 16):S12. doi: 10.1186/1471-2105-13-S16-S12. [DOI] [PMC free article] [PubMed] [Google Scholar]
- Cymer F., von Heijne G., White S.H. Mechanisms of integral membrane protein insertion and folding. J. Mol. Biol. 2015;427:999–1022. doi: 10.1016/j.jmb.2014.09.014. [DOI] [PMC free article] [PubMed] [Google Scholar]
- Deuschle F.C., Morath V., Schiefner A., Brandt C., Ballke S., Reder S., Steiger K., Schwaiger M., Weber W., Skerra A. Development of a high affinity Anticalin® directed against human CD98hc for theranostic applications. Theranostics. 2020;10:2172–2187. doi: 10.7150/thno.38968. [DOI] [PMC free article] [PubMed] [Google Scholar]
- Dunn D.M., Woodford M.R., Truman A.W., Jensen S.M., Schulman J., Caza T., Remillard T.C., Loiselle D., Wolfgeher D., Blagg B.S. c-Abl mediated tyrosine phosphorylation of Aha1 activates its co-chaperone function in cancer cells. Cell Rep. 2015;12:1006–1018. doi: 10.1016/j.celrep.2015.07.004. [DOI] [PMC free article] [PubMed] [Google Scholar]
- Eichner R., Heider M., Fernández-Sáiz V., van Bebber F., Garz A.K., Lemeer S., Rudelius M., Targosz B.S., Jacobs L., Knorn A.M. Immunomodulatory drugs disrupt the cereblon-CD147-MCT1 axis to exert antitumor activity and teratogenicity. Nat. Med. 2016;22:735–743. doi: 10.1038/nm.4128. [DOI] [PubMed] [Google Scholar]
- Eichner R., Fernández-Sáiz V., Targosz B.S., Bassermann F. Cross talk networks of mammalian target of rapamycin signaling with the ubiquitin proteasome system and their clinical implications in multiple myeloma. Int. Rev. Cell Mol. Biol. 2019;343:219–297. doi: 10.1016/bs.ircmb.2018.06.001. [DOI] [PubMed] [Google Scholar]
- Fernández-Sáiz V., Targosz B.S., Lemeer S., Eichner R., Langer C., Bullinger L., Reiter C., Slotta-Huspenina J., Schroeder S., Knorn A.M. SCFFbxo9 and CK2 direct the cellular response to growth factor withdrawal via Tel2/Tti1 degradation and promote survival in multiple myeloma. Nat. Cell Biol. 2013;15:72–81. doi: 10.1038/ncb2651. [DOI] [PubMed] [Google Scholar]
- Fischer E.S., Böhm K., Lydeard J.R., Yang H., Stadler M.B., Cavadini S., Nagel J., Serluca F., Acker V., Lingaraju G.M. Structure of the DDB1-CRBN E3 ubiquitin ligase in complex with thalidomide. Nature. 2014;512:49–53. doi: 10.1038/nature13527. [DOI] [PMC free article] [PubMed] [Google Scholar]
- Gandhi A.K., Kang J., Havens C.G., Conklin T., Ning Y., Wu L., Ito T., Ando H., Waldman M.F., Thakurta A. Immunomodulatory agents lenalidomide and pomalidomide co-stimulate T cells by inducing degradation of T cell repressors Ikaros and Aiolos via modulation of the E3 ubiquitin ligase complex CRL4(CRBN.) Br. J. Haematol. 2014;164:811–821. doi: 10.1111/bjh.12708. [DOI] [PMC free article] [PubMed] [Google Scholar]
- Goetz D., Ren C.L. Review of cystic fibrosis. Pediatr. Ann. 2019;48:e154–e161. doi: 10.3928/19382359-20190327-01. [DOI] [PubMed] [Google Scholar]
- Guna A., Hegde R.S. Transmembrane domain recognition during membrane protein biogenesis and quality control. Curr. Biol. 2018;28:R498–R511. doi: 10.1016/j.cub.2018.02.004. [DOI] [PubMed] [Google Scholar]
- Habermeier A., Graf J., Sandhöfer B.F., Boissel J.P., Roesch F., Closs E.I. System L amino acid transporter LAT1 accumulates O-(2-fluoroethyl)-L-tyrosine (FET) Amino Acids. 2015;47:335–344. doi: 10.1007/s00726-014-1863-3. [DOI] [PubMed] [Google Scholar]
- Higgins J.J., Hao J., Kosofsky B.E., Rajadhyaksha A.M. Dysregulation of large-conductance Ca2+-activated K+ channel expression in nonsyndromal mental retardation due to a cereblon p.R419X mutation. Neurogenetics. 2008;9:219–223. doi: 10.1007/s10048-008-0128-2. [DOI] [PubMed] [Google Scholar]
- Hohberger B., Enz R. Cereblon is expressed in the retina and binds to voltage-gated chloride channels. FEBS Lett. 2009;583:633–637. doi: 10.1016/j.febslet.2009.01.018. [DOI] [PubMed] [Google Scholar]
- Isoda A., Kaira K., Iwashina M., Oriuchi N., Tominaga H., Nagamori S., Kanai Y., Oyama T., Asao T., Matsumoto M., Sawamura M. Expression of L-type amino acid transporter 1 (LAT1) as a prognostic and therapeutic indicator in multiple myeloma. Cancer Sci. 2014;105:1496–1502. doi: 10.1111/cas.12529. [DOI] [PMC free article] [PubMed] [Google Scholar]
- Ito T., Ando H., Suzuki T., Ogura T., Hotta K., Imamura Y., Yamaguchi Y., Handa H. Identification of a primary target of thalidomide teratogenicity. Science. 2010;327:1345–1350. doi: 10.1126/science.1177319. [DOI] [PubMed] [Google Scholar]
- Jo S., Lee K.H., Song S., Jung Y.K., Park C.S. Identification and functional characterization of cereblon as a binding protein for large-conductance calcium-activated potassium channel in rat brain. J. Neurochem. 2005;94:1212–1224. doi: 10.1111/j.1471-4159.2005.03344.x. [DOI] [PubMed] [Google Scholar]
- Kerem B., Rommens J.M., Buchanan J.A., Markiewicz D., Cox T.K., Chakravarti A., Buchwald M., Tsui L.C. Identification of the cystic fibrosis gene: genetic analysis. Science. 1989;245:1073–1080. doi: 10.1126/science.2570460. [DOI] [PubMed] [Google Scholar]
- Koulov A.V., LaPointe P., Lu B., Razvi A., Coppinger J., Dong M.Q., Matteson J., Laister R., Arrowsmith C., Yates J.R., 3rd, Balch W.E. Biological and structural basis for Aha1 regulation of Hsp90 ATPase activity in maintaining proteostasis in the human disease cystic fibrosis. Mol. Biol. Cell. 2010;21:871–884. doi: 10.1091/mbc.E09-12-1017. [DOI] [PMC free article] [PubMed] [Google Scholar]
- Krönke J., Udeshi N.D., Narla A., Grauman P., Hurst S.N., McConkey M., Svinkina T., Heckl D., Comer E., Li X. Lenalidomide causes selective degradation of IKZF1 and IKZF3 in multiple myeloma cells. Science. 2014;343:301–305. doi: 10.1126/science.1244851. [DOI] [PMC free article] [PubMed] [Google Scholar]
- Krönke J., Fink E.C., Hollenbach P.W., MacBeth K.J., Hurst S.N., Udeshi N.D., Chamberlain P.P., Mani D.R., Man H.W., Gandhi A.K. Lenalidomide induces ubiquitination and degradation of CK1α in del(5q) MDS. Nature. 2015;523:183–188. doi: 10.1038/nature14610. [DOI] [PMC free article] [PubMed] [Google Scholar]
- Lin C.Y., Lee C.H., Chuang Y.H., Lee J.Y., Chiu Y.Y., Wu Lee Y.H., Jong Y.J., Hwang J.K., Huang S.H., Chen L.C. Membrane protein-regulated networks across human cancers. Nat. Commun. 2019;10:3131. doi: 10.1038/s41467-019-10920-8. [DOI] [PMC free article] [PubMed] [Google Scholar]
- Lopez-Girona A., Mendy D., Ito T., Miller K., Gandhi A.K., Kang J., Karasawa S., Carmel G., Jackson P., Abbasian M. Cereblon is a direct protein target for immunomodulatory and antiproliferative activities of lenalidomide and pomalidomide. Leukemia. 2012;26:2326–2335. doi: 10.1038/leu.2012.119. [DOI] [PMC free article] [PubMed] [Google Scholar]
- Lu G., Middleton R.E., Sun H., Naniong M., Ott C.J., Mitsiades C.S., Wong K.K., Bradner J.E., Kaelin W.G., Jr. The myeloma drug lenalidomide promotes the cereblon-dependent destruction of Ikaros proteins. Science. 2014;343:305–309. doi: 10.1126/science.1244917. [DOI] [PMC free article] [PubMed] [Google Scholar]
- Mesguich C., Zanotti-Fregonara P., Hindié E. New perspectives offered by nuclear medicine for the imaging and therapy of multiple myeloma. Theranostics. 2016;6:287–290. doi: 10.7150/thno.14400. [DOI] [PMC free article] [PubMed] [Google Scholar]
- Meyer P., Prodromou C., Liao C., Hu B., Mark Roe S., Vaughan C.K., Vlasic I., Panaretou B., Piper P.W., Pearl L.H. Structural basis for recruitment of the ATPase activator Aha1 to the Hsp90 chaperone machinery. EMBO J. 2004;23:511–519. doi: 10.1038/sj.emboj.7600060. [DOI] [PMC free article] [PubMed] [Google Scholar]
- Neckers L. Development of small molecule Hsp90 inhibitors: utilizing both forward and reverse chemical genomics for drug identification. Curr. Med. Chem. 2003;10:733–739. doi: 10.2174/0929867033457818. [DOI] [PubMed] [Google Scholar]
- Nicklin P., Bergman P., Zhang B., Triantafellow E., Wang H., Nyfeler B., Yang H., Hild M., Kung C., Wilson C. Bidirectional transport of amino acids regulates mTOR and autophagy. Cell. 2009;136:521–534. doi: 10.1016/j.cell.2008.11.044. [DOI] [PMC free article] [PubMed] [Google Scholar]
- Okano N., Kawai K., Yamauchi Y., Kobayashi T., Naruge D., Nagashima F., Endou H., Furuse J. First-in-human phaseIstudy of JPH203 in patients with advanced solid tumors. J. Clin. Oncol. 2018;36 419–419. [Google Scholar]
- Panaretou B., Siligardi G., Meyer P., Maloney A., Sullivan J.K., Singh S., Millson S.H., Clarke P.A., Naaby-Hansen S., Stein R. Activation of the ATPase activity of hsp90 by the stress-regulated cochaperone aha1. Mol. Cell. 2002;10:1307–1318. doi: 10.1016/s1097-2765(02)00785-2. [DOI] [PubMed] [Google Scholar]
- Raza S., Safyan R.A., Lentzsch S. Immunomodulatory drugs (IMiDs) in multiple myeloma. Curr. Cancer Drug Targets. 2017;17:846–857. doi: 10.2174/1568009617666170214104426. [DOI] [PubMed] [Google Scholar]
- Retzlaff M., Hagn F., Mitschke L., Hessling M., Gugel F., Kessler H., Richter K., Buchner J. Asymmetric activation of the hsp90 dimer by its cochaperone aha1. Mol. Cell. 2010;37:344–354. doi: 10.1016/j.molcel.2010.01.006. [DOI] [PubMed] [Google Scholar]
- Rothe C., Skerra A. Anticalin® proteins as therapeutic agents in human diseases. BioDrugs. 2018;32:233–243. doi: 10.1007/s40259-018-0278-1. [DOI] [PMC free article] [PubMed] [Google Scholar]
- Schlapschy M., Binder U., Börger C., Theobald I., Wachinger K., Kisling S., Haller D., Skerra A. PASylation: a biological alternative to PEGylation for extending the plasma half-life of pharmaceutically active proteins. Protein Eng. Des. Sel. 2013;26:489–501. doi: 10.1093/protein/gzt023. [DOI] [PMC free article] [PubMed] [Google Scholar]
- Schopf F.H., Biebl M.M., Buchner J. The HSP90 chaperone machinery. Nat. Rev. Mol. Cell Biol. 2017;18:345–360. doi: 10.1038/nrm.2017.20. [DOI] [PubMed] [Google Scholar]
- Sittler A., Lurz R., Lueder G., Priller J., Lehrach H., Hayer-Hartl M.K., Hartl F.U., Wanker E.E. Geldanamycin activates a heat shock response and inhibits huntingtin aggregation in a cell culture model of Huntington’s disease. Hum. Mol. Genet. 2001;10:1307–1315. doi: 10.1093/hmg/10.12.1307. [DOI] [PubMed] [Google Scholar]
- Smith C.K., Baker T.A., Sauer R.T. Lon and Clp family proteases and chaperones share homologous substrate-recognition domains. Proc. Natl. Acad. Sci. U S A. 1999;96:6678–6682. doi: 10.1073/pnas.96.12.6678. [DOI] [PMC free article] [PubMed] [Google Scholar]
- Stewart A.K., Rajkumar S.V., Dimopoulos M.A., Masszi T., Špička I., Oriol A., Hájek R., Rosiñol L., Siegel D.S., Mihaylov G.G., ASPIRE Investigators Carfilzomib, lenalidomide, and dexamethasone for relapsed multiple myeloma. N. Engl. J. Med. 2015;372:142–152. doi: 10.1056/NEJMoa1411321. [DOI] [PubMed] [Google Scholar]
- Stiegler S.C., Rübbelke M., Korotkov V.S., Weiwad M., John C., Fischer G., Sieber S.A., Sattler M., Buchner J. A chemical compound inhibiting the Aha1-Hsp90 chaperone complex. J. Biol. Chem. 2017;292:17073–17083. doi: 10.1074/jbc.M117.797829. [DOI] [PMC free article] [PubMed] [Google Scholar]
- Sullivan W., Stensgard B., Caucutt G., Bartha B., McMahon N., Alnemri E.S., Litwack G., Toft D. Nucleotides and two functional states of hsp90. J. Biol. Chem. 1997;272:8007–8012. doi: 10.1074/jbc.272.12.8007. [DOI] [PubMed] [Google Scholar]
- Sun L., Hartson S.D., Matts R.L. Identification of proteins associated with Aha1 in HeLa cells by quantitative proteomics. Biochim. Biophys. Acta. 2015;1854:365–380. doi: 10.1016/j.bbapap.2015.01.002. [DOI] [PubMed] [Google Scholar]
- Taipale M., Krykbaeva I., Koeva M., Kayatekin C., Westover K.D., Karras G.I., Lindquist S. Quantitative analysis of HSP90-client interactions reveals principles of substrate recognition. Cell. 2012;150:987–1001. doi: 10.1016/j.cell.2012.06.047. [DOI] [PMC free article] [PubMed] [Google Scholar]
- Verba K.A., Wang R.Y., Arakawa A., Liu Y., Shirouzu M., Yokoyama S., Agard D.A. Atomic structure of Hsp90-Cdc37-Cdk4 reveals that Hsp90 traps and stabilizes an unfolded kinase. Science. 2016;352:1542–1547. doi: 10.1126/science.aaf5023. [DOI] [PMC free article] [PubMed] [Google Scholar]
- Wang X., Venable J., LaPointe P., Hutt D.M., Koulov A.V., Coppinger J., Gurkan C., Kellner W., Matteson J., Plutner H. Hsp90 cochaperone Aha1 downregulation rescues misfolding of CFTR in cystic fibrosis. Cell. 2006;127:803–815. doi: 10.1016/j.cell.2006.09.043. [DOI] [PubMed] [Google Scholar]
- Winter G.E., Buckley D.L., Paulk J., Roberts J.M., Souza A., Dhe-Paganon S., Bradner J.E. Drug development. Phthalimide conjugation as a strategy for in vivo target protein degradation. Science. 2015;348:1376–1381. doi: 10.1126/science.aab1433. [DOI] [PMC free article] [PubMed] [Google Scholar]
- Wolfgeher D., Dunn D.M., Woodford M.R., Bourboulia D., Bratslavsky G., Mollapour M., Kron S.J., Truman A.W. The dynamic interactome of human Aha1 upon Y223 phosphorylation. Data Brief. 2015;5:752–755. doi: 10.1016/j.dib.2015.10.028. [DOI] [PMC free article] [PubMed] [Google Scholar]
- Wolmarans A., Lee B., Spyracopoulos L., LaPointe P. The mechanism of Hsp90 ATPase stimulation by Aha1. Sci. Rep. 2016;6:33179. doi: 10.1038/srep33179. [DOI] [PMC free article] [PubMed] [Google Scholar]
- Woodford M.R., Sager R.A., Marris E., Dunn D.M., Blanden A.R., Murphy R.L., Rensing N., Shapiro O., Panaretou B., Prodromou C. Tumor suppressor Tsc1 is a new Hsp90 co-chaperone that facilitates folding of kinase and non-kinase clients. EMBO J. 2017;36:3650–3665. doi: 10.15252/embj.201796700. [DOI] [PMC free article] [PubMed] [Google Scholar]
- Yan R., Zhao X., Lei J., Zhou Q. Structure of the human LAT1-4F2hc heteromeric amino acid transporter complex. Nature. 2019;568:127–130. doi: 10.1038/s41586-019-1011-z. [DOI] [PubMed] [Google Scholar]
- Zecha J., Meng C., Zolg D.P., Samaras P., Wilhelm M., Kuster B. Peptide level turnover measurements enable the study of proteoform dynamics. Mol. Cell. Proteomics. 2018;17:974–992. doi: 10.1074/mcp.RA118.000583. [DOI] [PMC free article] [PubMed] [Google Scholar]
- Zhang T., Hamza A., Cao X., Wang B., Yu S., Zhan C.G., Sun D. A novel Hsp90 inhibitor to disrupt Hsp90/Cdc37 complex against pancreatic cancer cells. Mol. Cancer Ther. 2008;7:162–170. doi: 10.1158/1535-7163.MCT-07-0484. [DOI] [PubMed] [Google Scholar]
- Zhu Y.X., Braggio E., Shi C.X., Bruins L.A., Schmidt J.E., Van Wier S., Chang X.B., Bjorklund C.C., Fonseca R., Bergsagel P.L. Cereblon expression is required for the antimyeloma activity of lenalidomide and pomalidomide. Blood. 2011;118:4771–4779. doi: 10.1182/blood-2011-05-356063. [DOI] [PMC free article] [PubMed] [Google Scholar]
- Zhu Y.X., Braggio E., Shi C.X., Kortuem K.M., Bruins L.A., Schmidt J.E., Chang X.B., Langlais P., Luo M., Jedlowski P. Identification of cereblon-binding proteins and relationship with response and survival after IMiDs in multiple myeloma. Blood. 2014;124:536–545. doi: 10.1182/blood-2014-02-557819. [DOI] [PMC free article] [PubMed] [Google Scholar]
- Zhu Y.X., Shi C.X., Bruins L.A., Wang X., Riggs D.L., Porter B., Ahmann J.M., de Campos C.B., Braggio E., Bergsagel P.L., Stewart A.K. Identification of lenalidomide resistance pathways in myeloma and targeted resensitization using cereblon replacement, inhibition of STAT3 or targeting of IRF4. Blood Cancer J. 2019;9:19. doi: 10.1038/s41408-019-0173-0. [DOI] [PMC free article] [PubMed] [Google Scholar]
Associated Data
This section collects any data citations, data availability statements, or supplementary materials included in this article.
Supplementary Materials
Data Availability Statement
The mass spectrometry proteomics raw data (cell surface proteome screen and CRBN interactome) have been deposited on the PRIDE server (https://www.ebi.ac.uk/pride/archive/) with the following accession number: PXD018244.