Abstract
The ability to comprehensively profile proteins in every individual cell of complex biological systems is crucial to advance our understanding of normal physiology and disease pathogenesis. Conventional bulk cell experiments mask the cell heterogeneity in the population, while the single-cell imaging methods suffer from the limited multiplexing capacities. Recent advances in microchip-, mass spectrometry-, and reiterative staining-based technologies have enabled comprehensive protein profiling in single cells. These approaches will bring new insights into a variety of biological and biomedical fields, such as signaling network regulation, cell heterogeneity, tissue architecture, disease diagnosis, and treatment monitoring. In this article, we will review the recent advances in the development of single-cell proteomic technologies, describe their advantages, discuss the current limitations and challenges, and propose potential solutions. We will also highlight the wide applications of these technologies in biology and medicine.
This article is categorized under:
Laboratory Methods and Technologies > Proteomics Methods
Laboratory Methods and Technologies > Imaging
Translational, Genomic, and Systems Medicine > Diagnostic Methods
Keywords: imaging, mass spectrometry, microchip, systems biology
1 |. INTRODUCTION
Cell heterogeneity is a common feature in most of the biological systems (Elsasser, 1984). The presence of molecularly and functionally different cells has been observed not only in complex multicellular organisms, but also in genetically identical yeast and bacteria cells (Altschuler & Wu, 2010). Such cell heterogeneity plays important roles in many biological processes, including cancer metastasis (Valastyan & Weinberg, 2011), tumor response to drugs (Cohen et al., 2008; Shaffer et al., 2017; Sharma et al., 2010; Spencer, Gaudet, Albeck, Burke, & Sorger, 2009), immune response (Ma et al., 2011), and stem cell differentiation (Chang, Hemberg, Barahona, Ingber, & Huang, 2008), among others. Many factors can give rise to cell heterogeneity, such as varied genetics or epigenetics, different microenvironments, and stochastic gene expression, and so on. Being composed of many distinct cell types can be essential for the health, function, and survival of a biological system. Nonetheless, many biological assays are carried out using populations of cells, which can mask cell heterogeneity in the system. Thus, the development of single-cell analysis technologies is critical to accelerate our understanding of health and disease.
Every individual cell has a huge collection of distinctive biomolecules, which are regulated by its intrinsic signaling network. Because of the complexity of such signaling network, highly multiplexed molecular profiling is required to understand the functions of the various biomolecules in a pathway and their malfunction in diseases. Among these biomolecules, proteins are essential to a wide range of cellular processes and functions, such as regulating gene expression, catalyzing biochemical reactions, providing structural support, and transporting molecules, and so on. Therefore, the development of single-cell proteomic technologies is in a critical need to advance our understanding of normal cell physiology and disease pathogenesis.
Because of the limited amount of proteins in individual cells, highly sensitive approaches are required for single-cell protein analysis. Fluorescence imaging based methods have high detection sensitivity and thus are routinely used to quantify proteins in individual cells (Wu & Singh, 2012). However, due to the spectral overlap of the common organic dyes and fluorescent proteins, a fluorescence microscope has a limited number of imaging channels. As a result, only a handful of proteins in one specimen can be studied simultaneously using these imaging based methods. Conventional proteomic assays, such as mass spectrometry (Altelaar, Munoz, & Heck, 2012) and protein microarray (Espina et al., 2003), can quantify proteins in a sample comprehensively. However, because of their limited sensitivity, these proteomic technologies require the proteins from a population of cells to be combined and analyzed together. Consequently, the variations of the individual cells in the sample are masked by these approaches. To overcome the limitations of the traditional methods and enable single-cell proteomic analysis, novel approaches with both high sensitivity and multiplexing capacity need to be developed.
This article reviews the recent technological advances of single-cell proteomic technologies. We will introduce the methods for isolated single-cell proteomic analysis and the ones for in situ proteomic analysis. We will also evaluate their advantages and limitations, and present their applications in studying cell heterogeneity and cell signaling network. Additionally, we will discuss the current challenges of these assays and propose potential solutions. In the end, we will highlight the broad impacts of these technologies on biomedical science and precision medicine.
2 |. PROTEOMIC ANALYSIS IN ISOLATED SINGLE CELLS
2.1 |. Single cell barcode chips
To enable comprehensive protein analysis in single cells, the Heath group developed the single-cell barcode chips (SCBC) (Ma et al., 2011). In this method, individual cells are compartmentalized into microchambers (Figure 1a). In each microchamber, an antibody barcode array, patterned as parallel stripes (Figure 1b), is applied to capture the secreted proteins from single cells (Figure 1c). Subsequently, the captured protein targets are stained with the corresponding biotinylated antibodies and fluorescent streptavidin. By comparing the generated fluorescent signals with the calibration curve, the abundances of the captured proteins can be determined. Alternatively, mass spectrometry can also be applied to identify and quantify the captured proteins directly (Yang, Nelson, & Ros, 2016). One of the critical requirements for the success of SCBC is the preparation of the miniaturized antibody barcodes. To achieve that, a technology called DNA-encoded antibody library (DEAL) (Fan et al., 2008; Shin et al., 2010) has been developed. In this approach, oligonucleotides with different sequences are immobilized on a polylysine-coated surface as highly dense and uniform barcodes. The immobilized oligonucleotides are then hybridized by the DNA–antibody conjugates, to convert the oligonucleotide barcodes into the antibody barcodes. With the DEAL technology, 20 antibody barcodes can be patterned in each microchamber. As a result, this spatial barcoding platform allows the analysis of up to 20 different proteins secreted from single cells.
FIGURE 1.
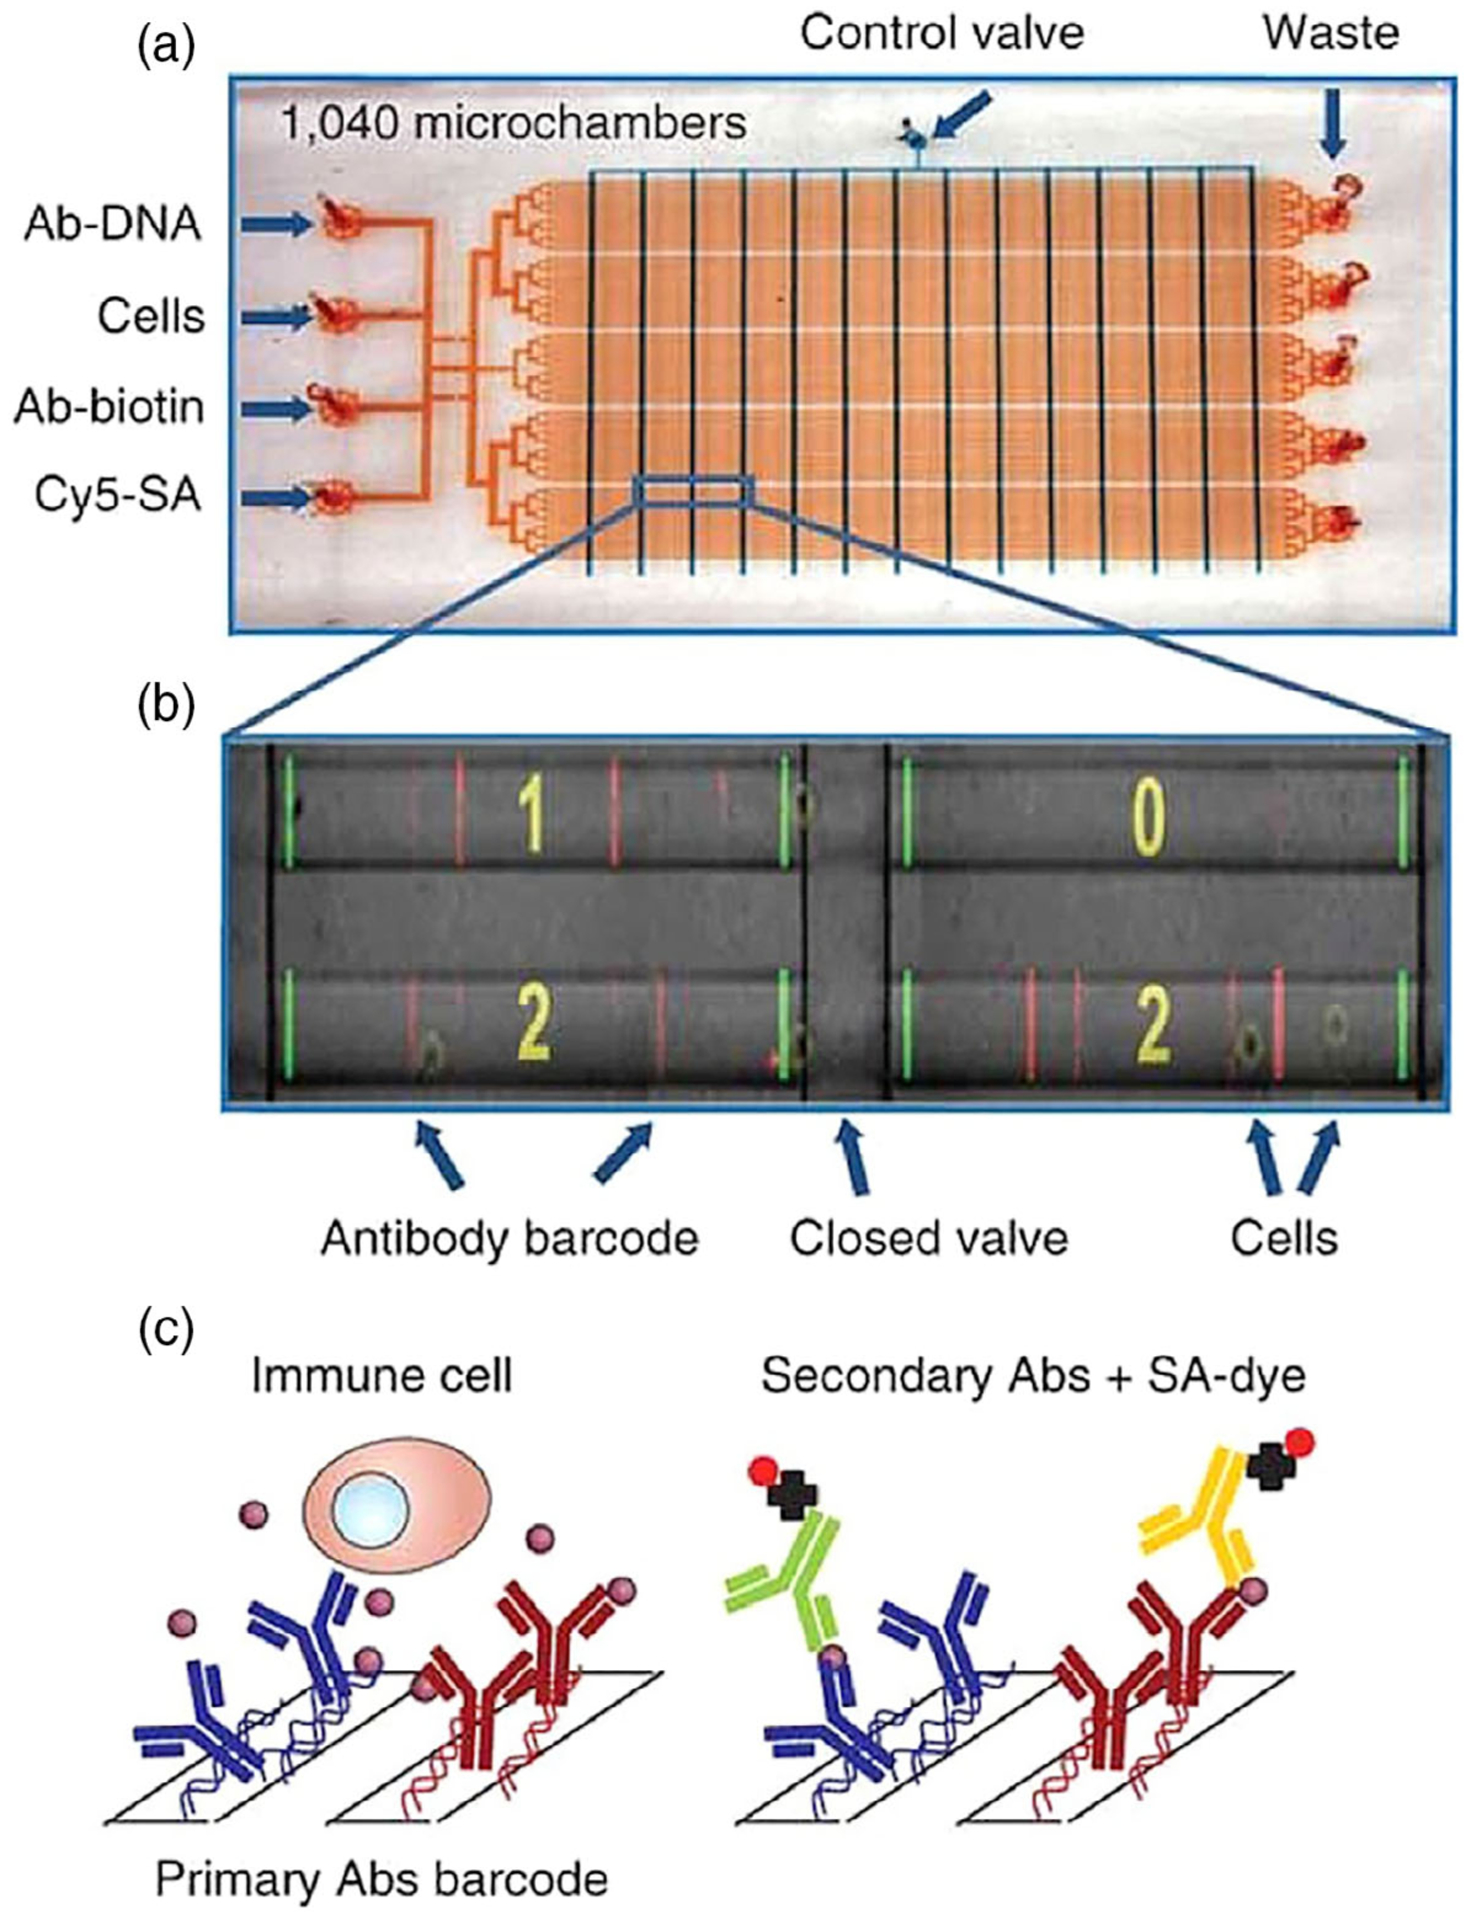
Multiplexed single-cell protein analysis with single-cell barcode chips (SCBC). (a) Image of SBSC. The control and flow channels are shown in blue and red, respectively. (b) Image of the microchambers together with the fluorescence signals detected in each chamber. (c) DNA-encoded antibody library technology, which enables the capture and detection of proteins secreted from individual cells (Reprinted with permission from Ma et al. (2011). Copyright 2011 Nature Publishing Group)
To further increase the number of proteins that can be quantified in each chamber, spatial and spectral barcodes are combined on one chip (Lu et al., 2015). In this platform, 15 spatially separated antibody stripes are patterned in each microchamber, and each stripe contains three varied antibodies. To distinguish the three different antibodies in the same stripe, they are stained with blue, green, and red detection antibodies. In this way, up to 45 secreted proteins from individual cells can be quantified in each chamber.
One of the major advantages of SCBC is that it enables the multiplexed analysis of secreted proteins from live cells, whereas other single-cell proteomic technologies can only detect membrane and intracellular proteins. Moreover, with the cells lysed in its microchamber, SBSC is also capable of simultaneously quantifying the secreted, membrane, and cytoplasmic proteins together with metabolites from the same cell (Shi et al., 2012; Xue et al., 2015). Despite its advantages, some aspects of SCBC need to be further improved. For instance, the multiplex capacity and detection sensitivity of SCBC have to be compromised. By increasing the number of antibody stripes in each microchamber, the multiplexing capacity of the assay can be enhanced. However, this will lead to the enlarged volume of the chamber and the reduced concentrations of the secreted proteins. As a result, the detection sensitivity of the assay is sacrificed. The multiplexing capacity of SCBC can also be improved by immobilizing more different antibodies in each stripe. Nonetheless, the amount of each antibody in these stripes will be reduced, resulting in the decreased sensitivity.
2.2 |. Multiplexed in situ targeting
In 2018, Zhao, Bhowmick, Yu, and Wang (2018) developed the multiplexed in situ targeting (MIST) technology for single-cell secreted protein analysis. In this approach (Figure 2), a glass coverslip is uniformly coated by a highly compact monolayer of microbeads encoded by single-stranded DNA (ssDNA). These single DNA strands are subsequently hybridized with antibodies conjugated with complementary DNA strands (Abs-cDNA), allowing every single microbead to recognize a specific protein target secreted from single cells compartmentalized into microchambers. After the detection of the protein targets with the sandwich enzyme-linked immunosorbent assay, the locations of microbeads are recorded, and the Abs-cDNA are washed off with sodium hydroxide solution. As the positions of the microbeads on the chip are fixed, the identity of protein targets is determined by the successive hybridization and dehybridization of fluorescent cDNAs. Through multiple decoding cycles, each protein target is identified by a unique encrypted code of ordered fluorescence color sequence. If M cycles are carried out and N different colors are applied in every single staining cycle, this approach could detect as many as NM proteins secreted from single cells. Thus, the multiplexing capacity of MIST has the potential to achieve tens to hundreds of proteins. However, similar to SCBC, MIST also has to compromise its multiplexing capacity and detection sensitivity. Increasing the number of microbeads or decreasing the size of microbeads will enhance the multiplexing capacity of the assay. However, in both cases, the sensitivity will be sacrificed, due to the enlarged volume of the microchambers or the reduced number of antibodies on each microbead. Additionally, the potential cross-hybridization between the different ssDNA on microbeads and the decoding probes could also limit the multiplexing capacity of this platform.
FIGURE 2.
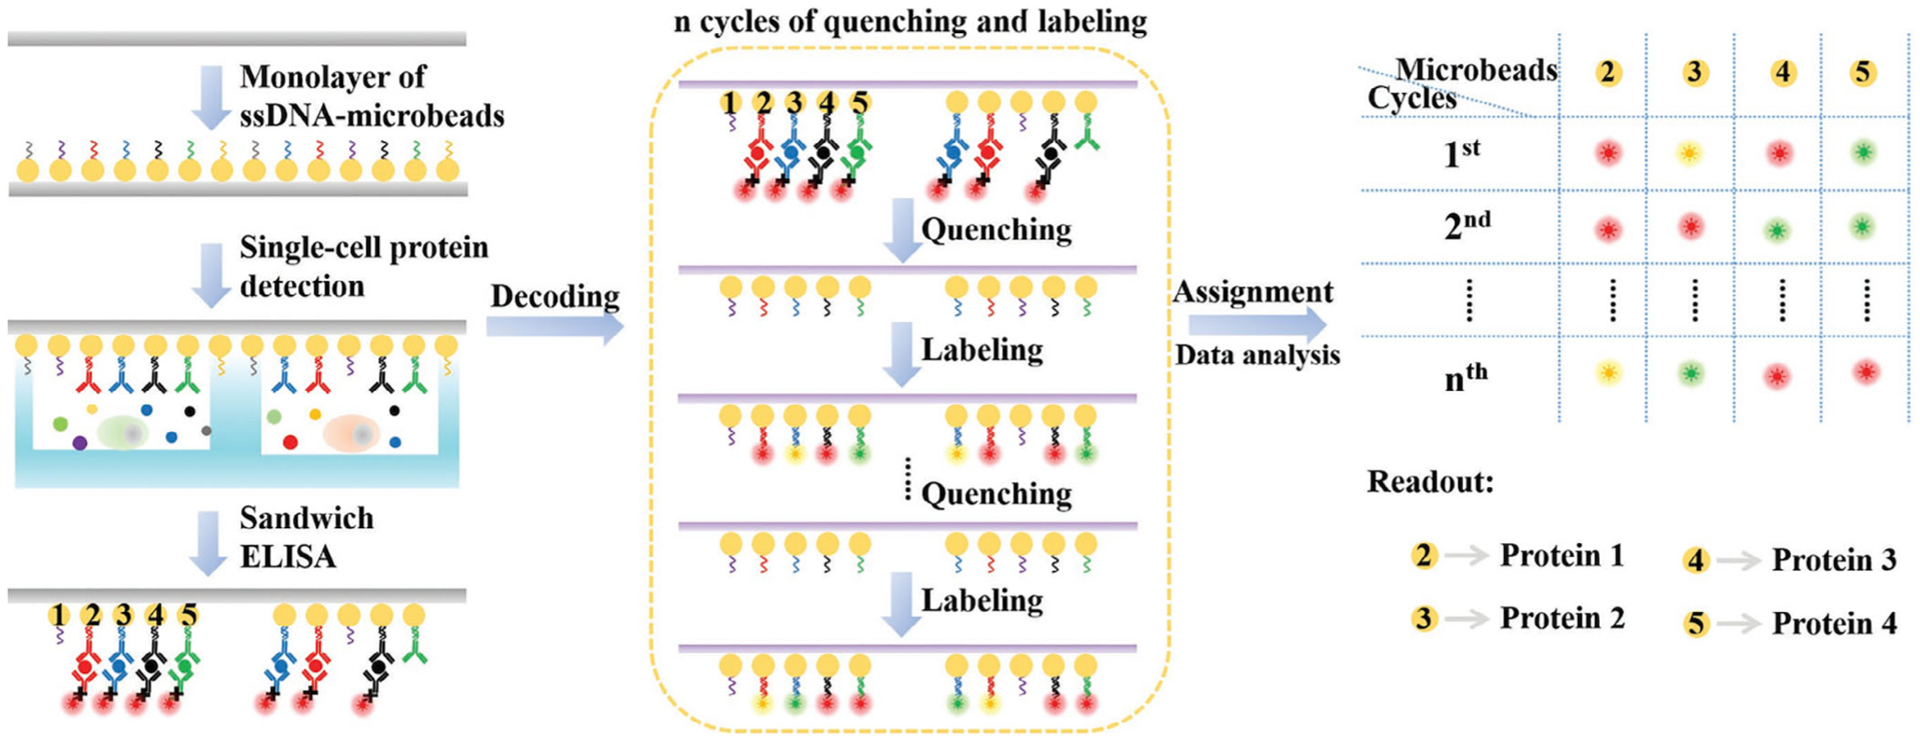
Schematic procedure for multiplexed single cell protein detection on MIST array. The secreted proteins from single cells are captured by antibodies immobilized on microbeads and detected by ELISA assay. Each microbead and the corresponding protein target are identified by the unique identification code generated by reiterative cycles of bead labeling and signal removal (Reprinted with permission from Zhao et al. (2018). Copyright 2018 WILEY-VCH Verlag GmbH & Co. KGaA, Weinheim)
2.3 |. Antibody barcoding with cleavable DNA
In order to improve the multiplexing capacity of the single-cell proteomic technologies, antibody barcoding with cleavable DNA (ABCD) was developed (Agasti, Liong, Peterson, Lee, & Weissleder, 2012; Ullal et al., 2014). In this method, each protein target is stained with an antibody linked with a unique DNA barcode via a photocleavable linker (Figure 3). Following antibody incubation, cells are exposed to UV light to cleave the linker. The released DNA barcodes are quantified by fluorescence hybridization on a chip. The generated fluorescence signals are then translated to protein abundances. This ABCD approach has the highest multiplexing capability among all the current single-cell proteomic technologies. Nevertheless, this method is limited by its low sample throughput, as the DNA barcodes released from each cell have to be analyzed on one hybridization chip. To overcome this limitation, CITE-seq was developed (Stoeckius et al., 2017). This approach allows thousands of cells to be analyzed simultaneously by encapsulating every antibody stained cell into a nanoliter-sized water droplet. Subsequently, the cleaved DNA barcodes released from each cell are amplified within the water droplet and provided with a unique cell barcode. Finally, all the amplified barcodes are combined and sequenced together. In this way, the sample throughput of the ABCD technology can be increased to thousands of cells. However, some aspects of the assay could make it difficult to precisely quantify low-expression proteins, such as the nonspecific binding between DNA barcodes and endogenous cellular molecules, the cross hybridization between different DNA barcodes, and the sequence-dependent bias introduced during barcode amplification.
FIGURE 3.
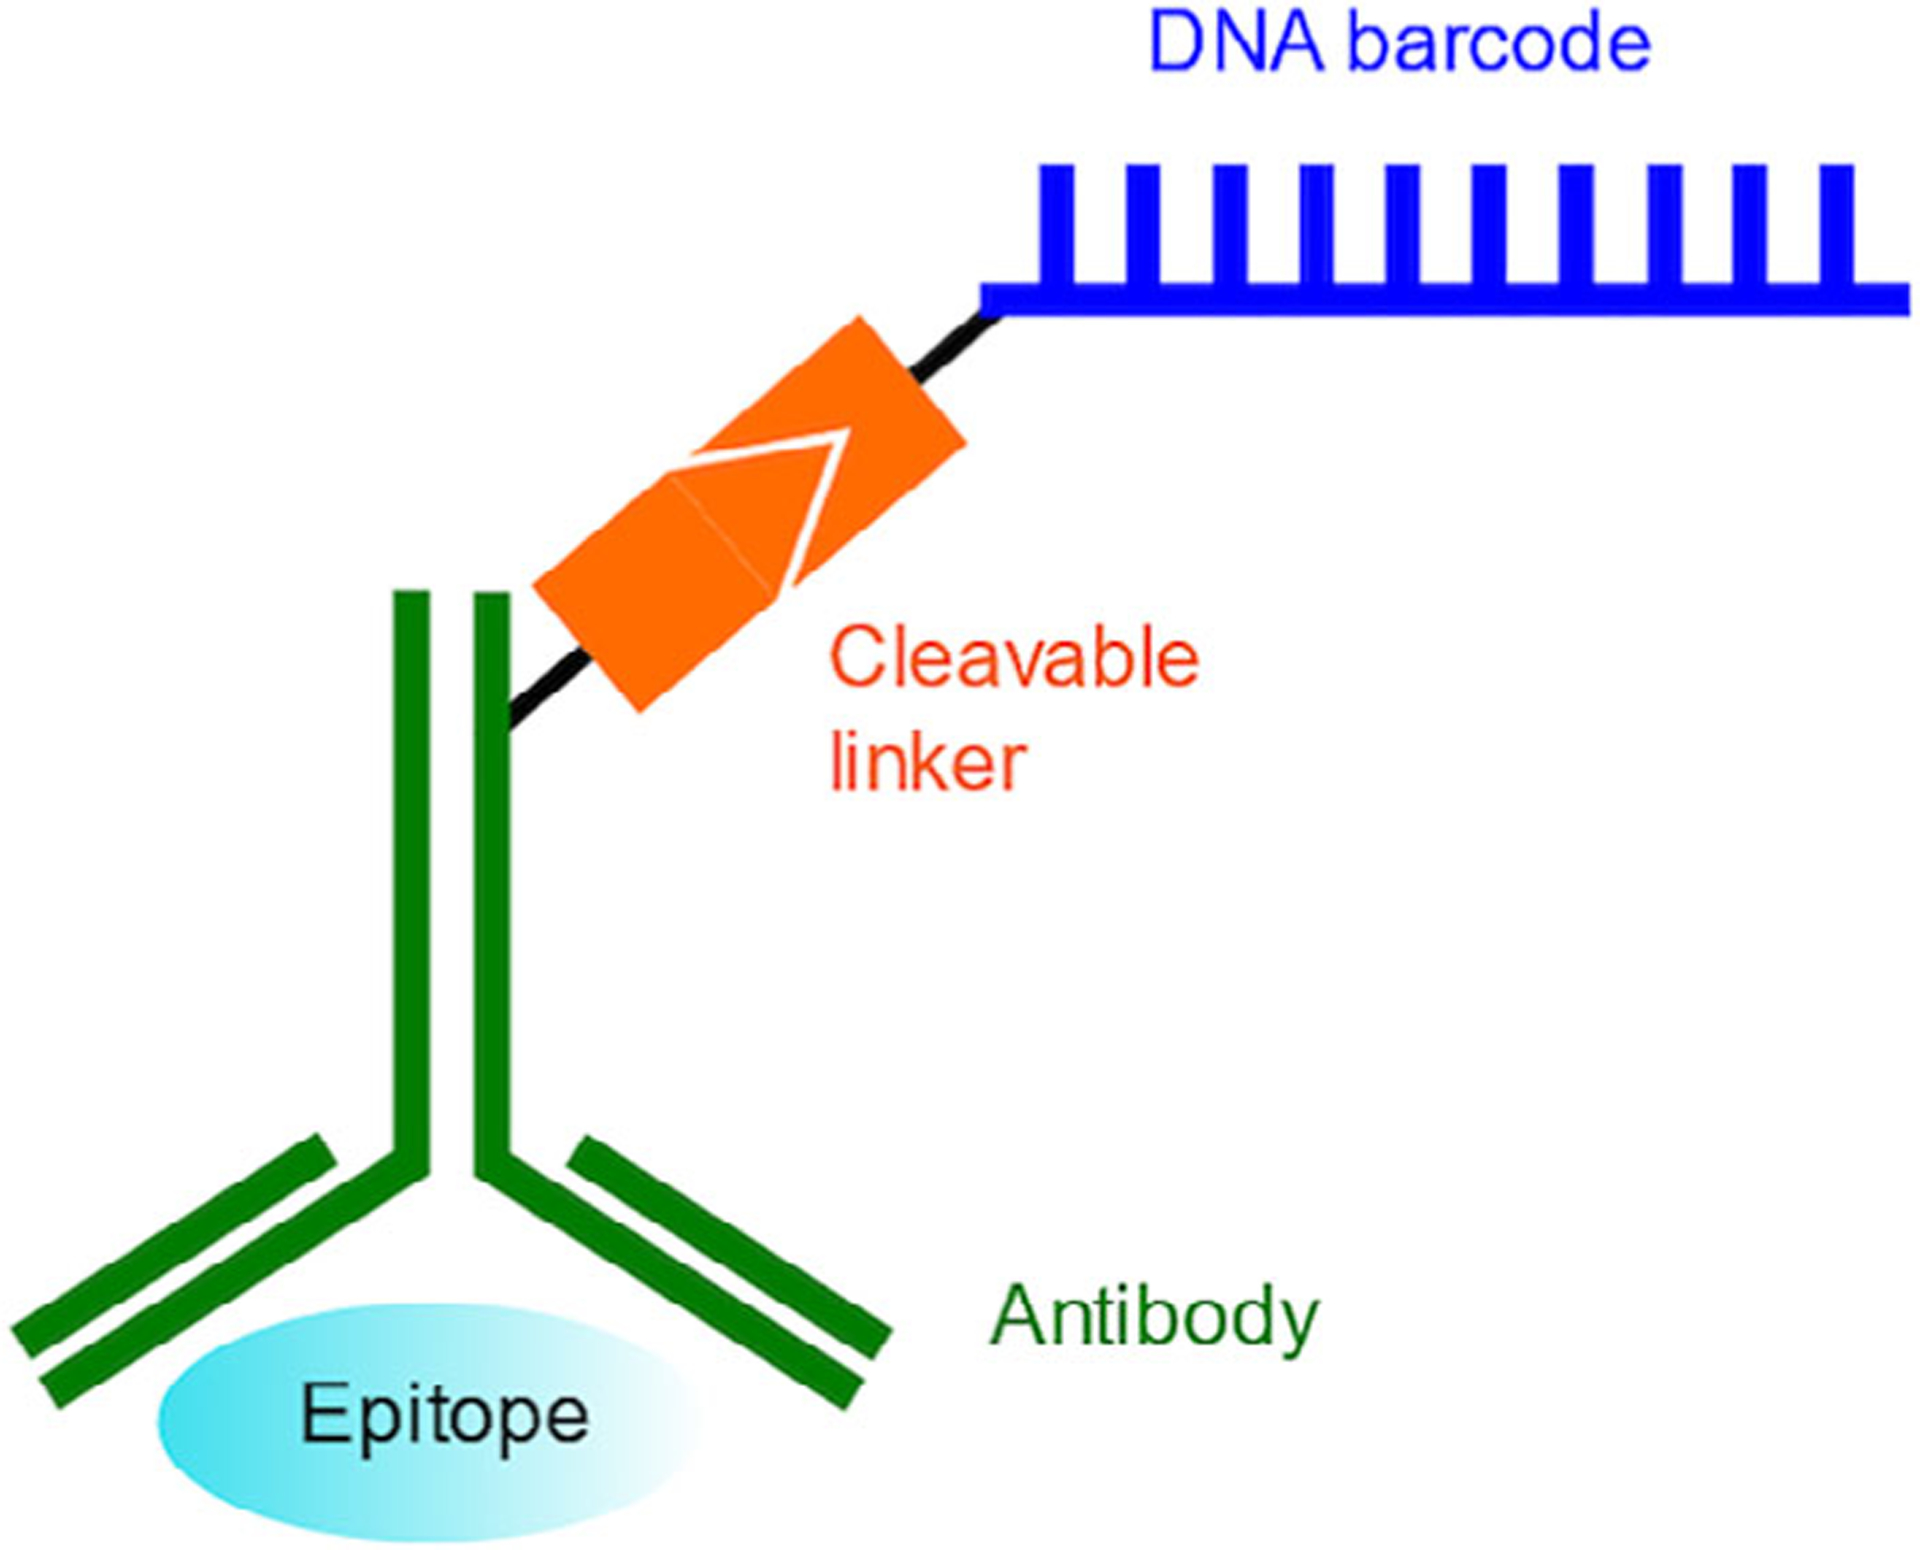
Illustration of the cleavable DNA barcoded antibody
2.4 |. Mass cytometry
To allow single-cell proteomic analysis in a large population of cells, mass cytometry was developed (Bendall et al., 2011; Bendall & Nolan, 2012). In this method (Figure 4), the protein targets in single cells are stained with antibodies conjugated to different metal isotopes. After sprayed as single droplets, individual cells are transported into plasma by the flow of argon gas, and subsequently vaporized, atomized, and ionized. The generated ions from each cell are then quantified by a time of flight mass spectrometer. The signals for each metal isotope are integrated, calibrated, and translated into the expression levels of protein targets in single cells. With an approximately a thousand cells analyzed per second, mass cytometry has the highest sample throughput among all the current single-cell proteomic assays. Additionally, mass cytometry enables over 40 varied proteins to be profiled in millions of individual cells in a given sample, which is critically required for the thorough characterization of the rare but functionally important cell types in a complex biological system. Moreover, except for protein analysis, mass cytometry can also be applied for the study of posttranslational modification, proteolysis products, RNA transcripts, DNA synthesis, hypoxia states and enzymatic activity, and so on (Spitzer & Nolan, 2016). Because of its high sample throughput and multiplexing capacity, along with its ability to characterize the various molecular states in the cells, mass cytometry is one of the most widely adopted single-cell proteomic technologies. Despite its advantages, the method still suffers from some limitations. For instance, some ionized metals can form oxide in the plasma, resulting in an interfering increased mass (M + 16) for the accurate data analysis. Also, the enriched metal isotopes usually contain 1% of impurities, which could create confusing background signals. Finally, only 30–40% of the injected cells are quantified by mass cytometry. As a result, protein expression profiles from important but rare cells could be missed.
FIGURE 4.
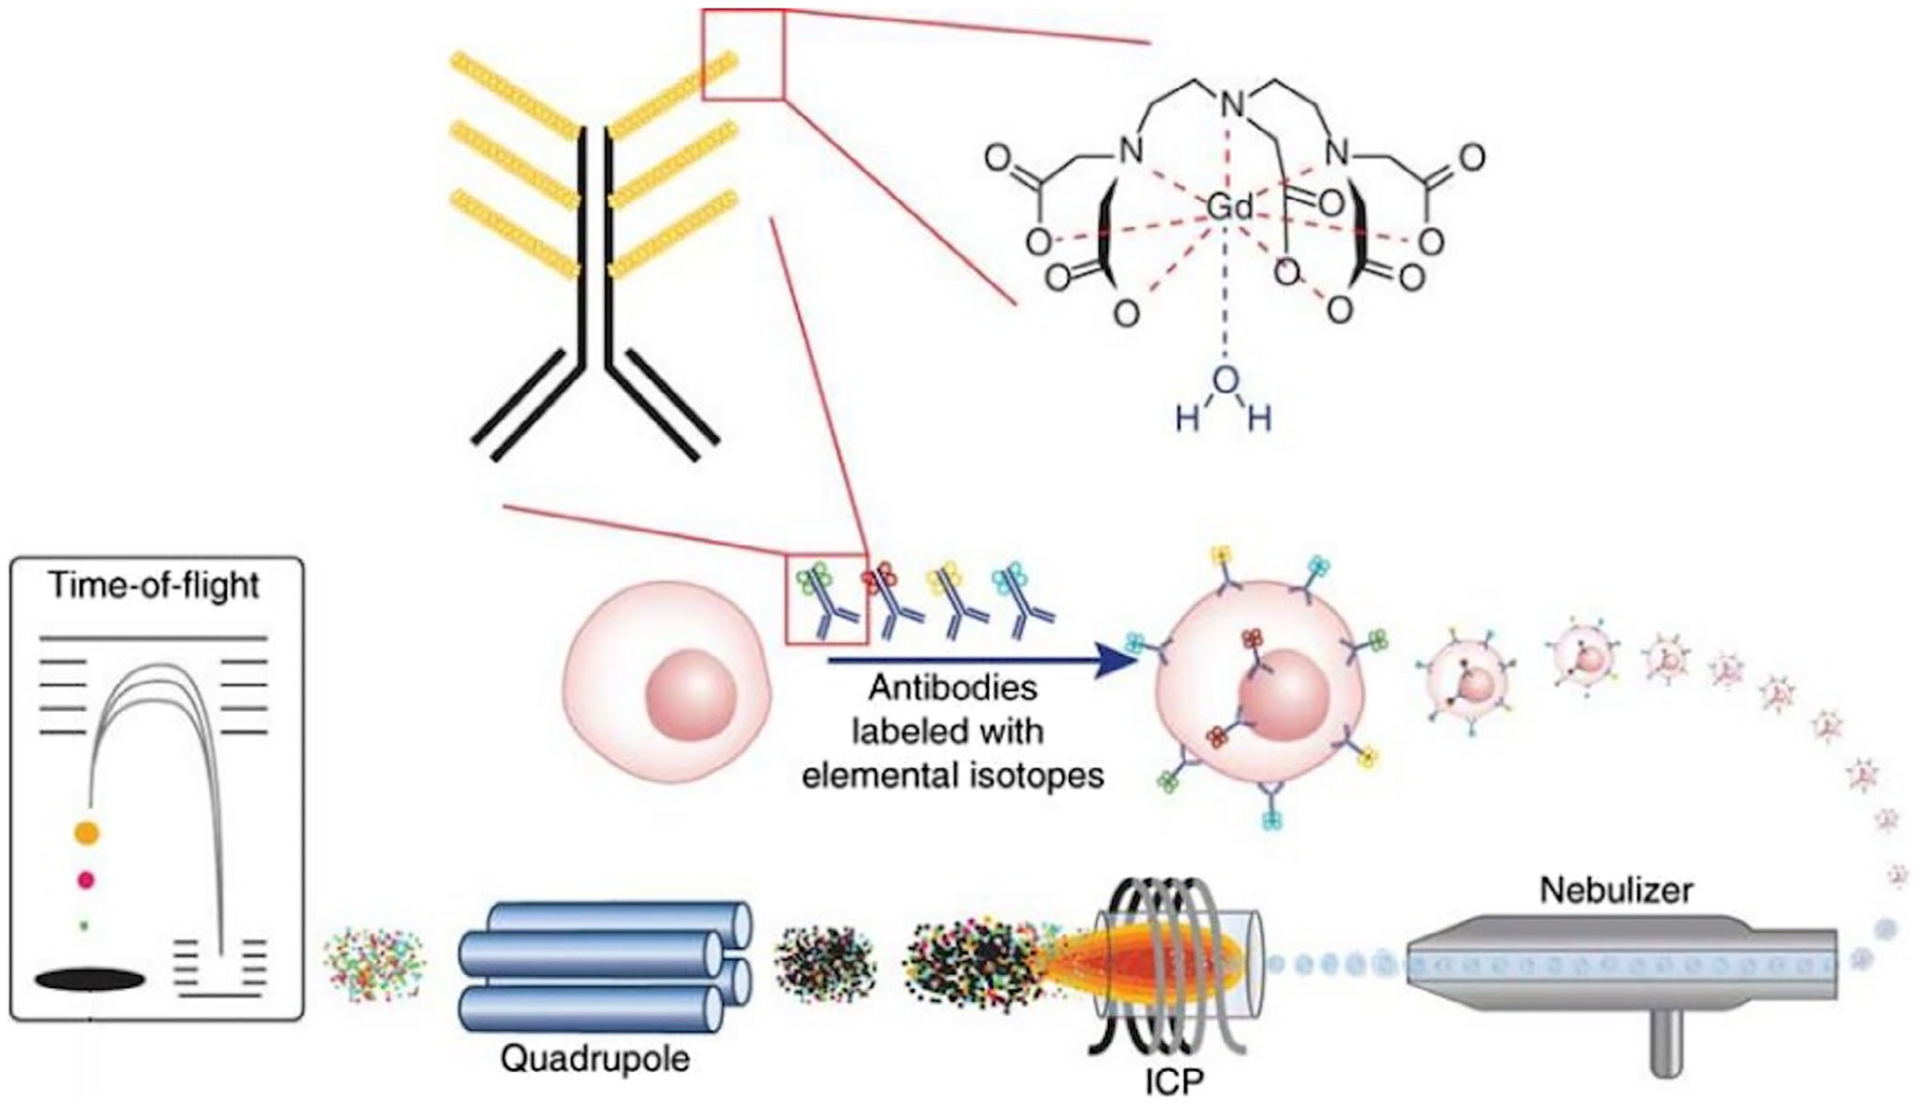
Workflow of mass cytometry. Antibodies conjugated with varied metal isotopes are first applied to stain the protein targets. Subsequently, cells are nebulized into single-cell droplet, and passed through an inductively couple plasma (ICP) time-of-flight (TOF) mass spectrometer to obtain an elemental mass spectrum for every single cell (Reprinted with permission from Bendall and Nolan (2012). Copyright 2012 Nature Publishing Group)
2.5 |. Single-cell Western blots
In most of the single-cell proteomic assays, the protein targets are detected by antibodies. However, the nonspecific binding and cross-reactivity of antibodies can generate false positive signals and restrict the analysis accuracy. To overcome these limitations, the Herr groups developed single-cell Western blots (scWesterns) (Hughes et al., 2014) (Figure 5). The scWesterns array allows more than 6,000 cells to be simultaneously on a microscopic slide. Each cell is settled to a microwell and lysed with a denaturing buffer. Subsequently, the proteins are separated by polyacrylamide gel electrophoresis, based on their different molecular mass. Afterwards, UV light is used to immobilize the separated proteins on the benzophenone-containing gel. Finally, target proteins are labeled with fluorescent antibodies. As proteins are covalently linked to the gel, antibodies can be stripped using a strong denaturing buffer. By repeating cycles of the protein labeling and antibody stripping, a large number of different proteins can be quantified. In comparison to other approaches, scWesterns eliminate the false positive signals generated by antibody cross-reactivity and nonspecific binding, as the proteins are separated by their mass before antibody labeling. As a result, the on-target and off-target signals can easily be distinguished. Recently, isoelectric focusing assay was integrated with scWestern (Tentori, Yamauchi, & Herr, 2016), which enables the differentiation of protein isoforms differing by a single charge unit. Despite its excellent protein separation efficiency, scWesterns may suffer from the limited detection sensitivity, as ~40, ~72, and up to 50% of the proteins are lost during cell-lysing, protein immobilization and antibody stripping, respectively.
FIGURE 5.
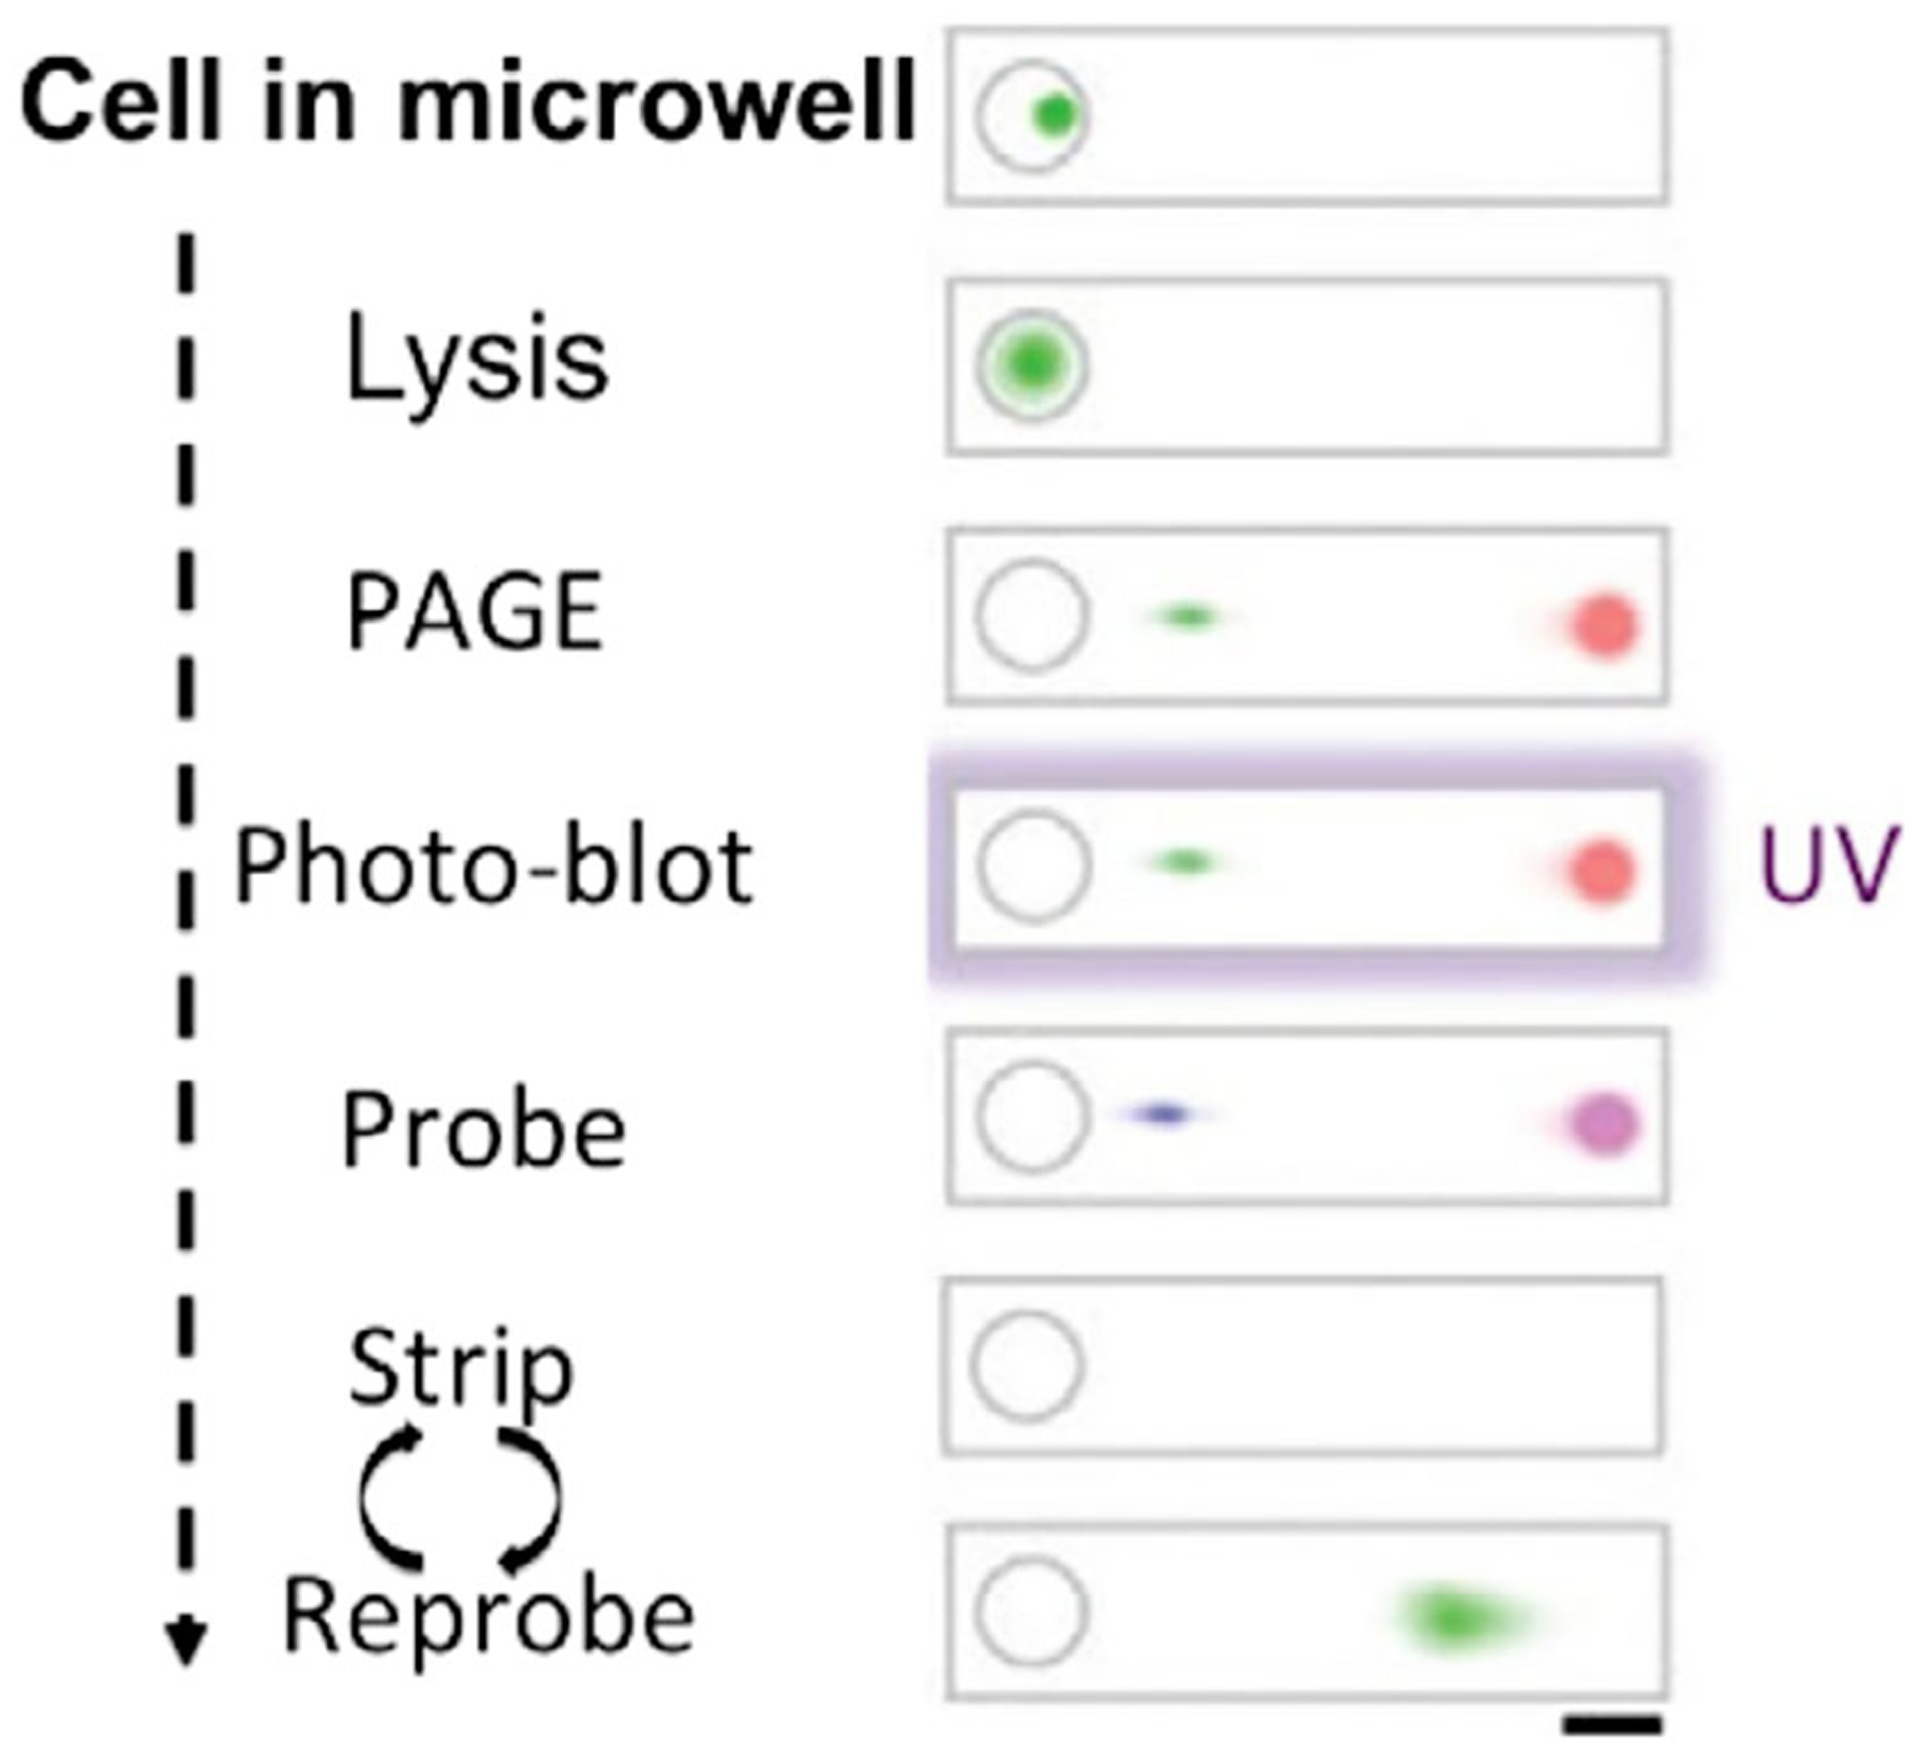
Workflow of single-cell Western blots. The process begins as individual cells are settled and lysed in the microwell, followed with single-cell PAGE, immobilization of proteins onto the gel by UV, and in-gel probing with fluorescent antibodies. Through reiterative cycles of antibody removal and protein relabeling, comprehensive protein analysis can be achieved in single cells (Reprinted with permission from Sinkala et al. (2017). Copyright 2017 Nature Publishing Group)
3 |. SINGLE CELL IN SITU PROTEOMIC TECHNOLOGY
Biological systems are complex organizations, in which individual components have their own well-defined spatial distributions. The precise locations of cells in a tissue and biomolecules in a cell can be crucial for the organization, regulation, and function of the biological systems. For instance, to develop and maintain the polarized neuronal structures, the synthesis and trafficking of various RNAs and proteins are precisely regulated at the morphologically and functionally distinct compartments of individual neurons. Moreover, studies have shown that disease-specific genes can mislocate in breast cancer (Meaburn, Gudla, Khan, Lockett, & Misteli, 2009) and the fates of stem cells can be determined by their positions in the niche (Rompolas, Mesa, & Greco, 2013). Therefore, to better understand the regulation of these complex biological systems and their malfunction in disease, comprehensive protein profiling in their natural spatial contexts is in critical need. In this section, we will present the recently developed single cell in situ proteomics technologies. Their unique advantages and current challenges will also be discussed.
3.1 |. Imaging mass cytometry and ion beam imaging
Recently, imaging mass cytometry (Giesen et al., 2014) and ion beam imaging (Angelo et al., 2014) have been developed for in situ proteomic analysis of single cells. Both approaches use antibodies carrying metal-isotope to recognize their protein targets (Figure 6). Subsequently, the specimen is converted to a stream of particles pixel-to-pixel by a laser or ion beam. The compositions and abundances of the metal isotopes in each particle are determined by a mass spectrometer. Once collected, the mass data of each pixel and its coordination information in the specimen are combined to generate a two-dimensional image using computational algorithm. These methods allow the simultaneous staining of a large number of proteins using various metal isotope conjugated antibodies. Therefore, the gradual epitope degradation during the assay is minimized. Moreover, as the selected metal isotopes do not exist in the biological samples, these methods also avoid the background signals generated by the endogenous biomolecules in the specimen. Nonetheless, the current versions of these methods suffer from low sample throughput and long assay time. For example, to image a 1 mm2 tissue can take them 8 hr (Angelo et al., 2014; Giesen et al., 2014). Additionally, the instrument availability is also a challenge, as these specialized imaging mass spectrometers are quite expensive, which can hinder its applications in clinical settings.
FIGURE 6.
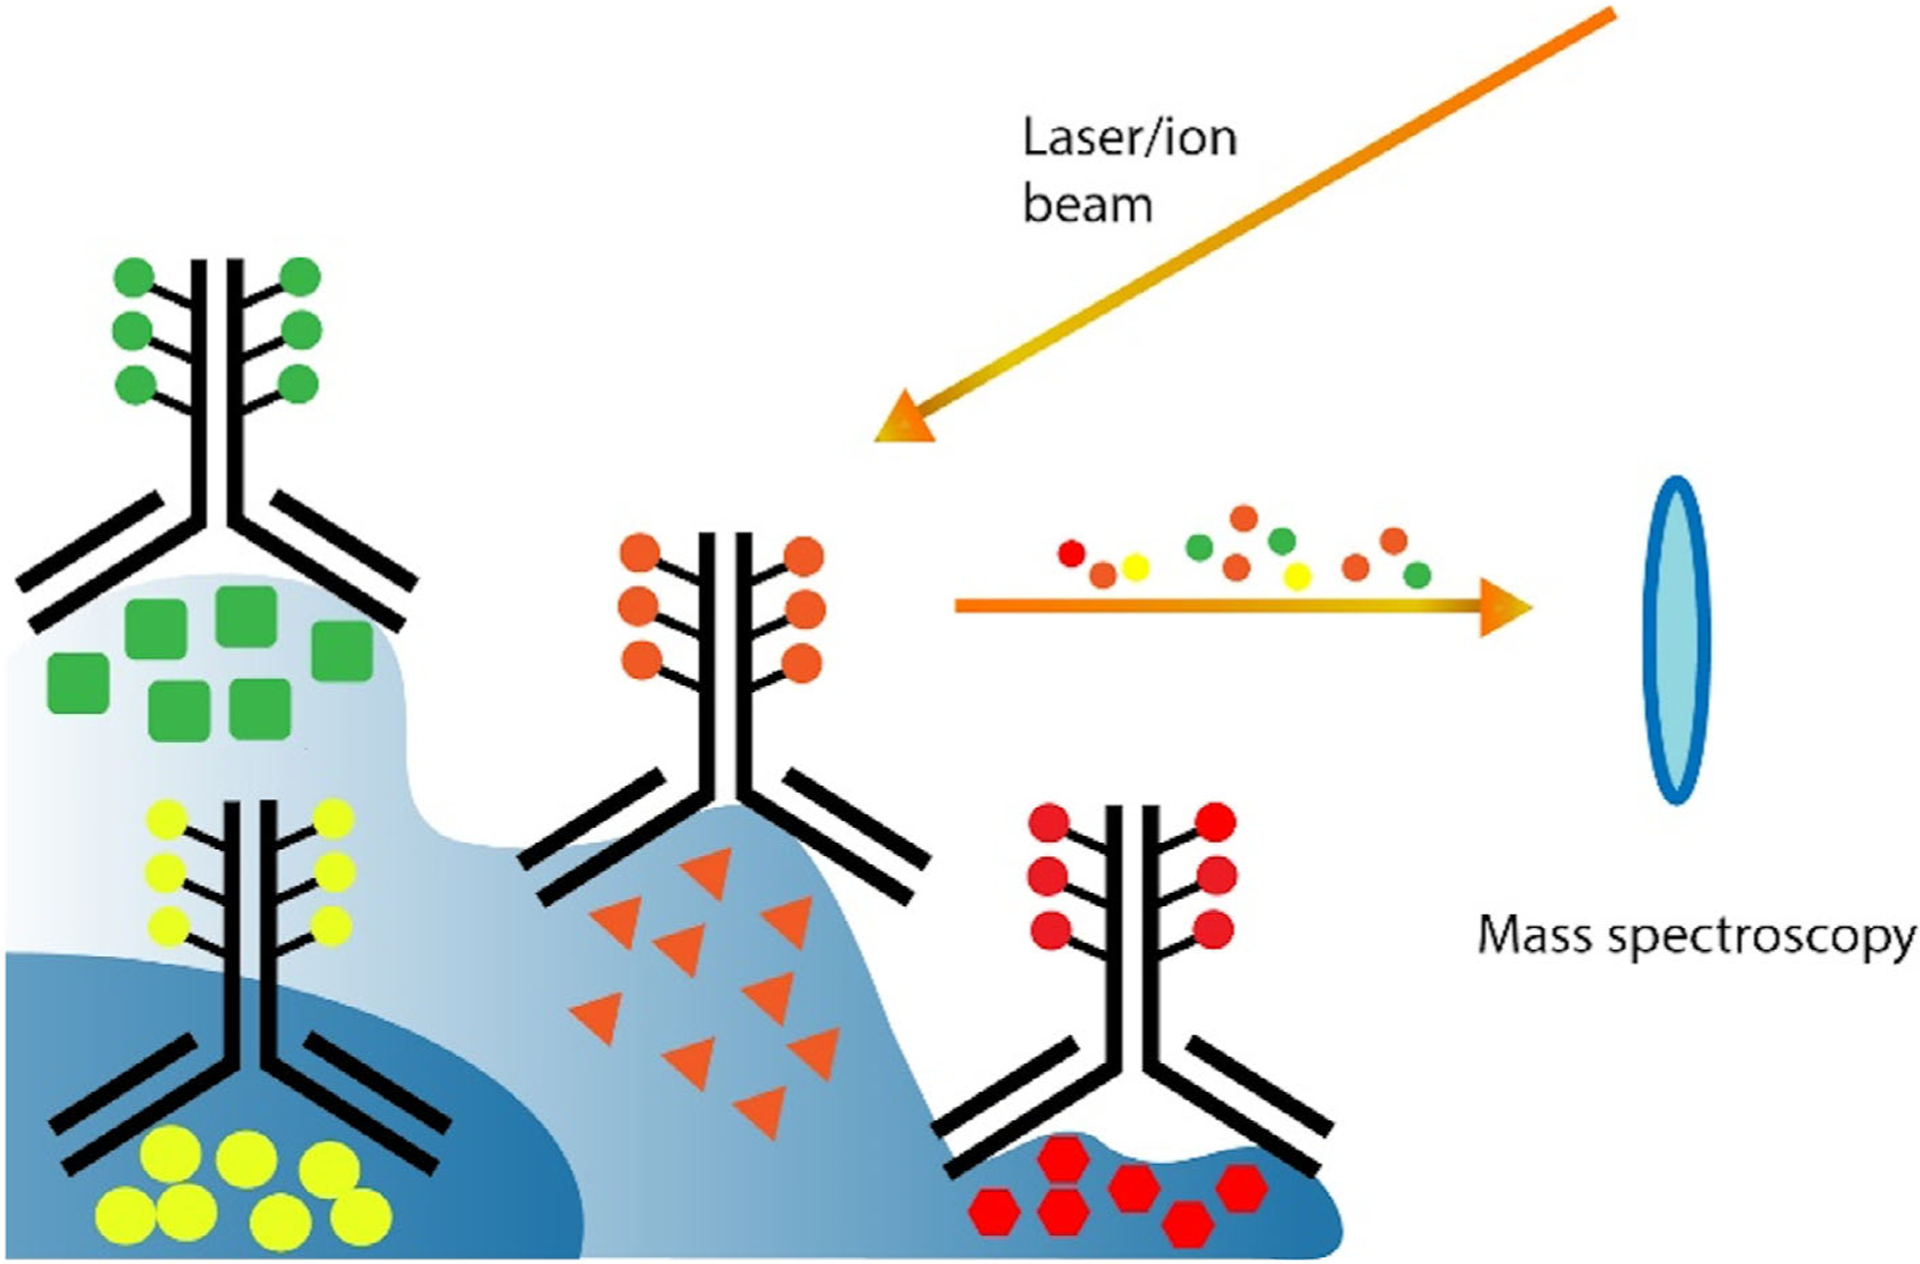
Imaging mass cytometry and ion beam imaging. Tissues are stained with a mixture of metal isotope labeled antibodies. Then, a laser or ion beam is applied to transfer the specimen pixel-by-pixel into a mass spectrometer. The mass data of the identified metal isotopes are translated into protein abundances with computer software
3.2 |. Reiterative immunofluorescence
To address the issues of low sample throughput and also to avoid the specialized and expensive instrument, reiterative immunofluorescence has been developed. This approach is composed of three major steps. First, antibodies conjugated with different fluorophores are used to stain their corresponding protein targets in the specimen. Second, the specimen is imaged in different fluorescence channels to quantify the abundances of the protein targets in their original cellular locations. Finally, the staining signals are erased before the start of the next immunofluorescence cycle. By repeating the three major steps of reiterative immunofluorescence, a large number of different proteins can be profiled in individual cells at the optical resolution. If A is the number of the sequential staining cycles and B is the number of the varied fluorescent channels, a total of A × B protein targets will be analyzed in the same specimen. As a large imaging area consisting of millions of pixels can be captured within milliseconds to seconds, to profile 40 proteins in a common 1 cm2 tissue takes about 80–120 hr by most of the reiterative immunofluorescence technologies. In contrast, to examine the same tissue area, more than 800 hr is required by imaging mass cytometry or ion beam imaging. With shorter assay time, reiterative immunofluorescence enables a larger number of cells to be profiled in a given sample, which facilitates the study of rare but important cells in a complex biological system. Moreover, reiterative immunofluorescence only requires a common fluorescent microscope as the instrument, which makes this approach widely applicable in different research and clinical laboratories.
To accurately profile multiple proteins by reiterative immunofluorescence, two requirements exist in the signal removal step. First, signals from the previous cycle must be eliminated efficiently, so that any signal leftover will not interfere with the protein analysis in the following cycles. Additionally, the integrity of the protein epitopes must be maintained during this signal removal step to ensure other proteins can be accurately profiled afterwards. To fulfill these two requirements, photobleaching (Figure 7a) was explored to erase the staining signals sequentially in each fluorescence channel (Schubert et al., 2006). Although this approach has been successfully applied for multiplexed protein profiling in cells and tissues, some non-ideal factors still exist. For example, as the fluorophores in the whole specimen have to be bleached area-by-area and fluorophore-by-fluorophore, this method is limited by low sample throughput. To overcome this limitation, chemical bleaching using H2O2 in either basic or acidic solution was investigated (Gerdes et al., 2013; Lin, Fallahi-Sichani, & Sorger, 2015). With this approach, it has been documented that the fluorescence signals in the entire sample can be eliminated in less than an hour. Recently, antibody stripping (Figure 7b) was also explored (Micheva, Busse, Weiler, O’Rourke, & Smith, 2010; Micheva & Smith, 2007; Zrazhevskiy & Gao, 2013). In this method, antibody is eluted from the stained specimen by a high or low pH solution containing sodium dodecyl sulfate. Despite their fast signal removal processes, chemical bleaching and antibody stripping suffer from the limited multiplexing capacity, as the harsh chemical reagents used in these two approaches can damage the epitopes and degrade the specimen.
FIGURE 7.
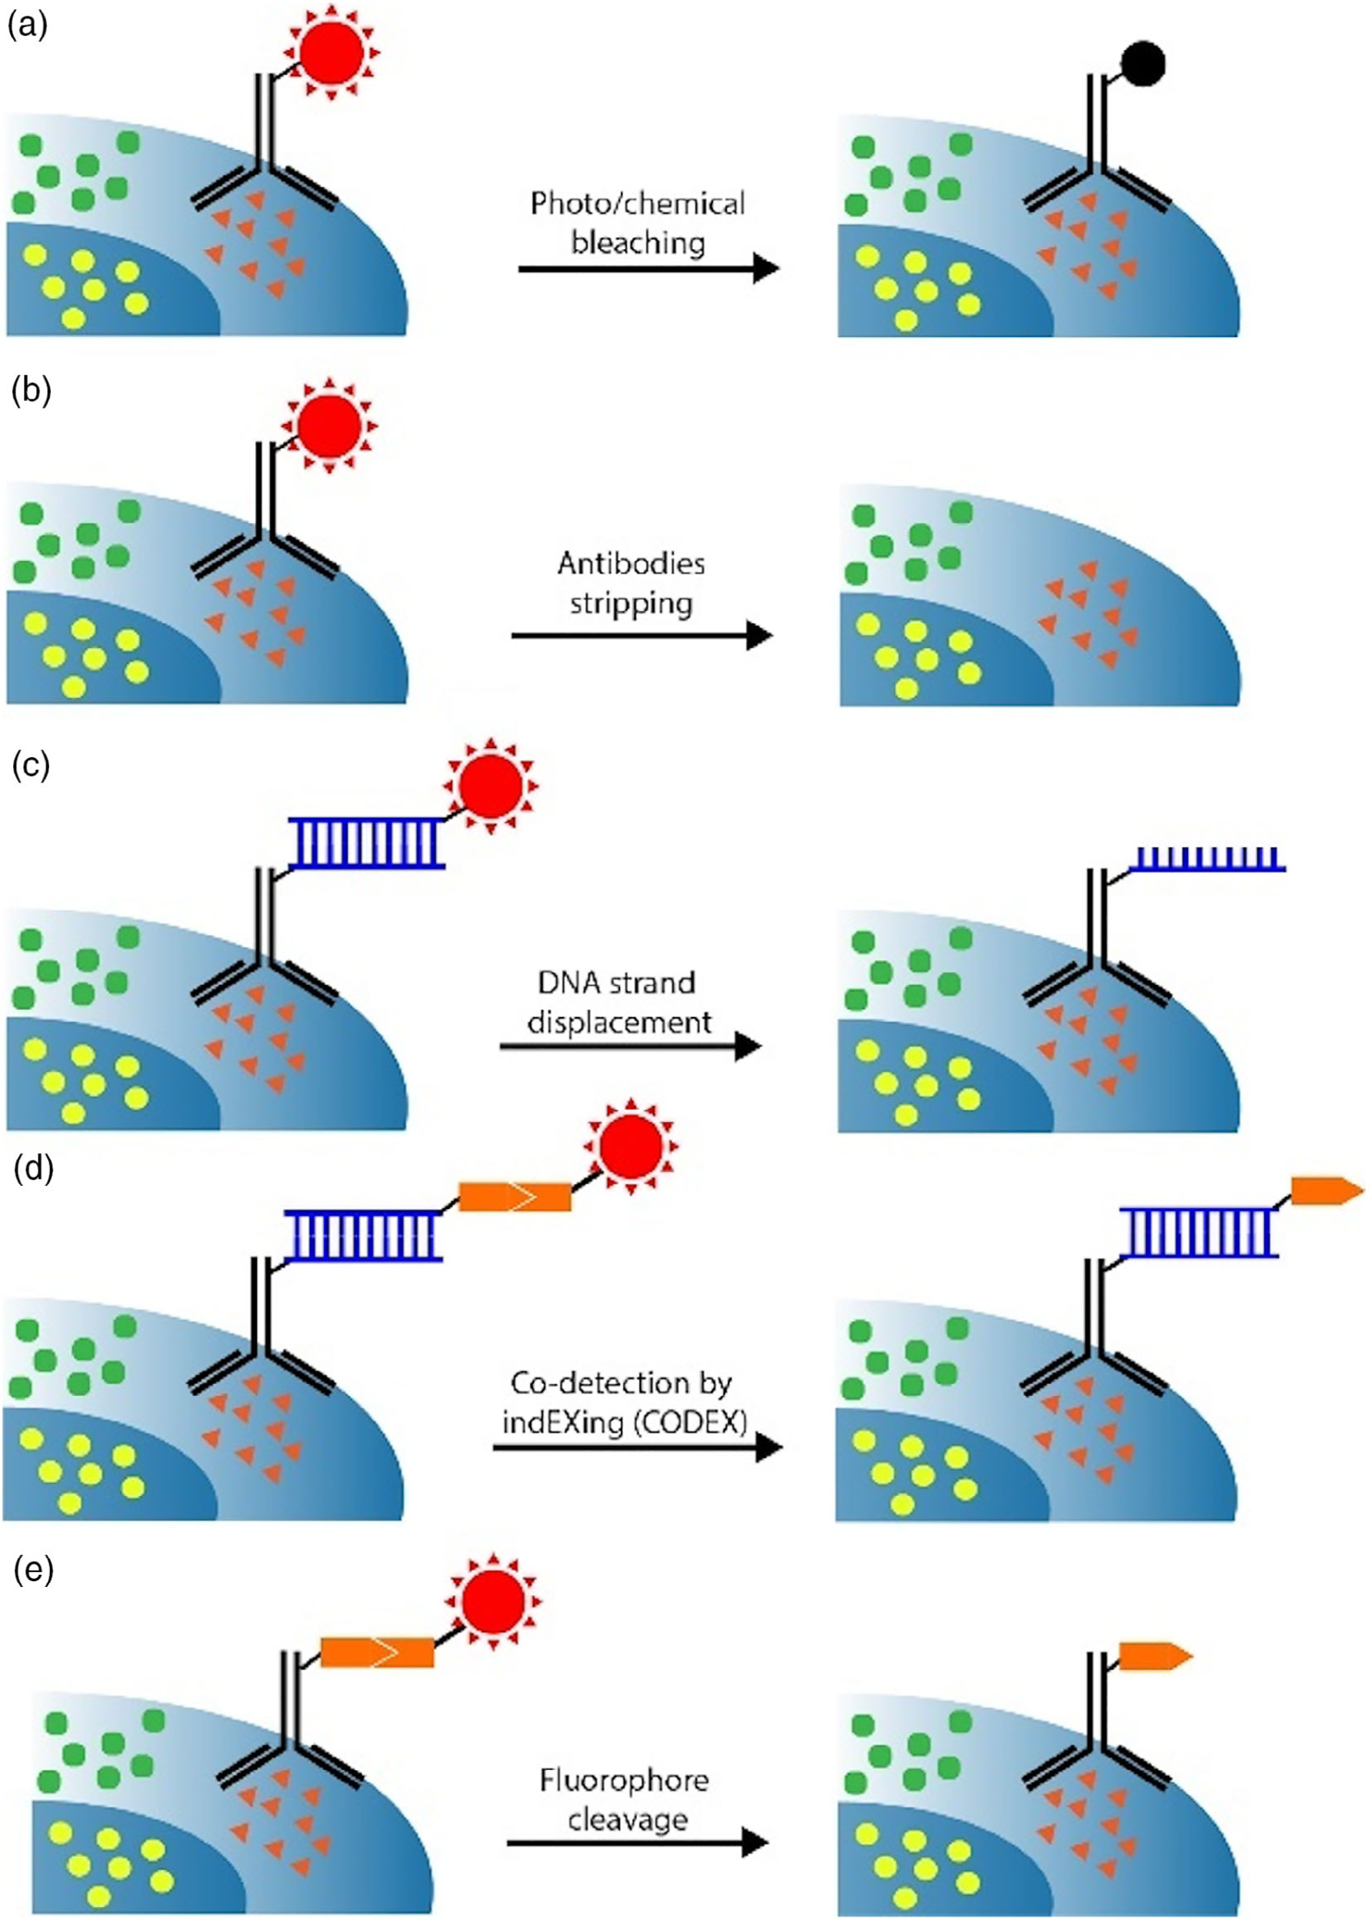
Approaches to erase fluorescence signals in reiterative immunofluorescence. (a) Fluorescence signals are eliminated using photobleaching or chemical bleaching. (b) Stripping solution is applied to elute antibodies from their protein targets. (c) The fluorescent oligonucleotides hybridized to oligonucleotide-conjugated antibodies are removed with DNA strand displacement reactions. (d) In the CO-Detection by indEXing (CODEX) approach, the fluorophores introduced by incorporation of the cleavable fluorescent nucleotide is removed by chemical cleavage of the linker to release the fluorophores from the incorporated nucleotides. (e) The signals generated by cleavable fluorescent antibodies are erased by chemical cleavage of the linker to release the fluorophores from antibodies
To efficiently remove the staining signals while maintaining the integrity of the protein epitopes, DNA strands displacement reactions have been explored (Duose et al., 2012; Duose, Schweller, Hittelman, & Diehl, 2010; Schweller et al., 2012) (Figure 7c). In this approach, protein targets are recognized by antibodies conjugated to oligonucleotides, which subsequently recruit complementary fluorescent oligonucleotides via DNA hybridization. Following imaging, the staining signals are erased by removing the fluorescent oligonucleotides by DNA displacement reactions. Although it has been demonstrated that at least two analysis cycles can be carried out with this approach, it suffers from the low multiplexing capability, due to the mishybridization between oligonucleotides on different antibodies and also the nonspecific binding between oligonucleotides and the endogenous biomolecules in the cell. To overcome this limitation, Giedt et al. (2018) applied antibody DNA barcode prehybridized with a fluorescent oligonucleotide to stain the protein targets. After removing the fluorescent DNA strands, the DNA barcodes are capped with the nonfluorescent complimentary DNA strands to reduce the cycle-to-cycle background.
In 2018, Goltsev et al. (2018) developed an alternative approach to eliminate fluorescence signals on oligonucleotide conjugated antibodies. In this CO-Detection by indEXing approach (Figure 7d), nucleotides tethered to fluorophores through a disulfide bond are used to extend the primers hybridized to oligonucleotide conjugated antibodies. After imaging, the fluorophores are chemically cleaved using tris(2-carboxyethyl)phosphine (TCEP) to allow the initiation of the next fluorescent nucleotide incorporation cycle. With the high-yield and mild chemical cleavage reaction, this approach allows the staining signals to be efficiently eliminated while maintaining the integrity of biomolecules. However, the endogenous cellular thiol groups and the thiol groups generated by cleavage could react with the disulfide bonds in the fluorescent nucleotides, leading to background signals. Moreover, as not all the four nucleotides are applied together in the primer extension reaction, the mis-incorporation rate can be high to generate false positive signals. Additionally, as the incorporation efficiency is less than 100%, primers on the same antibody can be extended to different lengths, which makes the analysis less quantitative.
Although some success has been achieved with oligonucleotide conjugated antibodies, the bulky and negatively charged oligonucleotides can interfere with the binding affinity and specificity of the conjugated antibodies. To address this issue, cleavable fluorescent antibodies (Figure 7e) were developed in 2017. In this approach, fluorophores are attached to antibodies directly via a chemically cleavable linker featuring an azido group (Mondal, Liao, Xiao, Eno, & Guo, 2017). Following target staining, the fluorophores are efficiently cleaved by TCEP within 30 min. Compared with the large negatively charged oligonucleotides, the chemically cleavable linker is neutral and has extremely small size. Thus, cleavable fluorescent antibodies maintain the binding affinity and specificity of conventional fluorescent antibodies. Furthermore, as the azido group does not react with endogenous biomolecules and the later analysis cycles are independent of the previous cycles, this approach is more quantitative and precise.
3.3 |. Cleavable fluorescent streptavidin
In the in situ proteomics methods discussed above, each antibody molecule is only labeled with a couple of fluorophores or metal-isotopes for protein staining. Without signal amplification, the detection sensitivity of these approaches is relatively low, which limits their applications to quantify low-expression proteins. Additionally, due to their weak sensitivity, long imaging exposure time has to be used in these assays, resulting in low sample throughput and long assay time. To address these issues, a layer-by-layer signal amplification approach using cleavable fluorescent streptavidin (CFS) has been developed (Liao et al., 2020). In each cycle of this approach (Figure 8), the specimen is first incubated with cleavable biotin conjugated primary antibodies. Then, CFS is applied to stain the protein targets. Subsequently, the CFS is bound by a cleavable biotin labeled orthogonal antibody or protein, which does not bind to the primary antibodies or any specific molecules in the specimen. To achieve the desired signal intensity, a layer-by-layer signal amplification approach using CFS and the cleavable biotin labeled orthogonal antibody can be applied. Following image capture, the fluorophores and the biotins unbound to streptavidin are simultaneously cleaved by a chemical reaction, which does not damage the epitopes on other protein targets. Finally, the leftover streptavidin is blocked by biotin to initiate the next cycle. With continuous cycles of target recognition, signal amplification, fluorescence imaging, chemical cleavage, and streptavidin blocking, highly sensitive in situ proteomics analysis can be achieved. By enhancing the detection sensitivity by at least one order of magnitude, this approach enables the proteins with a wide range of expression levels to be quantitatively profiled in the same specimen.
FIGURE 8.
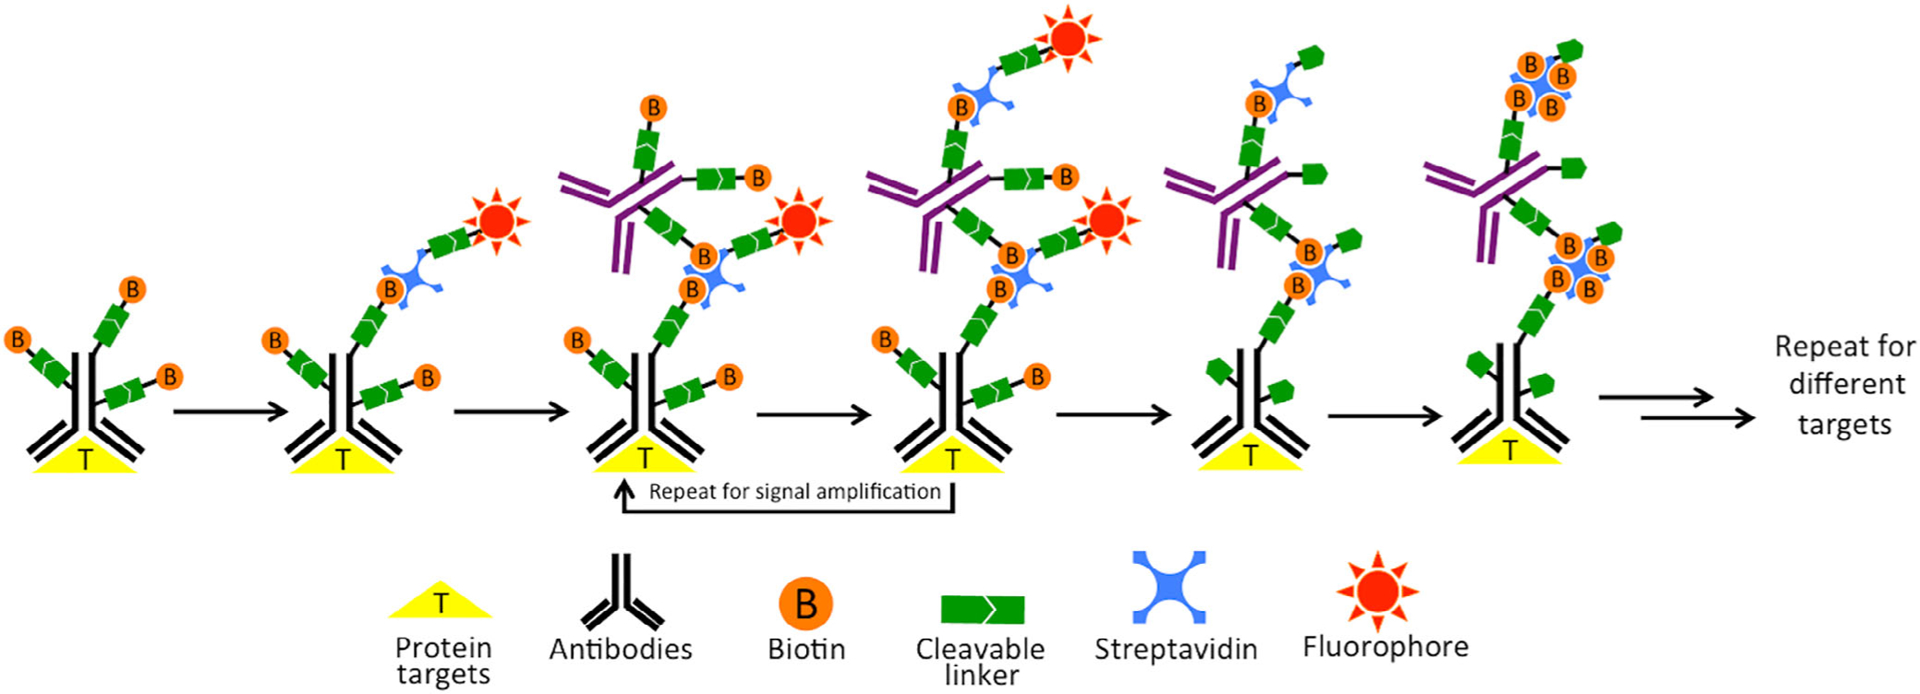
Highly sensitive in situ proteomics with cleavable fluorescent streptavidin (CFS). In each cycle, the protein target is first stained with cleavable biotin conjugated antibodies, and then labeled with CFS. The staining signal is amplified layer-by-layer using cleavable biotin conjugated orthogonal antibodies and CFS. After image capture, a chemical cleavage reaction is applied to remove fluorophores and the unbound biotins. Finally, the leftover streptavidin is blocked by biotin. Through reiterative analysis cycles, a large number of proteins can be quantified in situ with high sensitivity (Reprinted with permission from Liao et al. (2020). Copyright 2010 Multidisciplinary Digital Publishing Institute (MDPI))
3.4 |. Immuno-SABER
In 2019, another highly sensitive in situ proteomics approach was developed using immunostaining with signal amplification by exchange reaction (Immuno-SABER) (Saka et al., 2019). In this approach, the proteins targets are stained with their corresponding DNA-tagged antibodies, which are hybridized to DNA concatemers generated by primer exchange reaction (Figure 9). Subsequently, multiple fluorescent oligonucleotides are hybridized to the binding sites on the DNA concatemers, to stain the protein targets and amplify the signal. After imaging, the applied fluorescent oligonucleotides are dehybridized and then new fluorescent oligonucleotides are employed to stain other protein targets. Through reiterative cycles of dehybridization and hybridization, multiple protein targets can be sequentially imaged. By amplifying the signal with a large number of fluorescent oligonucleotides hybridized on one DNA concatemer, this approach enables the detection sensitivity to be enhanced by 180-folds.
FIGURE 9.
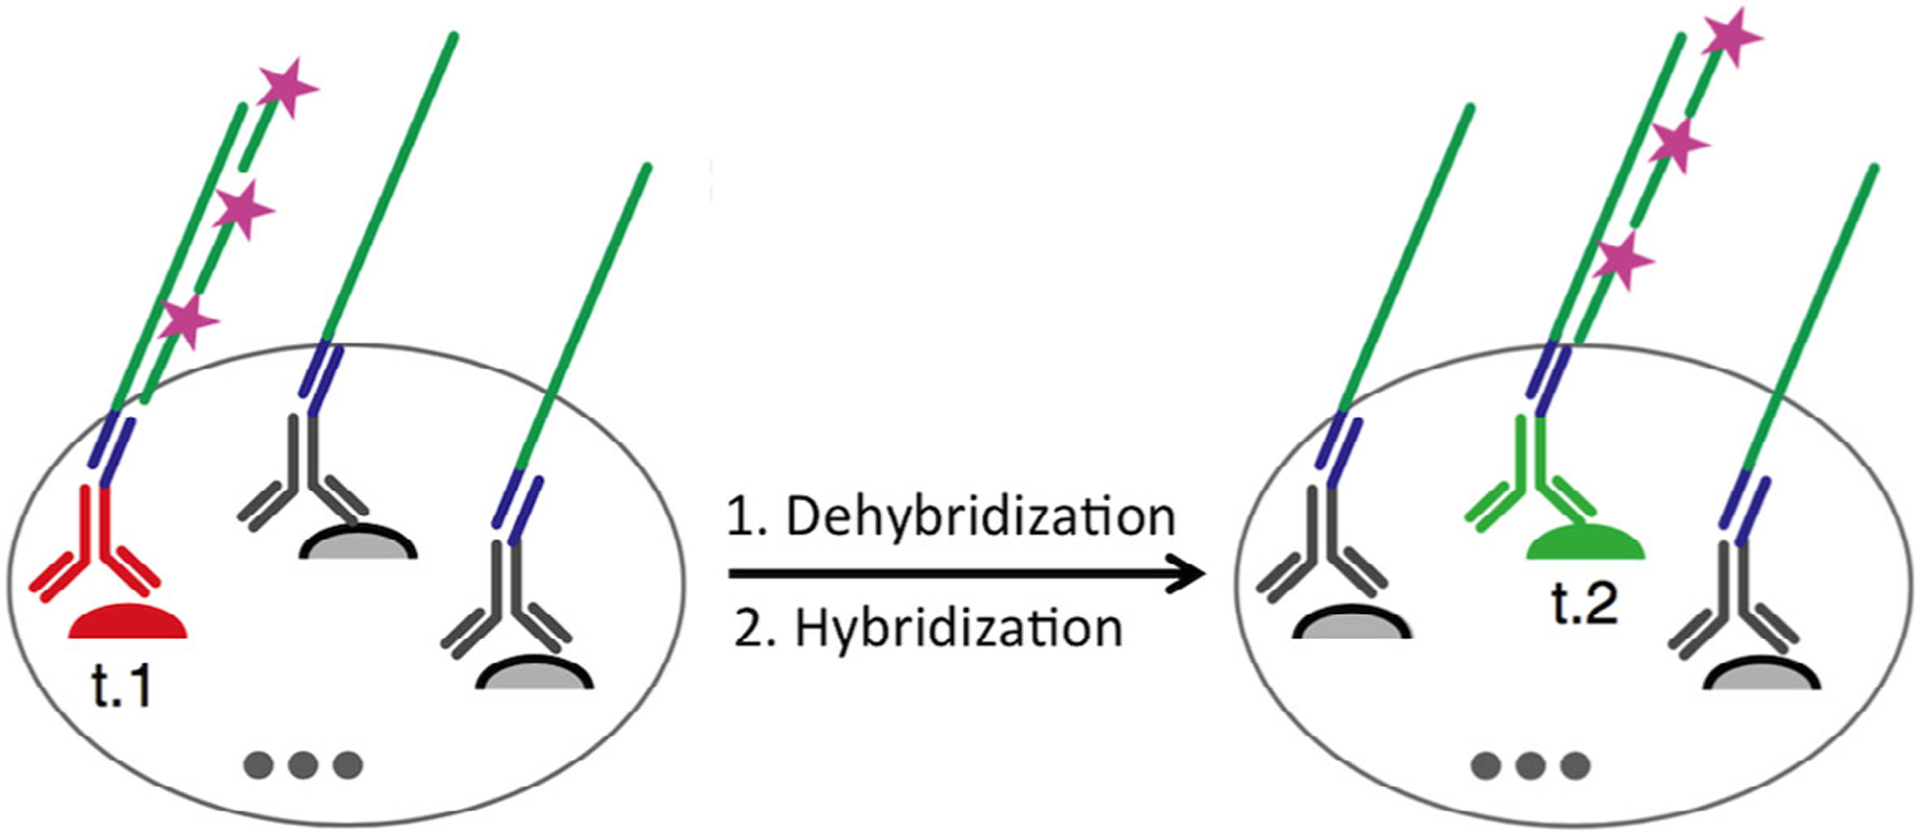
Highly sensitive in situ proteomics using immunostaining with signal amplification by exchange reaction (Immuno-SABER). The proteins of interest are recognized by DNA-tagged antibodies, which subsequently recruit DNA concatemers and a large number of fluorescent oligonucleotides. Through cycles of dehybridization and hybridization of the fluorescent oligonucleotides, highly sensitive multiplexed in situ protein profiling can be achieved (Reprinted with permission from Saka et al. (2019). Copyright 2019 Nature Publishing Group)
4 |. BIOLOGICAL APPLICATION
One of the exciting applications of single-cell proteomic technologies is to study cell heterogeneity of complicated biological systems. These technologies enable the quantification of the abundances of many different proteins in every individual cell in a heterogeneous cell population (Figure 10a). Analyzed by clustering algorithm (Amir et al., 2013; Jolliffe & Cadima, 2016; Van Der Maaten & Hinton, 2008), cells can be partitioned into different subgroups based on their unique protein expression patterns (Figure 10b). Utilizing this clustering algorithm, immune cells heterogeneity has been explored by mass cytometry (Newell, Sigal, Bendall, Nolan, & Davis, 2012) and SCBC (Lu et al., 2015; Ma et al., 2011), and cancer cell heterogeneity has been studied using scWestern (Sinkala et al., 2017), ABCD (Ullal et al., 2014) and mass cytometry (Irish et al., 2004; Levine et al., 2015). By allowing protein analysis in their natural spatial contexts, imaging mass cytometry (Giesen et al., 2014), ion beam imaging (Angelo et al., 2014), and reiterative immunofluorescence (Bhattacharya et al., 2010; Bode et al., 2008; Gerdes et al., 2013; Micheva et al., 2010; Micheva & Smith, 2007; Schubert et al., 2006; Schubert, Gieseler, Krusche, & Hillert, 2009; Sood et al., 2016) have been applied to understand the cell subtype compositions of intact tumor and brain tissues. By mapping the cell subtypes back to their original locations in the tissue, distinctive cell neighborhoods with specific cell subtype compositions can be defined (Figure 10c). In this way, we can advance our understanding of cell–cell interaction and tissue organization.
FIGURE 10.
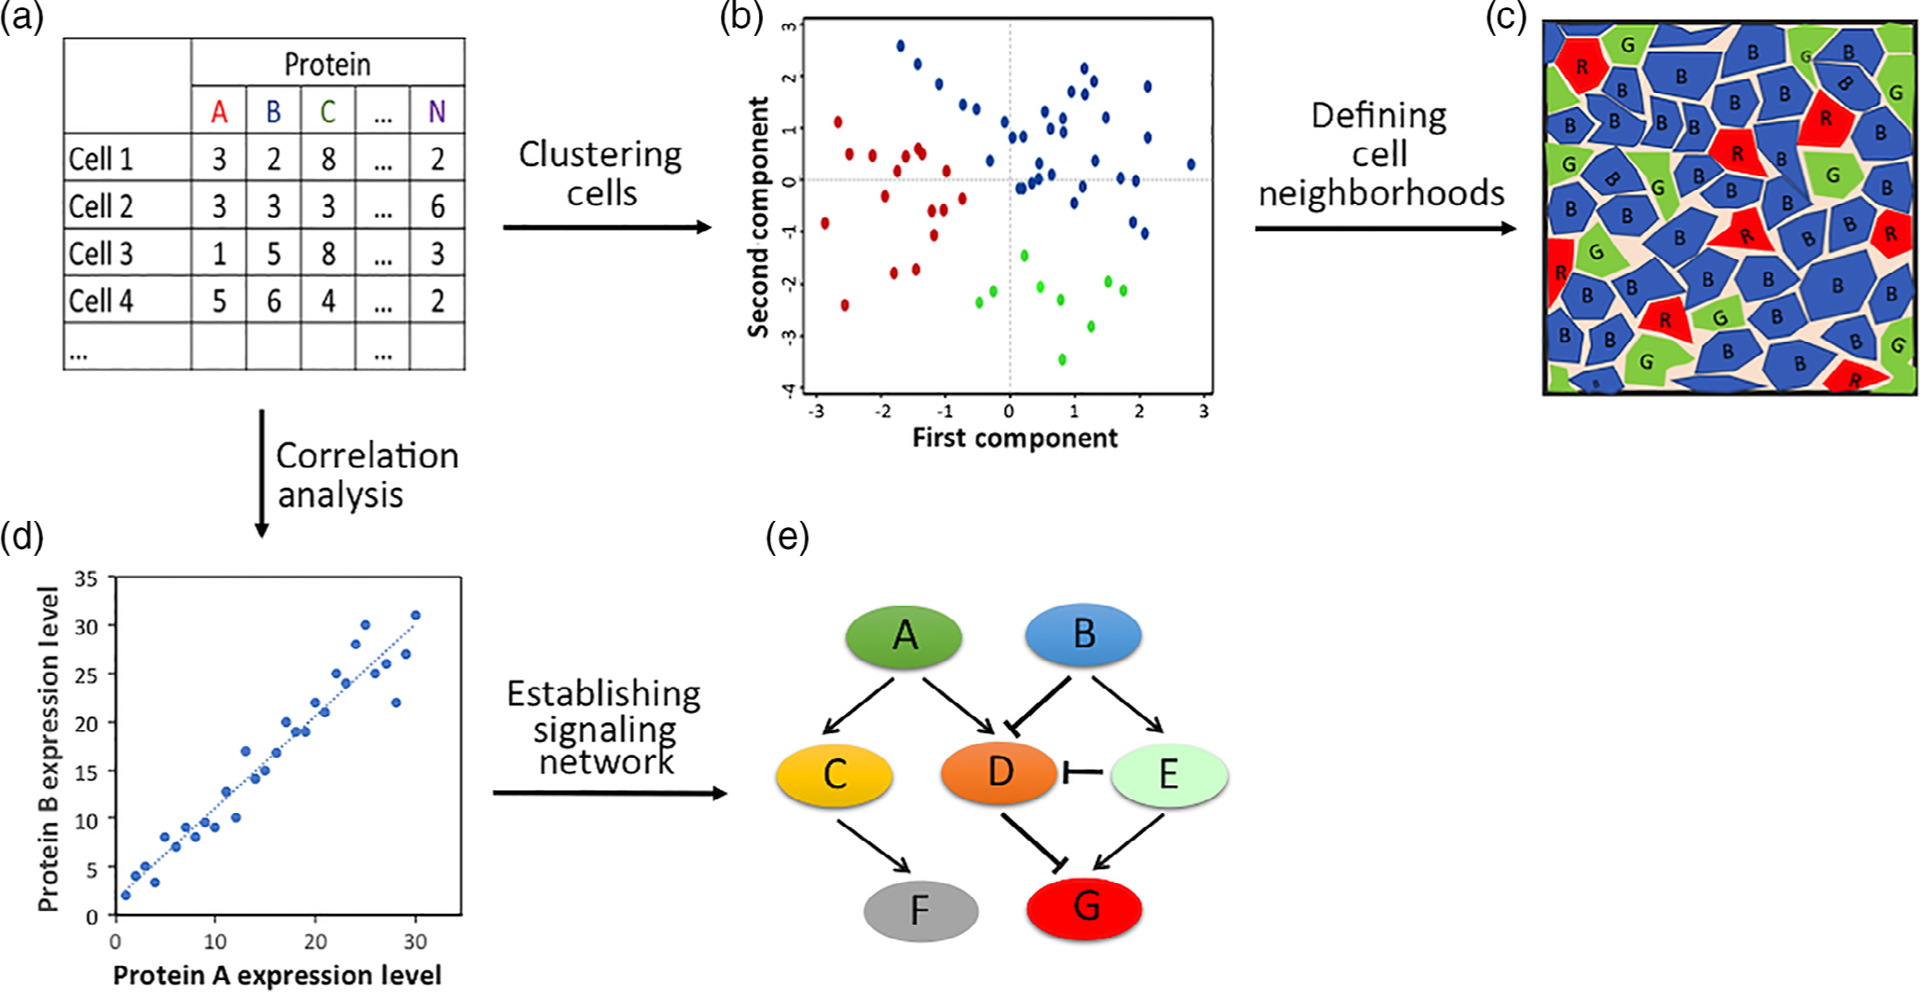
(a) A large number of proteins are quantified in every single cells of a biological system. (b) Heterogeneous cells are partitioned into different subgroups, with each subgroup consisting of cells possessing similar protein expression profiles. (c) Specific cell neighborhoods with unique cell subgroup compositions are identified. (d) Pairwise protein expression correlation analysis is carried out with each spot presenting one cell and its protein expression levels shown in x and y axes. (e) A regulatory network is generated with activating and inhibitory interactions
The single-cell proteomic technologies are also powerful tools to investigate intracellular signaling network. To interrogate protein activating and inhibitory interactions by conventional bulk cell analysis, it is required to generate protein expression variation by small molecule inhibitors, interfering RNA or knockout models, and so on. Such external stimuli can be avoided when performing single cell analysis, as stochastic protein expression variations (Becskei, Kaufmann, & van Oudenaarden, 2005; Blake, KÆrn, Cantor, & Collins, 2003; Elowitz, Levine, Siggia, & Swain, 2002; Golding, Paulsson, Zawilski, & Cox, 2005; Ozbudak, Thattai, Kurtser, Grossman, & van Oudenaarden, 2002; Raser & O’Shea, 2004; Rosenfeld, Young, Alon, Swain, & Elowitz, 2005) are generated naturally in single cells. With a large number of different proteins profiled in individual cells, pairwise protein expression correlation analysis (Figure 10d) can be carried out to study protein activating and inhibitory interactions (Figure 10e). Applying this method, SCBC (Shi et al., 2012; Wei et al., 2013); scWestern (Sinkala et al., 2017); mass cytometry (Bendall et al., 2011; Bodenmiller et al., 2012; Fragiadakis et al., 2016; Krishnaswamy et al., 2014; Mingueneau et al., 2014); and reiterative immunofluorescence (Mondal et al., 2017) have been used to interrogate the signaling pathways in immune and cancer cells. Such expression correlation analysis can constrain the signaling networks, suggest new regulatory pathways, predict the functions of proteins, study the biological responses to drugs and explore the mechanisms of drug resistance.
5 |. CHALLENGES AND FUTURE DIRECTIONS
While single-cell proteomic technologies have greatly advanced our understanding of complex biological systems, there are still some non-ideal factors. For example, the limited multiplexing capacity is one of the major bottlenecks. The recently developed technologies only allow dozens of proteins, a tiny fraction of the entire proteome, to be quantified in a sample. In order to precisely characterize cell heterogeneity and the regulatory pathways, the number of proteins profiled in single cells must be increased. This issue could be partially addressed by integrating the single-cell proteomic technologies with various other systems biology assays. For instance, the major cell subtypes and their active pathways in a biological sample can be first identified by genomics (Lander et al., 2001), transcriptomics (Guo, Yu, Turro, & Ju, 2010; Metzker, 2009), proteomic (Aebersold & Mann, 2003; Soste et al., 2014), and metabolomics (Patti, Yanes, & Siuzdak, 2012; Zenobi, 2013) methods. The results obtained from these assays will facilitate the selection of the most informative proteins, which are profiled subsequently using single-cell proteomic techniques. In an alternative approach, the single-cell proteomics methods can be applied first to define specific cell subtypes from heterogeneous biological systems or to identify regions of interest in tissue samples. Subsequently, these selected cell subtypes or tissue regions can be isolated by microfluidic or microdissection approaches (Bonner et al., 1997), and profiled using other systems biology assays.
Data analysis and interpretation are among the other challenges of the current single-cell proteomic technologies. To quantify the protein abundances in every single cell in intact tissues, the cellular boundaries are required to be precisely identified. In most of existing platforms, the stained nuclei are used to indicate the presence of single cells and the labeled membrane proteins are employed to determine the cellular boundaries (Carpenter et al., 2006). However, as the common tissue sections are less than 10 μm thick, a fraction of cells may not have their nuclei present in the tissue. Additionally, the membrane proteins of the various cell types in the tissue could have different expression levels and distinct cellular locations. Thus, using only the nuclei and membrane proteins for cell segmentation may generate misleading results. One potential way to address this issue is to include all the stained proteins for cell segmentation. Furthermore, the majority of the current platforms characterize the different cell subtypes only based on their varied protein expression levels. With the development of the in situ proteomic technologies, the protein location information can be revealed together with its identity and abundance. By integrating such location information into the data analysis algorithm, one can study protein–protein interactions, cell–cell communications, and the tissue architecture.
As almost all of current single-cell in situ proteomic technologies apply the dozens of antibodies in the same specimen, the interactions and cross-reactivity among these antibodies could lead to false positive and false negative signals. For instance, due to the bulky antibodies used in the former immunostaining cycles, the target binding process of the antibodies in the later cycles can be interfered with, especially when the different epitopes are in close proximity. One way to tackle this issue is to strip the antibodies after image capture and storage, to free the space occupied by the antibodies in the former cycles. Alternatively, using less bulky probes, such as nanobodies (Muyldermans, 2013), to stain the proteins can also partially avoid the molecularly crowded conditions. Second, the cross-reactivity among the antibodies may result in false positive staining signals. To prevent that, one should carefully compare the staining patterns and intensities obtained in the presence and absence of all the other antibodies. Once the antibodies with cross-reactivity are identified, those antibodies can be replaced by the alternative antibodies recognizing the same targets but from different clones. This antibody validation and replacement process should be continued until all of antibodies in the assay have no detectable cross-reactivity. Finally, to enable accurate comparison of the results generated by varied antibodies and different platforms, the absolute quantification of the protein amount is preferred. To achieve that, the samples under study and the standard cells can be analyzed together. As the protein copy numbers in the standard cells have been determined in advance, the immunostaining results obtained from the samples of interest can be calibrated to the absolute amount of the protein targets.
6 |. CONCLUSIONS
Without doubt, single-cell proteomic technologies have proved themselves as powerful tools to answer a variety of biological and biomedical questions, which cannot be addressed by conventional assays using populations of cells. Each of the platforms mentioned in this review has its own advantage in specific applications. For instance, SCBC enables the analysis of the secreted proteins generated from live cells. scWestern minimizes nonspecific binding and antibody cross-reaction that leads to false positive signals. ABCD has the highest multiplexing capacity and mass cytometry offers the highest sample throughput among other platforms. Allowing in situ analysis, imaging mass cytometry, ion beam imaging, and reiterative immunofluorescence can reveal the location information of cells in the tissue. Additionally, some of these approaches can be combined to achieve even more complicated single-cell analysis. For example, the integration of SCBC and ABCD will allow the profiling of the secreted and cytoplasmic proteins together from the same cells. The accumulative background signals generated after cycles of reiterative immunofluorescence can be removed by chemical or photobleaching. And imaging mass cytometry or ion beam imaging can be applied after reiterative immunofluorescence to further increase the number of proteins quantified in each cell.
The single-cell proteomic technologies discussed here promise to provide new insights into the understanding of the complex biological systems. By profiling individual cells in tumor tissues, we can study how cancer cells initiate, progress and metastasize. Another exciting application of the single-cell proteomic technologies is to analyze the brain tissues at different anatomical regions during a variety of brain activities. The results obtained from these studies will accelerate our understating of the brain functions at the molecular level. The single-cell proteomic assays also have wide applications in biomarker discovery, patient stratification, and treatment monitoring. By comparing the abundances and locations of different proteins in single cells between the normal and diseased tissues, new biomarkers can be identified. With these novel biomarkers, patients can be stratified into different groups for precise treatment, and the drug effects and immune response can be monitored to adjust the treatment timely. Combined with other systems biology approaches, the single-cell proteomic technologies will bring new insights into biomedical science and will also fundamentally change the practice of medicine.
Funding information
National Institute of Allergy and Infectious Diseases, Grant/Award Number: R21AI132840; National Institute of General Medical Sciences, Grant/Award Number: 1R01GM127633
Footnotes
CONFLICT OF INTEREST
The authors have declared no conflicts of interest for this article.
REFERENCES
- Aebersold R, & Mann M (2003). Mass spectrometry-based proteomics. Nature, 422(6928), 198–207. 10.1038/nature01511 [DOI] [PubMed] [Google Scholar]
- Agasti SS, Liong M, Peterson VM, Lee H, & Weissleder R (2012). Photocleavable DNA barcode–antibody conjugates allow sensitive and multiplexed protein analysis in single cells. Journal of the American Chemical Society, 134(45), 18499–18502. 10.1021/ja307689w [DOI] [PMC free article] [PubMed] [Google Scholar]
- Altelaar AFM, Munoz J, & Heck AJR (2012). Next-generation proteomics: Towards an integrative view of proteome dynamics. Nature Reviews Genetics, 14, 35–48. 10.1038/nrg3356 [DOI] [PubMed] [Google Scholar]
- Altschuler SJ, & Wu LF (2010). Essay cellular heterogeneity: Do differences make a difference? Cell, 141(4), 559–563. 10.1016/j.cell.2010.04.033 [DOI] [PMC free article] [PubMed] [Google Scholar]
- Amir ED, Davis KL, Tadmor MD, Simonds EF, Levine JH, Bendall SC, … Pe’er D (2013). viSNE enables visualization of high dimensional single-cell data and reveals phenotypic heterogeneity of leukemia. Nature Biotechnology, 31, 545. 10.1038/nbt.2594 [DOI] [PMC free article] [PubMed] [Google Scholar]
- Angelo M, Bendall SC, Finck R, Hale MB, Hitzman C, Borowsky AD, … Nolan GP (2014). Multiplexed ion beam imaging of human breast tumors. Nature Medicine, 20, 436–442. 10.1038/nm.3488 [DOI] [PMC free article] [PubMed] [Google Scholar]
- Becskei A, Kaufmann BB, & van Oudenaarden A (2005). Contributions of low molecule number and chromosomal positioning to stochastic gene expression. Nature Genetics, 37(9), 937–944. 10.1038/ng1616 [DOI] [PubMed] [Google Scholar]
- Bendall SC, & Nolan GP (2012). From single cells to deep phenotypes in cancer. Nature Biotechnology, 30, 639–647. 10.1038/nbt.2283 [DOI] [PubMed] [Google Scholar]
- Bendall SC, Simonds EF, Qiu P, Amir ED, Krutzik PO, Finck R, … Nolan GP (2011). Single-cell mass cytometry of differential immune and drug responses across a human hematopoietic continuum. Science, 332(6030), 687–696. 10.1126/science.1198704 [DOI] [PMC free article] [PubMed] [Google Scholar]
- Bhattacharya S, Mathew G, Ruban E, Epstein DBA, Krusche A, Hillert R, … Khan M (2010). Toponome imaging system: In situ protein network mapping in normal and cancerous colon from the same patient reveals more than five-thousand cancer specific protein clusters and their subcellular annotation by using a three symbol code. Journal of Proteome Research, 9(12), 6112–6125. 10.1021/pr100157p [DOI] [PubMed] [Google Scholar]
- Blake WJ, KÆrn M, Cantor CR, & Collins JJ (2003). Noise in eukaryotic gene expression. Nature, 422(6932), 633–637. 10.1038/nature01546 [DOI] [PubMed] [Google Scholar]
- Bode M, Irmler M, Friedenberger M, May C, Jung K, Stephan C, … Schubert W (2008). Interlocking transcriptomics, proteomics and toponomics technologies for brain tissue analysis in murine hippocampus. Proteomics, 8(6), 1170–1178. 10.1002/pmic.200700742 [DOI] [PubMed] [Google Scholar]
- Bodenmiller B, Zunder ER, Finck R, Chen TJ, Savig ES, Bruggner RV, … Nolan GP (2012). Multiplexed mass cytometry profiling of cellular states perturbed by small-molecule regulators. Nature Biotechnology, 30, 858–867. 10.1038/nbt.2317 [DOI] [PMC free article] [PubMed] [Google Scholar]
- Bonner RF, Emmert-Buck M, Cole K, Pohida T, Chuaqui R, Goldstein S, & Liotta LA (1997). Laser capture microdissection: Molecular analysis of tissue. Science, 278(5342), 1481–1483. 10.1126/science.278.5342.1481 [DOI] [PubMed] [Google Scholar]
- Carpenter AE, Jones TR, Lamprecht MR, Clarke C, Kang IH, Friman O, … Sabatini DM (2006). CellProfiler: Image analysis software for identifying and quantifying cell phenotypes. Genome Biology, 7(10), R100. 10.1186/gb-2006-7-10-r100 [DOI] [PMC free article] [PubMed] [Google Scholar]
- Chang HH, Hemberg M, Barahona M, Ingber DE, & Huang S (2008). Transcriptome-wide noise controls lineage choice in mammalian progenitor cells. Nature, 453, 544–547. 10.1038/nature06965 [DOI] [PMC free article] [PubMed] [Google Scholar]
- Cohen AA, Geva-Zatorsky N, Eden E, Frenkel-Morgenstern M, Issaeva I, Sigal A, … Alon U (2008). Dynamic proteomics of individual cancer cells in response to a drug. Science, 322(5907), 1511–1516. 10.1126/science.1160165 [DOI] [PubMed] [Google Scholar]
- Duose DY, Schweller RM, Hittelman WN, & Diehl MR (2010). Multiplexed and reiterative fluorescence labeling via DNA circuitry. Bioconjugate Chemistry, 21(12), 2327–2331. 10.1021/bc100348q [DOI] [PMC free article] [PubMed] [Google Scholar]
- Duose DY, Schweller RM, Zimak J, Rogers AR, Hittelman WN, & Diehl MR (2012). Configuring robust DNA strand displacement reactions for in situ molecular analyses. Nucleic Acids Research, 40(7), 3289–3298. 10.1093/nar/gkr1209 [DOI] [PMC free article] [PubMed] [Google Scholar]
- Elowitz MB, Levine AJ, Siggia ED, & Swain PS (2002). Stochastic gene expression in a single cell. Science, 297(5584), 1183–1186. 10.1126/science.1070919 [DOI] [PubMed] [Google Scholar]
- Elsasser WM (1984). Outline of a theory of cellular heterogeneity. Proceedings of the National Academy of Sciences of the United States of America, 81(16), 5126–5129. 10.1073/pnas.81.16.5126 [DOI] [PMC free article] [PubMed] [Google Scholar]
- Espina V, Mehta AI, Winters ME, Calvert V, Wulfkuhle J, Petricoin EF III, & Liotta LA (2003). Protein microarrays: Molecular profiling technologies for clinical specimens. Proteomics, 3(11), 2091–2100. 10.1002/pmic.200300592 [DOI] [PubMed] [Google Scholar]
- Fan R, Vermesh O, Srivastava A, Yen BKH, Qin L, Ahmad H, … Heath JR (2008). Integrated barcode chips for rapid, multiplexed analysis of proteins in microliter quantities of blood. Nature Biotechnology, 26, 1373–1378. 10.1038/nbt.1507 [DOI] [PMC free article] [PubMed] [Google Scholar]
- Fragiadakis GK, Baca QJ, Gherardini PF, Ganio EA, Gaudilliere DK, Tingle M, … Gaudilliere BL (2016). Mapping the fetomaternal peripheral immune system at term pregnancy. The Journal of Immunology, 197(11), 4482–4492. 10.4049/jimmunol.1601195 [DOI] [PMC free article] [PubMed] [Google Scholar]
- Gerdes MJ, Sevinsky CJ, Sood A, Adak S, Bello MO, Bordwell A, … Ginty F (2013). Highly multiplexed single-cell analysis of formalin-fixed, paraffin-embedded cancer tissue. Proceedings of the National Academy of Sciences of the United States of America, 110(29), 11982–11987. 10.1073/pnas.1300136110 [DOI] [PMC free article] [PubMed] [Google Scholar]
- Giedt RJ, Pathania D, Carlson JCT, Mcfarland PJ, Fernandez A, Juric D, & Weissleder R (2018). Single-cell barcode analysis provides a rapid readout of cellular signaling pathways in clinical. Nature Communications, 9(1), 4550. 10.1038/s41467-018-07002-6 [DOI] [PMC free article] [PubMed] [Google Scholar]
- Giesen C, Wang HAO, Schapiro D, Zivanovic N, Jacobs A, Hattendorf B, … Bodenmiller B (2014). Highly multiplexed imaging of tumor tissues with subcellular resolution by mass cytometry. Nature Methods, 11, 417–422. 10.1038/nmeth.2869 [DOI] [PubMed] [Google Scholar]
- Golding I, Paulsson J, Zawilski SM, & Cox EC (2005). Real-time kinetics of gene activity in individual bacteria. Cell, 123(6), 1025–1036. 10.1016/j.cell.2005.09.031 [DOI] [PubMed] [Google Scholar]
- Goltsev Y, Samusik N, Kennedy-darling J, Vazquez G, Black S, Nolan GP, … Vazquez G (2018). Deep profiling of mouse splenic architecture with resource deep profiling of mouse splenic architecture with CODEX multiplexed imaging. Cell, 174(4), 968–981.e15. 10.1016/j.cell.2018.07.010 [DOI] [PMC free article] [PubMed] [Google Scholar]
- Guo J, Yu L, Turro NJ, & Ju J (2010). An integrated system for DNA sequencing by synthesis using novel nucleotide analogues. Accounts of Chemical Research, 43(4), 551–563. 10.1021/ar900255c [DOI] [PMC free article] [PubMed] [Google Scholar]
- Hughes AJ, Spelke DP, Xu Z, Kang C-C, Schaffer DV, & Herr AE (2014). Single-cell western blotting. Nature Methods, 11, 749. Retrieved from–755. 10.1038/nmeth.2992 [DOI] [PMC free article] [PubMed] [Google Scholar]
- Irish JM, Hovland R, Krutzik PO, Perez OD, Bruserud Ø, Gjertsen BT, & Nolan GP (2004). Single cell profiling of potentiated phospho-protein networks in cancer cells. Cell, 118(2), 217–228. 10.1016/j.cell.2004.06.028 [DOI] [PubMed] [Google Scholar]
- Krishnaswamy S, Spitzer MH, Mingueneau M, Bendall SC, Litvin O, Stone E, … Nolan GP (2014). Conditional density-based analysis of T cell signaling in single-cell data. Science, 346(6213), 1250689. 10.1126/science.1250689 [DOI] [PMC free article] [PubMed] [Google Scholar]
- Lander ES, Linton LM, Birren B, Nusbaum C, Zody MC, Baldwin J, … Trust TW (2001). Initial sequencing and analysis of the human genome. Nature, 409(6822), 860–921. 10.1038/35057062 [DOI] [PubMed] [Google Scholar]
- Levine JH, Simonds EF, Bendall SC, Davis KL, Amir ED, Tadmor MD, … Nolan GP (2015). Data-driven phenotypic dissection of AML reveals progenitor-like cells that correlate with prognosis. Cell, 162(1), 184–197. 10.1016/j.cell.2015.05.047 [DOI] [PMC free article] [PubMed] [Google Scholar]
- Liao R, Pham T, Mastroeni D, Coleman PD, Labaer J, & Guo J (2020). Highly sensitive and multiplexed in-situ protein profiling with cleavable fluorescent streptavidin. Cell, 9(4), 852. 10.3390/cells9040852 [DOI] [PMC free article] [PubMed] [Google Scholar]
- Lin J-R, Fallahi-Sichani M, & Sorger PK (2015). Highly multiplexed imaging of single cells using a high-throughput cyclic immunofluorescence method. Nature Communications, 6, 8390. 10.1038/ncomms9390 [DOI] [PMC free article] [PubMed] [Google Scholar]
- Lu Y, Xue Q, Eisele MR, Sulistijo ES, Brower K, Han L, … Pe D (2015). Highly multiplexed profiling of single-cell effector functions reveals deep functional heterogeneity in response to pathogenic ligands. Proceedings of the national Academy of Sciences of the United States of Ameria, 112, 607–615. 10.1073/pnas.1416756112 [DOI] [PMC free article] [PubMed] [Google Scholar]
- Ma C, Fan R, Ahmad H, Shi Q, Comin-Anduix B, Chodon T, … Heath JR (2011). A clinical microchip for evaluation of single immune cells reveals high functional heterogeneity in phenotypically similar T cells. Nature Medicine, 17, 738–743. 10.1038/nm.2375 [DOI] [PMC free article] [PubMed] [Google Scholar]
- Meaburn KJ, Gudla PR, Khan S, Lockett SJ, & Misteli T (2009). Disease-specific gene repositioning in breast cancer. Journal of Cell Biology, 187(6), 801–812. 10.1083/jcb.200909127 [DOI] [PMC free article] [PubMed] [Google Scholar]
- Metzker ML (2009). Sequencing technologies—The next generation. Nature Reviews Genetics, 11, 31–46. 10.1038/nrg2626 [DOI] [PubMed] [Google Scholar]
- Micheva KD, Busse B, Weiler NC, O’Rourke N, & Smith SJ (2010). Single-synapse analysis of a diverse synapse population: Proteomic imaging methods and markers. Neuron, 68(4), 639–653. 10.1016/j.neuron.2010.09.024 [DOI] [PMC free article] [PubMed] [Google Scholar]
- Micheva KD, & Smith SJ (2007). Array tomography: A new tool for imaging the molecular architecture and ultrastructure of neural circuits. Neuron, 55(1), 25–36. 10.1016/j.neuron.2007.06.014 [DOI] [PMC free article] [PubMed] [Google Scholar]
- Mingueneau M, Krishnaswamy S, Spitzer MH, Bendall SC, Stone EL, Hedrick SM, … Benoist C (2014). Single-cell mass cytometry of TCR signaling: Amplification of small initial differences results in low ERK activation in NOD mice. Proceedings of the National Academy of Sciences of the United States of America, 111(46), 16466–16471. 10.1073/pnas.1419337111 [DOI] [PMC free article] [PubMed] [Google Scholar]
- Mondal M, Liao R, Xiao L, Eno T, & Guo J (2017). Highly multiplexed single-cell in situ protein analysis with cleavable fluorescent antibodies. Angewandte Chemie International Edition, 56(10), 2636–2639. 10.1002/anie.201611641 [DOI] [PubMed] [Google Scholar]
- Muyldermans S (2013). Nanobodies: Natural single-domain antibodies. Annual Review of Biochemistry, 82, 775–797. 10.1146/annurev-biochem-063011-092449 [DOI] [PubMed] [Google Scholar]
- Newell EW, Sigal N, Bendall SC, Nolan GP, & Davis MM (2012). Cytometry by time-of-flight shows combinatorial cytokine expression and virus-specific cell niches within a continuum of CD8+ T cell phenotypes. Immunity, 36(1), 142–152. 10.1016/j.immuni.2012.01.002 [DOI] [PMC free article] [PubMed] [Google Scholar]
- Ozbudak EM, Thattai M, Kurtser I, Grossman AD, & van Oudenaarden A (2002). Regulation of noise in the expression of a single gene. Nature Genetics, 31(1), 69–73. 10.1038/ng869 [DOI] [PubMed] [Google Scholar]
- Patti GJ, Yanes O, & Siuzdak G (2012). Metabolomics: The apogee of the omics trilogy. Nature Reviews Molecular Cell Biology, 13, 263–269. 10.1038/nrm3314 [DOI] [PMC free article] [PubMed] [Google Scholar]
- Raser JM, & O’Shea EK (2004). Control of stochasticity in eukaryotic gene expression. Science, 304(5678), 1811–1814. 10.1126/science.1098641 [DOI] [PMC free article] [PubMed] [Google Scholar]
- Rompolas P, Mesa KR, & Greco V (2013). Spatial organization within a niche as a determinant of stem-cell fate. Nature, 502, 513–518. 10.1038/nature12602 [DOI] [PMC free article] [PubMed] [Google Scholar]
- Rosenfeld N, Young JW, Alon U, Swain PS, & Elowitz MB (2005). Gene regulation at the single-cell level. Science, 307(5717), 1962–1965. 10.1126/science.1106914 [DOI] [PubMed] [Google Scholar]
- Saka SK, Wang Y, Kishi JY, Zhu A, Zeng Y, Xie W, … Yin P (2019). Amplified protein imaging in tissues. Nature Biotechnology, 37, 1080–1090. 10.1038/s41587-019-0207-y [DOI] [PMC free article] [PubMed] [Google Scholar]
- Schubert W, Bonnekoh B, Pommer AJ, Philipsen L, Böckelmann R, Malykh Y, … Dress AWM (2006). Analyzing proteome topology and function by automated multidimensional fluorescence microscopy. Nature Biotechnology, 24(10), 1270–1278. 10.1038/nbt1250 [DOI] [PubMed] [Google Scholar]
- Schubert W, Gieseler A, Krusche A, & Hillert R (2009). Toponome mapping in prostate cancer: Detection of 2000 cell surface protein clusters in a single tissue section and cell type specific annotation by using a three symbol code. Journal of Proteome Research, 8(6), 2696–2707. 10.1021/pr800944f [DOI] [PubMed] [Google Scholar]
- Schweller RM, Zimak J, Duose DY, Qutub AA, Hittelman WN, & Diehl MR (2012). Multiplexed in situ immunofluorescence using dynamic DNA complexes. Angewandte Chemie, 124(37), 9426–9430. 10.1002/ange.201204304 [DOI] [PMC free article] [PubMed] [Google Scholar]
- Shaffer SM, Dunagin MC, Torborg SR, Torre EA, Emert B, Krepler C, … Raj A (2017). Rare cell variability and drug-induced reprogramming as a mode of cancer drug resistance. Nature, 546, 431–435. 10.1038/nature22794 [DOI] [PMC free article] [PubMed] [Google Scholar]
- Sharma SV, Lee DY, Li B, Quinlan MP, Takahashi F, Maheswaran S, … Settleman J (2010). A chromatin-mediated reversible drug-tolerant state in cancer cell subpopulations. Cell, 141(1), 69–80. 10.1016/j.cell.2010.02.027 [DOI] [PMC free article] [PubMed] [Google Scholar]
- Shi Q, Qin L, Wei W, Geng F, Fan R, Shik Y, … Hood L (2012). Single-cell proteomic chip for profiling intracellular signaling pathways in single tumor cells. Proceedings of the National Academy of Sciences of the United States of America, 109(2), 1–6. 10.1073/pnas.1110865109 [DOI] [PMC free article] [PubMed] [Google Scholar]
- Shin YS, Ahmad H, Shi Q, Kim H, Pascal TA, Fan R, … Heath JR (2010). Chemistries for patterning robust DNA microbarcodes enable multiplex assays of cytoplasm proteins from single cancer cells. ChemPhysChem, 11(14), 3063–3069. 10.1002/cphc.201000528 [DOI] [PMC free article] [PubMed] [Google Scholar]
- Sinkala E, Sollier-Christen E, Renier C, Rosàs-Canyelles E, Che J, Heirich K, … Herr AE (2017). Profiling protein expression in circulating tumour cells using microfluidic western blotting. Nature Communications, 8, 14622. 10.1038/ncomms14622 [DOI] [PMC free article] [PubMed] [Google Scholar]
- Sood A, Miller AM, Brogi E, Sui Y, Armenia J, McDonough E, … Mellinghoff IK (2016). Multiplexed immunofluorescence delineates proteomic cancer cell states associated with metabolism. JCI Insight, 1(6), e87030. 10.1172/jci.insight.87030 [DOI] [PMC free article] [PubMed] [Google Scholar]
- Soste M, Hrabakova R, Wanka S, Melnik A, Boersema P, Maiolica A, … Picotti P (2014). A sentinel protein assay for simultaneously quantifying cellular processes. Nature Methods, 11, 1045–1048. 10.1038/nmeth.3101 [DOI] [PubMed] [Google Scholar]
- Spencer SL, Gaudet S, Albeck JG, Burke JM, & Sorger PK (2009). Non-genetic origins of cell-to-cell variability in TRAIL-induced apoptosis. Nature, 459, 428–432. 10.1038/nature08012 [DOI] [PMC free article] [PubMed] [Google Scholar]
- Spitzer MH, & Nolan GP (2016). Mass cytometry: Single cell, many features. Cell, 165(4), 780–791. 10.1016/j.cell.2016.04.019 [DOI] [PMC free article] [PubMed] [Google Scholar]
- Stoeckius M, Hafemeister C, Stephenson W, Houck-loomis B, Chattopadhyay PK, Swerdlow H, … Smibert P (2017). Simultaneous epitope and transcriptome measurement in single cells. Nature Methods, 14, 865–868. 10.1038/nmeth.4380 [DOI] [PMC free article] [PubMed] [Google Scholar]
- Jolliffe II, & Cadima J (2016). Principal component analysis: A review and recent developments. Philosophical Transactions of the Royal Society A: Mathematical, Physical and Engineering Sciences, 374(2065), 20150202. 10.1098/rsta.2015.0202 [DOI] [PMC free article] [PubMed] [Google Scholar]
- Tentori AM, Yamauchi KA, & Herr AE (2016). Detection of isoforms differing by a single charge unit in individual cells. Angewandte Chemie International Edition, 55(40), 12431–12435. 10.1002/anie.201606039 [DOI] [PMC free article] [PubMed] [Google Scholar]
- Ullal AV, Ullal AV, Peterson V, Agasti SS, Tuang S, & Juric D (2014). Cancer cell profiling by barcoding allows multiplexed protein analysis in fine-needle aspirates. Science Translational Medicine, 6, 219. 10.1126/scitranslmed.3007361 [DOI] [PMC free article] [PubMed] [Google Scholar]
- Valastyan S, & Weinberg RA (2011). Tumor metastasis: Molecular insights and evolving paradigms. Cell, 147(2), 275–292. 10.1016/j.cell.2011.09.024 [DOI] [PMC free article] [PubMed] [Google Scholar]
- Van Der Maaten L, & Hinton G (2008). Visualizing data using t-SNE. Journal of Machine Learning Research, 9(November), 2579–2605. [Google Scholar]
- Wei W, Shi Q, Remacle F, Qin L, Shackelford DB, Shin YS, … Heath JR (2013). Hypoxia induces a phase transition within a kinase signaling network in cancer cells. Proceedings of the National Academy of Sciences of the United States of America, 110(15), E1352–E1360. 10.1073/pnas.1303060110 [DOI] [PMC free article] [PubMed] [Google Scholar]
- Wu M, & Singh AK (2012). Single-cell protein analysis. Current Opinion in Biotechnology, 23(1), 83–88. 10.1016/j.copbio.2011.11.023 [DOI] [PMC free article] [PubMed] [Google Scholar]
- Xue M, Wei W, Su Y, Kim J, Shin YS, Mai WX, … Heath JR (2015). Chemical methods for the simultaneous quantitation of metabolites and proteins from single cells. Journal of the American Chemical Society, 137(12), 4066–4069. 10.1021/jacs.5b00944 [DOI] [PMC free article] [PubMed] [Google Scholar]
- Yang M, Nelson R, & Ros A (2016). Toward analysis of proteins in single cells: A quantitative approach employing isobaric tags with MALDI mass spectrometry realized with a microfluidic platform. Analytical Chemistry, 88(13), 6672–6679. 10.1021/acs.analchem.5b03419 [DOI] [PubMed] [Google Scholar]
- Zenobi R (2013). Single-cell metabolomics: Analytical and biological perspectives. Science, 342(6163), 1243259. 10.1126/science.1243259 [DOI] [PubMed] [Google Scholar]
- Zhao P, Bhowmick S, Yu J, & Wang J (2018). Highly multiplexed single-cell protein profiling with large-scale convertible DNA-antibody barcoded arrays. Advanced Science, 5(9), 1800672. 10.1002/advs.201800672 [DOI] [PMC free article] [PubMed] [Google Scholar]
- Zrazhevskiy P, & Gao X (2013). Quantum dot imaging platform for single-cell molecular profiling. Nature Communications, 4(1), 1–12. 10.1038/ncomms2635 [DOI] [PMC free article] [PubMed] [Google Scholar]


