Key Points
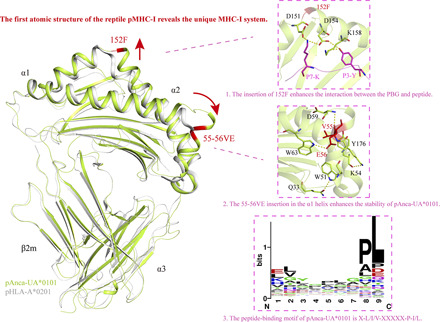
The first atomic structure of the reptile pMHC-I reveals the unique MHC-I system.
The pMHC-I includes an unusual flip and an upward shift in the α1/α2–helical regions.
The peptide presentation motif and profile of the reptile pMHC-I were determined.
Visual Abstract
Abstract
The reptile MHC class I (MCH-I) and MHC class II proteins are the key molecules in the immune system; however, their structure has not been investigated. The crystal structure of green anole lizard peptide–MHC-I–β2m (pMHC-I or pAnca-UA*0101) was determined in the current study. Subsequently, the features of pAnca-UA*0101 were analyzed and compared with the characteristics of pMHC-I of four classes of vertebrates. The amino acid sequence identities between Anca-UA*0101 and MHC-I from other species are <50%; however, the differences between the species were reflected in the topological structure. Significant characteristics of pAnca-UA*0101 include a specific flip of ∼88° and an upward shift adjacent to the C terminus of the α1- and α2-helical regions, respectively. Additionally, the lizard MHC-I molecule has an insertion of 2 aa (VE) at positions 55 and 56. The pushing force from 55-56VE triggers the flip of the α1 helix. Mutagenesis experiments confirmed that the 55-56VE insertion in the α1 helix enhances the stability of pAnca-UA*0101. The peptide presentation profile and motif of pAnca-UA*0101 were confirmed. Based on these results, the proteins of three reptile lizard viruses were used for the screening and confirmation of the candidate epitopes. These data enhance our understanding of the systematic differences between five classes of vertebrates at the gene and protein levels, the formation of the pMHC-I complex, and the evolution of the MHC-I system.
Introduction
Reptiles are considered the ancestors of birds and archaic mammals (1). Reptiles are cold-blooded animals with pulmonary respiration and mixed blood circulation that adapted to live on land and do not require water for reproduction (2). Reptiles, together with birds and mammals, are known as amniotic animals (3). Reptiles extensively developed in the middle of the Mesozoic Era to become completely dominant animals on Earth. Therefore, the Mesozoic Era is called the “reptile era” or “dinosaur era” (4). By the late Cretaceous Period, a number of reptile branches became extinct, and ∼4500 species from five orders remained. Reptiles represent an evolutionary node between amphibians and birds; thus, detailed studies of reptilian adaptive immune system and related evolutionary blind spots have considerable scientific value (3). After two rounds of the genome-wide replication, reptiles have evolved a series of natural and adaptive immune systems that can resist various viruses and other pathogenic microorganisms under natural conditions. The key molecules of the immune system include RAG-dependent TCRs and BCR and the MHC system (1, 5). In particular, reptiles have IgM, IgD, and IgY isotypes of Abs (6), somatic hypermutations, class-switch recombination, and dendritic cells; however, they lack lymphatics, germinal centers, and follicular dendritic cells (1). After the second round of the whole genome duplication, the MHC system was dispersed in four different chromosomal regions. Immune system involves APCs that present Ag peptides through the MHC class I (MHC-I) and MHC class II (MHC-II) systems, which initiate the immune response of CTL and induce the Ab immune response.
The MHC system includes molecules that are the members of the Ig supergene family (7, 8). Members of this family have been detected in five classes of the vertebrates. DNA clones for the MHC-I H chain (HC) have been isolated from birds (9), fish (10), and amphibians (11). In 1992, the MHC-I genes of two reptiles were cloned by RT-PCR for the first time (12). The cDNA sequences of MHC-I of five lizard and two snake species were obtained and compared with the corresponding sequences of fish and amphibians. A number of highly variable amino acids were identified in the peptide-binding groove (PBG), and a few conserved amino acids were detected in the TCR interaction region and CD8-binding region in the MHC-I of fish, amphibians, reptiles, birds, and mammals (12). A few years later, MHC variation and the effect of MHC on mate selection, survival, and reproductive success in natural populations of reptiles were studied in detail (13, 14).
The first genome sequence of reptiles was reported for green anole lizard (Anolis carolinensis) (15). Analysis of the genome of A. carolinensis identified three classical MHC-I loci and a β-2 microglobulin (β2m) locus (see Supplemental Fig. 1). Subsequently, the number of the studies of reptile genome has increased (16–19). Genomes of at least 24 species of reptiles have been reported to date (20). In particular, in 2014, six gene clusters containing nine MHC-I genes, six MHC-II genes, and three TAP genes were identified in saltwater crocodile (21). These results showed that the MHC system of the saltwater crocodile differs from the simple structure detected in many birds and appears to have a distinct organization. In 2015, at least four classical MHC-I loci were identified in the Australian sleepy lizard that shares a polymorphism with pygmy bluetongue lizard and gidgee skink in the amino acid sequences encoding the peptide-binding domains (22). Miller et al. (23) investigated the organization and cytogenetic location of the MHC genes in tuatara and identified a total of seven MHC-I genes and 11 MHC-II genes with evidence of duplication and pseudogenization of the genes within the tuatara lineage. These results confirm that reptiles have a well-developed MHC-I system. We also identified some interspecies characteristics by analysis of the reported reptilian MHC-I sequences; overall, the identity of the amino acid sequences within reptilian species is ∼42.8–93.5%, and the identity of MHC sequences between reptiles, mammals, birds, amphibians, and fish is ∼38.4–49.6%. Ancient lineages of the genes encoding the MHC-I molecules, immunoproteasome and TAP were confirmed in the MHC-I system of fish, amphibians, and reptiles (1). Additionally, β2m is a subunit of the MHC-I molecule and noncovalently associates with monomorphic regions of ubiquitously expressed polymorphic MHC-I molecules; β2m is required for peptide presentation to CD8+ T cells (24). However, reptilian β2m has not been investigated.
The function of proteins and especially the structure and function of protein complexes is difficult to understand using only the gene sequences of MHC-I. In addition, the crystal structures of the peptide–MHC-I–β2m (pMHC-I) complexes of four classes of vertebrates, including bony fish (25), amphibians (26), birds (27, 28), and mammals (29, 30) have been resolved; thus, there is a lack of relevant structural data on reptilian MHC-I. This lack of information hinders our understanding of the relationships between the MHC-I system, T cells, and diseases and leaves a very large taxonomic gap in our understanding of the evolution of the MHC-I system (31). In contrast, reptiles (including farmed reptiles) are often infected by nidoviruses, sripuviruses, iridoviruses, and adenoviruses (32, 33), which pose a great threat to the survival of some species (34). Since the West Nile virus appeared in the Western Hemisphere at the end of the 20th century and was found to infect a number of different reptile species (35), there is an increasing interest in reptilian viruses aimed to determine if reptiles are reservoirs for human diseases (36).
Thus, we selected the green anole lizard as a representative species of reptiles; the MHC-I and β2m molecules were expressed, and the peptide presentation profile was evaluated. On this basis, the atomic structure of pMHC-I (also known as pAnca-UA*0101) was further analyzed, revealing the unique mechanism of the reptilian MHC-I system. Specifically, amino acid insertions in the α1 and α2 domains of pAnca-UA*0101 provide for the formation of unique Ag-binding groove, and special molecular dynamics involves these amino acids. The results of the current study will enhance our understanding of the systematic differences between the five classes of the vertebrates at the gene and protein levels and of the formation of the pMHC-I complex to recognize the laws governing the evolution of the MHC-I system. In addition, the study of the reptile MHC system will help to solve a series of problems with regard to the features of pMHC-I and peptide presentation profiles, viral CTL epitopes, and development of multiepitope vaccines.
Materials and Methods
Peptide synthesis
The peptides used in this experiment are listed in Supplemental Table I. The synthetic random peptide library Ran_9Xsplitted (where X is a random amino acid other than cysteine) was used in the study, and a nonapeptide (HVYGPLKPI) that can be crystallized with Anca-UA*0101 was selected from the Ran_9Xsplitted library, synthesized, and purified by reverse-phase HPLC (Top-Biotechnology, Shanghai, China) with >90% purity. The lyophilized peptides were stored at −80°C and dissolved in DMSO at a suitable concentration before use as described previously (26).
Protein preparation
The extracellular region of A. carolinensis MHC-I without the signal peptide termed Anca-UA*0101 (GenBank no. XP_016847223.1, LOC100559978) and A. carolinensis β2m termed Anca-β2m (GenBank no. XP_003227530.1) were synthesized with the codon preferences of Escherichia coli (GENEWIZ, Beijing, China). The genes were incorporated into the prokaryotic expression vector pET21a (+) at the NdeI and XhoI restriction sites, and the vectors were named pET-21a-Anca-UA*0101 and pET-21a-Anca-β2m, respectively. The constructed plasmids were transformed into the E. coli strain BL21(DE3) for prokaryotic expression to obtain the inclusion bodies; then, the proteins were purified as described previously (37). Purified proteins were dissolved in 6 M guanidine hydrochloride at a final concentration of 30 mg/ml and stored at −20°C.
The assembly and purification of the pAnca-UA*0101 complex
The assembly of the pAnca-UA*0101 complex in vitro was performed by the dilution renaturation method. The molar ratio of Anca-UA*0101, Anca-β2m, and peptide was 1:1:3, and the inclusion bodies were renatured using a previously described (38) gradual dilution method in refolding buffer for 24 h at 4°C. Then, the refolded product was concentrated using a 10-kDa-cutoff filter and purified on a Superdex 200 16/60 column followed by Resource Q anion exchange chromatography (GE Healthcare). Finally, the purified complex was obtained and identified by PAGE based on the expected migration distance.
Liquid chromatography–tandem mass spectrometry
pAnca-UA*0101 refolded in the presence of the Ran_9Xsplitted library was treated with 0.2 N acetic acid, incubated at 65°C for 30 min, and concentrated using a 3-kDa-cutoff filter to collect the peptides. The samples were desalted by a previously described method (39). Initially, 200 μl of methanol was used to activate the desalting tips, and 200 μl of 0.1% (v/v) trifluoroacetic acid (TFA) was used to equilibrate the tips. Then, the peptides were washed twice with 200 μl of washing buffer (0.1% [v/v] TFA) and eluted with 200 μl of eluting solution (0.1% [v/v] TFA and 75% [v/v] acetonitrile). The eluted peptides were lyophilized and stored at −80°C. The peptides were separated using an Easy Nano LC1000 system (Thermo Fisher Scientific, San Jose, CA) as described previously. Mass spectrometry (MS) data were acquired by a Q Exactive HF System (Thermo Fisher Scientific, Bremen, Germany) in the data-dependent acquisition mode, and the top 20 precursors by intensity within the m/z range from 300 to 1800 were sequentially fragmented by higher energy collisional dissociation and normalized collision energy of 27. The dynamic exclusion time was 20 s. Automatic gain control for MS1 and MS2 was set to 3e6 and 1e, and the resolution for MS1 and MS2 was set to 120 and 30 K, respectively (40).
De novo sequencing and peptide scoring
Nonapeptides were identified based on their spectral information by the PEAKS Studio software, and a peptide with the highest probability was derived from each spectrum. The detection threshold for identified polypeptides was adjusted: sequence length = 9 and score ≥60. In addition, to determine the restricted motif of pAnca-UA*0101 presentation, the SD (σ), average value (x̅), and coefficient of variation (Vs) were calculated as described previously (39). The likelihood of the presence of each amino acid at positions P1-P9 of the peptides was estimated using this method. A peptide position with a higher Vs value was predicted to be a restricted position in the presentation. Peptides with high affinity to Anca-UA*0101 were predicted as described previously (39).
Crystallization and data collection
A high-scoring nonapeptide (HVYGPLKPI) was selected based on the MS screening results of the Ran_9Xsplitted library (Supplemental Table II) and was added during the refolding of Anca-UA*0101 in vitro to obtain the pAnca-UA*0101 complex. The buffer for the purified pAnca-UA*0101 proteins was exchanged three times with 10 mM Tris-HCl and 50 mM NaCl (pH 8.0); the protein was diluted to 5 and 10 μg/μl and mixed with buffers of a crystallization screening kit at a 1:1 volume ratio. The crystallization screening of pAnca-UA*0101 was performed using the sitting-drop vapor diffusion technique at 4°C (41). The Index, Crystal Screen Lite, and Natrix kits (Hampton Research, Riverside, CA) were used to determine the optimal crystal growth conditions. A crystal of pAnca-UA*0101 was obtained using Natrix solution No. 26 (0.2 M potassium chloride, 0.1 M magnesium acetate tetrahydrate, 0.05 M sodium cacodylate trihydrate (pH 6.5), and 10% w/v polyethylene glycol 8000) at 4°C after 1 wk at a protein concentration of 5 mg/ml. Diffraction data were collected at Beamline BL18U (0.97892 Å wavelength) of the Shanghai Synchrotron Radiation Facility (Shanghai, China). The data were indexed and integrated using the CCP4 software and then scaled and merged using the HKL-3000 software package (HKL Research).
Structure determination, refinement, and data analysis
The amino acid sequence identity between Anca-UA*0101 and duck MHC-I (Anpl-UAA*01) is ∼49%; hence, the structure of pAnca-UA*0101 (Protein Data Bank [PDB] identification number [ID]: 7CPO) was determined by the molecular replacement method (42) using the PHASER software in CCP4i with Anpl-UAA*01 (PDB ID: 5GJX) as the initial phasing model. pAnca-UA*0101 was crystallized in the I222 orthorhombic space group. After correction of the maps in Coot and several rounds of refinement in REFMAC5, phenix.refine was used for subsequent refinement. Finally, MolProbity tools were used in Phenix for model quality assessment. The structural illustrations and related figures were generated by PyMOL v0.99rc2 (Schrödinger). The sequence alignment was performed by Clustal Ω (https://www.ebi.ac.uk/Tools/msa/clustalo/) and ESPript 3.0 (http://espript.ibcp.fr/ESPript/ESPript/). The accessible surface area (ASA) and buried surface area values were calculated online via the PDBePISA Web site (http://www.ebi.ac.uk/msd-srv/prot_int/pistart.html).
Deletion mutagenesis
Initially, pET-21a-Anca-UA*0101 without 55-56VE residues (termed pET-21a-Anca-UA*0101Δ55-56VE) was obtained using overlap extension PCR and the following primers: 55-56VE-F1 5′-CATATGGGCAGCAGCAGCCATAGC-3′, 55-56VE-R1 5′-TCCGGATCGTTCTTCTTGCTGATCCACGGCACTTTCGG-3′, 55-56VE-F2 5′-CGTGGATCAGCAAGAAGAACGATCCGGACTACTGGGAGC-3′, and 55-56VE-R2 5′-CTCGAGTTACCAGGCAACATCCACCG-3′. pET-21a-Anca-UA*0101 without 152F residue (termed pET-21a-Anca-UA*0101Δ152F) was obtained by the same method using the following primers: 152F-F1 5′-CATATGGGCAGCAGCAGCCATAGC-3′, 152F-R1 5′-TCGTTATCGCGATCGGCGTCCCACTTGCG-3′, 152F-F2 5′-GGGACGCCGATCGCGATAACGAATATAAAAAGACCTATCTGGAAGAGACC-3′, and 152F-R2 5′-CTCGAGTTACCAGGCAACATCCACCG-3′. The proteins were expressed as described above to obtain the corresponding products, Anca-UA*0101Δ55-56VE and Anca-UA*0101Δ152F. Then, pAnca-UA*0101Δ55-56VE and pAnca-UA*0101Δ152F complexes were obtained by refolding in the presence of Anca-β2m and the peptide and purified by gel filtration and anion exchange chromatography as describe above. The effects of 55-56VE and 152F insertions were analyzed by protein structure modeling. The protein models of pAnca-UA*0101Δ55-56VE and pAnca-UA*0101Δ152F were generated by the online SWISS-MODEL tool (https://swissmodel.expasy.org/interactive#structure) using pAnca-UA*0101 as a template.
Protein structure accession number
The pAnca-UA*0101 structure was deposited in the PDB (http://www.rcsb.org/pdb/home/home.do) with the PDB accession no. 7CPO.
Results
General structure of pAnca-UA*0101
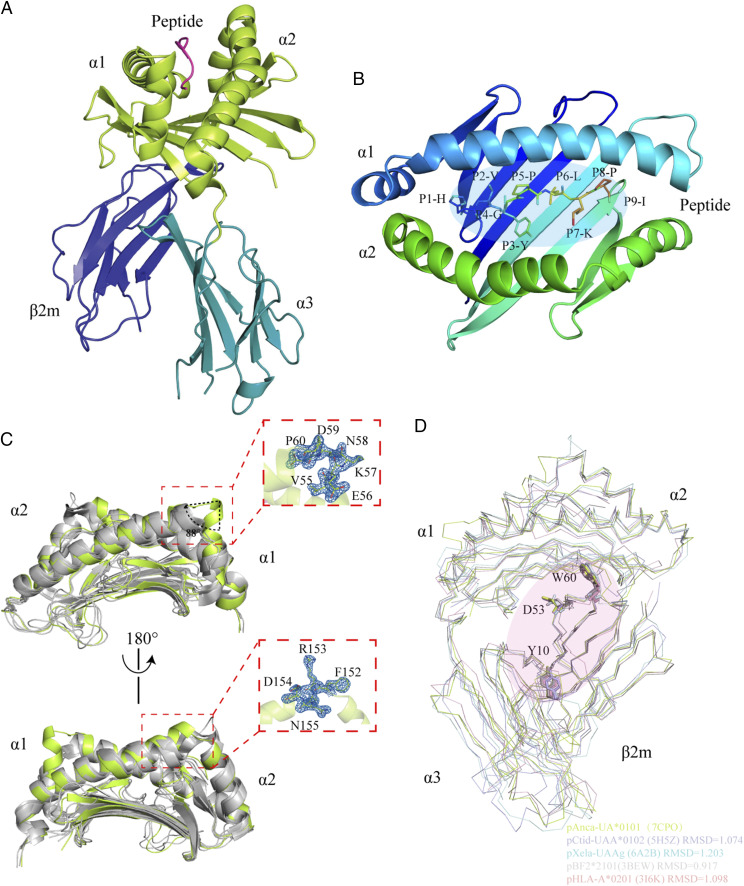
Using pAnpl-UAA*01 as a template, the crystal structure of the pAnca-UA*0101 complex with a nonapeptide (HVYGPLKPI) from the Ran_9Xsplitted library of random peptides was determined by the molecular replacement method at a resolution of 2.5 Å and a space group of I222 (Table I). Similar to the known structure of the classical pMHC-I complex, the structure of pAnca-UA*0101 is composed of an HC, L chain β2m, and nonapeptide (Fig. 1A). The Anca-UA*0101 HC can be divided into three domains: α1, α2, and α3. The α1 and α2 domains form a PBG through eight antiparallel β-sheets and two longer α-helices. The PBG anchors the Ag peptide at six regions (A–F, each region is commonly called a pocket, Fig. 1B). The resulting overall PBG can be recognized by the TCR and trigger a specific CTL immune response. However, the characteristics of pAnca-UA*0101 are significantly different from the known pMHC-I structures; these characteristics include an unusual flip of ∼88° adjacent to the C terminus of the α1-helical region and a significant upward shift adjacent to the C terminus of the α2-helical region (Fig. 1C).
Table I. X-ray diffraction data collection and refinement statistics.
| Statistic Value | pAnca- UA*0101 |
|---|---|
| Data collection | |
| Space group | I222 |
| Cell dimensions | |
| a, b, c (Å) | 40.919, 93.69, 246.353 |
| a, b, γ (°) | 90, 90, 90 |
| Resolution (Å) | 19.92–1.40 |
| Rmergea | 0.143 (0.381)b |
| Average I/σ | 7.70 (6.50)b |
| Completeness (%) | 76.96% (100.00%)b |
| N (observed) | 760,548 |
| N (unique) | 72,758 |
| Redundancy | 10.50 |
| Refinement | |
| Resolution (Å) | 19.92–2.50 |
| Rwork/Rfreec | 0.185/0.247 |
| B-factors | 32.36 |
| RMSD (bonds) | 0.009 |
| RMSD (angles) | 1.115 |
| Ramachandran statistics | |
| Most favored (%) | 98.07 |
| Allowed (%) | 1.93 |
| Disallowed (%) | 0.00 |
Rmerge = Σhkl Σi |Ii(hkl) – 〈I(hkl)〉 |/Σhkl Σi Ii(hkl), where Ii(hkl) is the observed intensity, and 〈I(hkl)〉 is the average intensity from multiple measurements.
Values in parentheses are for the highest-resolution shell.
R = Σhkl || Fobs | – k | Fcalc | |Σhkl | Fobs |, where Rfree is calculated for a randomly chosen 5% of reflections, and Rwork is calculated for the remaining 95% of reflections used for structure refinement.
FIGURE 1.
Structural overview of the green anole pAnca-UA*0101 complex. (A) The HC of pAnca-UA*0101 consists of three domains including α1 and α2 shown in lime green and α3 shown in teal. β2m is shown in deep blue. The peptide HVYGPLKPI is shown in magenta. (B) The binding of the HVYGPLKPI peptide in the PBG of pAnca-UA*0101. (C) Special features of the pAnca-UA*0101 PBG. Structural comparison of the α1 and α2 domains of pAnca-UA*0101, bony fish MHC-I (pCtid-UAA*0102, PDB ID: 5H5Z), African frog MHC-I (pXela-UAAg, PDB ID: 6A2B), chicken MHC-I (BF2*2101, PDB ID: 3BEW), and human MHC-I (HLA-A*0201, PDB ID: 3I6K). Except for pAnca-UA*0101 shown in lime green, other MHC-Is are shown in gray to better identify special sites. The features were identified in the α1 and α2 domains. The α-helix adjacent to the C terminus of the α1 domain forms an ∼88° flip absent in other MHC-I molecules. Additionally, 152F-155N in the α2 domain induce a significant upward shift. The map of these structurally differential amino acids is shown on the right. (D) Conserved amino acids involved in the interaction between Anca-UA*0101 and Anca-β2m. Amino acids involved in the interaction of HC with L chain (LC) include Y10, D55, and W60 of β2m that are conserved in human, chicken, green anole, frog, and grass carp. The RMSD values are labeled.
Superposition of pAnca-UA*0101 with the known pMHC-I of representative species (HLA-A*0201, PDB ID: 3I6K; pBF2*2101, PDB ID: 3BEW; pXela-UAAg, PDB ID: 6A2B; and pCtid-UAA*0102, PDB ID: 5H5Z) indicates that pAnca-UA*0101 is similar to chicken pBF2*2101 with a root mean square deviation (RMSD) of 0.917 Å, whereas the RMSD with the frog pXela-UAAg structure is 1.203 Å (Fig. 1D). The comparison of the PBG and β2m domains showed that the topological structure of each species is similar; however, unexpectedly, the α3 domain includes a characteristic offset in nonmammals (grass carp, frog, green anole, duck, and chicken) versus mammals (human, horse, and cat). In nonmammals, the α3 domain is closer to β2m, and the mammalian α3 domain is shifted away from β2m. This phenomenon directly changes the interaction mode of MHC-I and β2m and is associated with the interaction between pMHC-I and CD8 molecules (25). Additionally, the analysis of the interaction between Anca-UA*0101 and Anca-β2m indicated that the hydrogen bonds formed by Y10, D53, and W60 of β2m with MHC-I are highly conserved in almost all species (Fig. 1D, Supplemental Fig. 2).
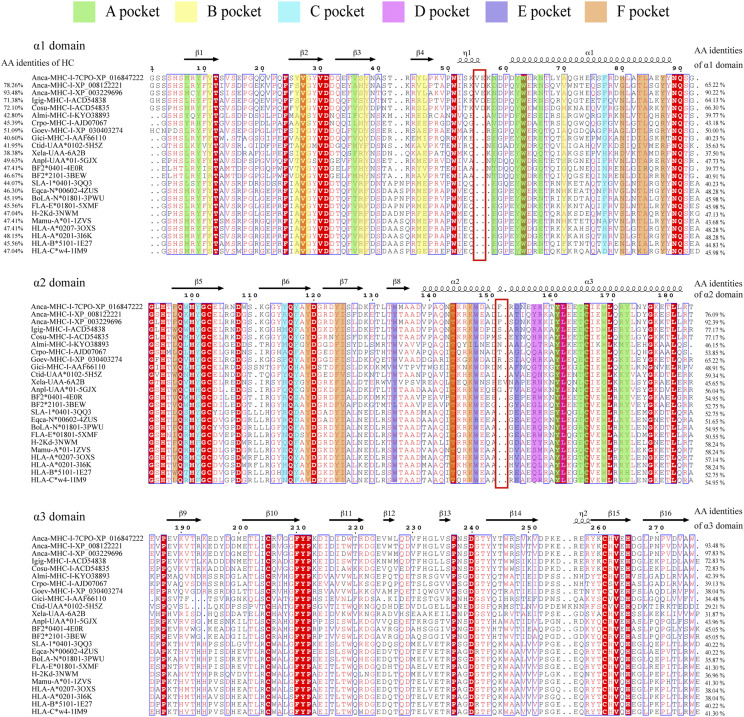
The amino acid sequence identity between Anca-UA*0101 and MHC-I from other species was <50%. The sequence differences between the species are reflected in the true topological structure, which can be used to define the pMHC-I structure in individual species in a scientifically significant manner. Comparison with the MHC-I sequences of other species indicated that the MHC-I sequence of reptilian lizards has an insertion of 2 aa (VE) at positions 55 and 56 (Fig. 2). The pushing force from 55-56VE triggers the flip of the α1 helix. Most of the nonmammalian MHC-I sequences have an insertion of 1–2 aa at positions 152 and 153 (Fig. 2). For example, amphibian African frogs have EV insertions, and reptiles generally have one additional amino acid at position 152. The insertion is reflected in the structure by the upward shift of the α2 helix. The mechanism of the influence of these differences on Ag presentation is addressed in detail below.
FIGURE 2.
Structure-based amino acid sequence alignment of MHC-I molecules of various jawed vertebrates and Anca-UA*0101. The first eight sequences belong to reptiles, of which the first five are lizards, and the rest are alligators and turtles (Anca-MHC-I: XP_016847233.1; Anca-MHC-I: XP_008122221.1; Anca-MHC-I: XP_003229696.2; Igig-MHC-I: ACD54838.1; Cosu-MHC-I: ACD54835.1; Almi-MHC-I: KYO38893.1; Crpo-MHC-I: AJD07067.1; Goev-MHC-I: XP_030403274.1; and Gici-MHC-I: AAF66110.1). The PDB IDs of the crystallized pMHC-I are annotated according to the names of the sequences. Species-specific characteristics of Anca-UA*0101 are shown in the red box. Residue positions contributing to the pockets are highlighted by pocket-specific–colored shading. The total amino acid identities between Anca-UA*0101 and the listed MHC-I molecules are shown at the beginning of each sequence, and the individual identities of the α1, α2, and α3 domains are listed at the end of the sequences.
The features of PBG in pAnca-UA*0101
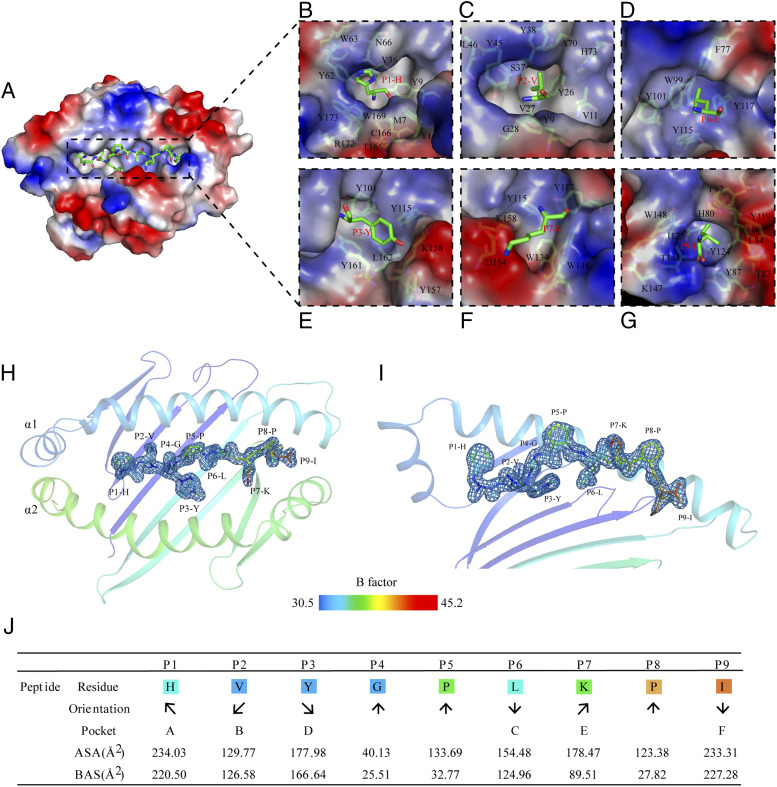
The PBG of pAnca-UA*0101 is divided into six pockets, from A to F (43). The A, B, and D pockets are weakly hydrophobic and neutrally charged, and the C, E, and F pockets are strongly hydrophobic and positively charged (Fig. 3A). The composition of the residues of six pockets is shown in Fig. 3B–G. The P1, P2, P6, and P9 side chains of the peptide HVYGPLKPI are directed inside the A, B, C, and F pockets, respectively, and the side chains of P5 and P8 extend out of the PBG into the solvent (Fig. 3H, 3I). The exposed ASA and buried surface area of the residues are shown in Fig. 3J. P1, P2, and P9 are deeply embedded in the A, B, and F pockets and are the main anchor amino acids involved in the peptide binding.
FIGURE 3.
Pocket composition and peptide orientation in the PBG of pAnca-UA*0101. (A) Surface view of the pAnca-UA*0101 PBG (blue, positively charged; red, negatively charged; and white, nonpolar). (B–G) Six pockets (A–F) in the surface polarity representation; the pocket residues are labeled with the corresponding amino acid abbreviations and sequence numbers. The peptides are shown as sticks. (H and I) Structure of the HVYGPLKPI peptide presented by Anca-UA*0101. Anca-UA*0101 is shown as a cartoon model and colored according to the B-factor; the peptide is shown as sticks and colored based on the isotropic B-factors; the electron densities of the peptide are shown in blue. (J) The orientation and location of the HVYGPLKPI peptide binding in the pocket of pAnca-UA*0101. The arrows pointing upward or downward represent the direction of the amino acid side chains toward the TCR or the MHC-I base, respectively. The arrows pointing left or right represent the amino acid side chains facing the α1 domain or α2 domain, respectively. ASA and buried surface area represent the exposed and buried surface areas of each peptide residue, respectively.
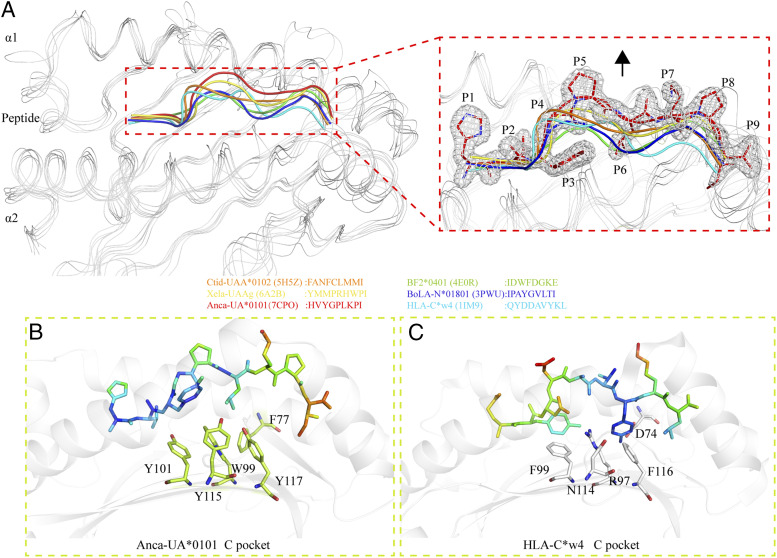
The PBG of pAnca-UA*0101 is mainly composed of the residues Y9, N66, H73, Y87, Y101, T144, K147, W148, D151, D154, K158, Y161, and Y173 that form a hydrogen bond and salt bridge network that interacts with the peptide. The hydrogen bonds formed between Y87, Y101, T144, K147, W148, Y161, and Y173 and the peptide are conserved in the pMHC-I of each representative species. These residues are mainly distributed in the A and F pockets, and the composition of the two pockets is also relatively conserved between the species. In contrast, the B pocket is more distinctive. V11 of pAnca-UA*0101 is smaller than the amino acids usually found at this position, i.e., mostly aromatic amino acids with large side chains such as F/Y in various species; however, this site in reptile lizards has small side chain residues, including S37 and A70. The B pocket composed of these small side chain amino acids has a larger space and can better accommodate various amino acids of the peptide. The C and D pockets in reptile lizards are different from those in other species and contain a higher number of aromatic amino acids. In particular, the C pocket is formed a by the benzene rings of large side chains of residues F77, W99, Y101, Y115, and Y117 (Fig. 4A, 4B) resulting in the shallow C, D, and E pockets. The peptide in pAnca-UA*0101 is in the M-type conformation; however, the position of the P5-P7 main chain is significantly shifted upwards compared with that in other species (Fig. 4A). The C pocket of human pHLA-C*w4 has only two side chain residues with benzene rings, F99 and F116, that provide the C pocket with a bulky volume conveniently accommodating the side chains of the nonapeptide (Fig. 4C). Therefore, the gap between the nonapeptide and C pocket in pAnca-UA*0101 is relatively large, whereas the nonapeptide and C pocket interact more closely in pHLA-C*w4 than in pAnca-UA*0101.
FIGURE 4.
Comparison of nonapeptides presented by MHC-I molecules from various species. (A) Comparison of HVYGPLKPI with other nonapeptides. The peptides are shown as ribbons of various colors depending on the species. The magnified inset on the right suggests that the HVYGPLKPI peptide of pAnca-UA*0101 has a floating main chain compared with nonapeptides of other representative species bound to MHC-I. HVYGPLKPI is shown as cartoons and sticks, and the electron densities are shown in white. (B and C) The relative positions of the residues of the C pocket and nonapeptide in pAnca-UA*0101 and HLA-C*w4. The peptides are shown as sticks and colored based on the isotropic B-factors. The C pocket residues of pAnca-UA*0101 and HLA-C*w4 are shown as sticks in lime green and white, respectively.
Different interaction modes between MHC-I and β2m in vertebrates
MHC-I sequence alignment of mammalian versus nonmammalian MHC-I molecules indicated that the latter is lacking two residues after aa 42 and one residue after aa 92 (Fig. 2). This feature is reflected in the structural shortening of the corresponding loop in the nonmammalian PBG of MHC-I molecules. The absence of two residues after position 42 leads to the shorter CD loops of nonmammalian MHC-I than those of mammalian MHC-I (Fig. 5A). We hypothesized that the AB loop orientations of nonmammalian and mammalian MHC-Is are different (26), and this hypothesis is confirmed by the structure of pAnca-UA*0101. The AB loop of pAnca-UA*0101 is similar to that in other nonmammals and has an extremely sharp turn toward β2m. The shortened CD loop of nonmammalian MHC-I is more distant from β2m than that of mammalian MHC-I. Moreover, mammalian PBG of pMHC-I has enhanced interaction with β2m mediated by a slightly longer downward CD loop, and the C sheet generally has an additional hydrogen bond compared with that in nonmammals (the binding site in CD loop: HLA-A*0207: 32Q and 35R; Eqca-N*00602: 32Q and 35R: Anca-UA*0101: 37S; and Anpl-UAA*01: 35R). The α3 domains of MHC-Is are closer to β2m in nonmammalian structures than that in the mammalian MHC-Is structures; thus, MHC-I and β2m interact more closely in nonmammalian MHC-Is, which is mainly reflected in the AB sheets. The α3 domain forms two additional hydrogen bonds with β2m compared with the bonds formed by mammalian MHC-I (the binding site in AB sheet: HLA-A*0207: 202R; Eqca-N*00602: 202R; Anca-UA*0101: 188E, 192T, 194K, and 206R; and Anpl-UAA*01: 185R, 187S, 200R, and 202H). The differences in the interactions between MHC-I and β2m in pAnca-UA*0101 and pHLA-A*0207 are shown in Fig. 5B, 5C.
FIGURE 5.
Differences in the interaction of MHC-I and β2m between mammalian and nonmammalian vertebrates. (A) Unique details of pMHC-I in nonmammals (green anole, pAnca-UA*0101, is shown in lime green; frog and duck are shown in light pink) are different from those in mammals (horse, dog, and human are shown in light blue). (B) Left, Overall structure of pAnca-UA*0101. Right, Hydrogen bonds between β2m and the HC in the α1, α2, and α3 domains. (C) Left, Overall structure of HLA-A*0207. Right, Hydrogen bonds between β2m and HC in domains α1, α2, and α3. The hydrogen bonds are represented by yellow dotted lines. The corresponding residues are labeled with amino acid abbreviations and primary sequence numbers.
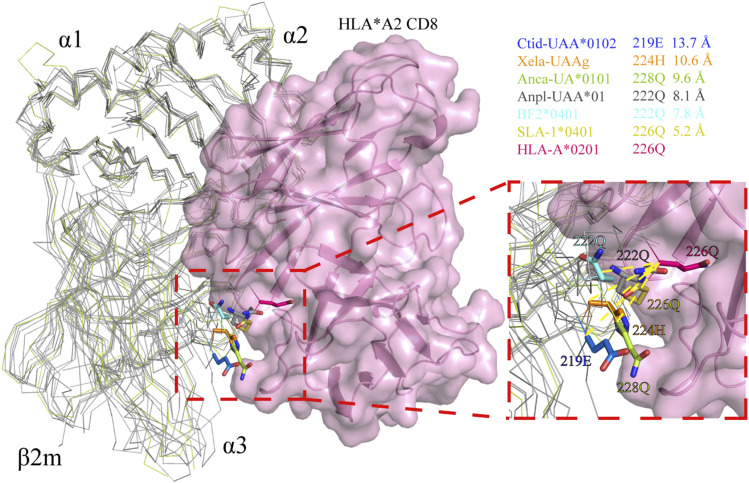
The enhancement of the interaction between the α3 domain and β2m in nonmammals corresponds to a shift in the CD loop of the α3 domain, which also affects the interaction between the α3 domain and CD8. We superposed the structures of pCtid-UAA*0102, pXela-UAAg, pAnca-UA*0101, pAnpl-UAA*01, BF2*0401, and SLA-1*0401 based on the known structure of the HLA-A2-CD8 complex (PDB ID: 1AKJ) and measured the distances between the core residues that play a critical role in binding to CD8αα (Fig. 6). In brief, the distance between E219 of the CD loop shift of pCtid-UAA*0102 and Q226 of HLA-A2 is ∼13.7 Å, and H224 of pXela-UAAg is ∼10.6 Å away from Q226 of HLA-A2; the distance between Q228 of the CD loop of pAnca-UA*0101 and Q226 of HLA-A2 is ∼9.6 Å. The distances from Q222 of pAnpl-UAA*01, Q222 of BF2*0401, and Q226 of SLA-1*0401 to Q226 of HLA-A2 are ∼8.1, 7.8, and 5.2 Å, respectively. The results indicate a shift in the α3 domain of pMHC-I from nonmammals to mammals, which corresponds to a specific CD8-binding pattern.
FIGURE 6.
Specific CD8-binding pattern of pAnca-UA*0101. The structures of pCtid-UAA*0102, pXela-UAAg, pAnca-UA*0101, pAnpl-UAA*01, BF2*0401, and SLA-1*0401 were superimposed based on the structure of the HLA-A2-CD8 complex (PDB ID: 1AKJ). Core residues that play a critical role in the binding to CD8αα are shown as sticks of various colors. The distance between E219 of the CD loop shift of pCtid-UAA*0102 and Q226 of HLA-A2 is ∼13.7 Å; H224 of pXela-UAAg is ∼10.6 Å away from Q226 of HLA-A2, and the distance between Q228 in the CD loop of pAnca-UA*0101 and Q226 in the CD loop of HLA-A2 is ∼9.6 Å. Additionally, the distances from Q222 of pAnpl-UAA*01, Q222 of BF2*0401, and Q226 of SLA-1*0401 to Q226 of HLA-A2 are ∼8.1, 7.8, and 5.2 Å, respectively.
The unique flip formed by the α1 helix
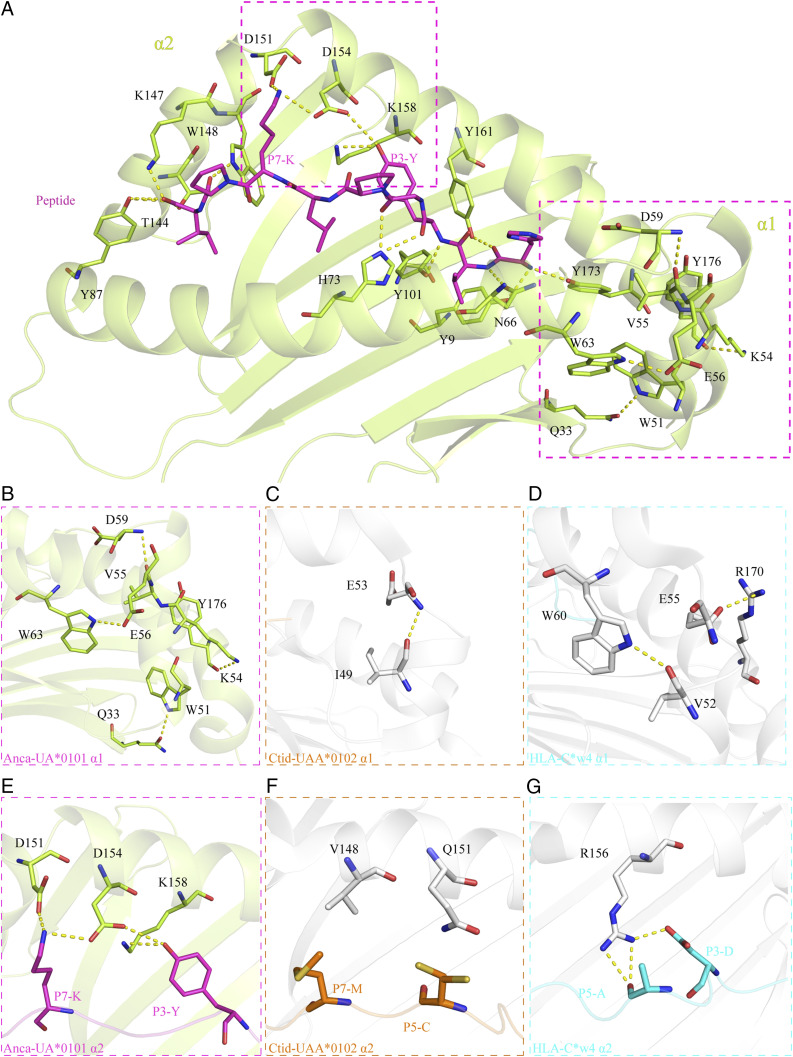
The insertion of 55-56VE in the Anca-UA*0101 PBG triggered a flip of ∼88° adjacent to the C terminus of the α1 helix domain, and a specific hydrogen-bonding network was formed in the PBG region. Thus, four pairs of the hydrogen bonds are formed between W51-Q33, K54-Y176, V55-D59, and E56-W63 (Fig. 7A). This hydrogen-bonded network enhances the interaction between the flipped α-helix and the α1 helix, α2 helix, and β-sheet to maintain the specific features of the pAnca-UA*0101 structure. Structural comparison with other known species indicates that the interaction between W51-Q33 of the pAnca-UA*0101 PBG is unique and strengthens the combination of α-helices and β-sheets, which is not present in other species. The E56-W63 interaction enhances the interaction with two α-helices in the α1 domain; however, this hydrogen bond is present in mammals (Fig. 7B). Analysis of the representative structures of bony fish pCtid-UAA*0102 and human pHLA-C*w4 indicates that pCtid-UAA*0102 has only one hydrogen bond, I49-E53, to strengthen the interaction between the α1 helix (Fig. 7C), and pHLA-C*w4 has two hydrogen bonds, V52-W60 and E55-R170, to enhance the bond between the α1 helix and α2 helix (Fig. 7D). In contrast, pAnca-UA*0101 appears to form a more stable hydrogen bond network.
FIGURE 7.
The hydrogen bond interactions between the peptide and PBG in pAnca-UA*0101 and two special hydrogen bond networks in the α1 and α2 domains. (A) The hydrogen bond interactions between the peptide and PBG in pAnca-UA*0101. PBG residues are labeled with amino acid abbreviations, and hydrogen bonds are shown as yellow dotted lines. (B–D) The hydrogen-bonding network formed by the α-helix adjacent to the C terminus of the α1 domain and the surrounding region in pAnca-UA*0101, pCtid-UAA*0102, and HLA-C*w4, respectively. (E–G) The hydrogen-bonding network formed by the α-helix adjacent to the C terminus of the α2 domain and the peptides in pAnca-UA*0101, pCtid-UAA*0102, and HLA-C*w4, respectively. The involved residues are shown as sticks.
The insertion of 152F enhances the interaction between the PBG and peptide
The insertion of 152F in Anca-UA*0101 leads to the upward shift of the α2 helix (aa 151–158) in the PBG thus forming a series of unique interactions with the peptide (Fig. 7A). D154 and K158 form two hydrogen bonds with P3-Y, and D151 and D154 form two salt bridges (Fig. 7E) with P7-K. The formation of these hydrogen bonds and salt bridges significantly improves the stability of the pAnca-UA*0101 PBG with peptide. However, the PBG of grass carp pCtid-UAA*0102 does not form hydrogen bonds and salt bridges with the peptide in the same region (Fig. 7F), and R156 of human pHLA-C*w4 forms only two hydrogen bonds with P3 and P5 of the antigenic peptide (Fig. 7G).
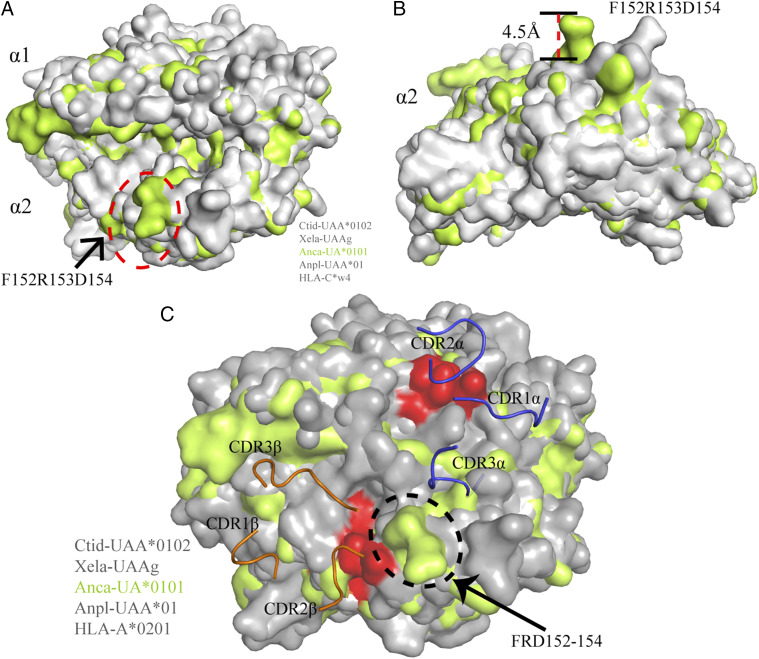
In contrast, the upward shift of the α2 helix changes the highest region of the pAnca-UA*0101 PBG. Superimposition of the PBG of pAnca-UA*0101 and other known pMHC-Is indicates that the upper region of the pAnca-UA*0101 PBG forms a bulge of ∼4.5 Å, which is also present in African frog pXela-UAA (26); this feature appears to be more conducive to the recognition of the PBG by TCRs (Fig. 8A, 8B). The structures of pCtid-UAA*0102, pXela-UAAg, pAnca-UA*0101, and pAnpl-UAA*01 were superimposed based on the structure of the pHLA-A2-TCR complex (PDB ID: 1BD2); the PBG residues important for the interaction between pMHC-I and TCR are shown in red. The 152F insertion in pAnca-UA*0101 increases the height of the helix and may improve the contact with TCRs (Fig. 8C).
FIGURE 8.
The presence of 152F changes the upper point of pAnca-UA*0101. (A) The superimposition of the α1 and α2 domains of pAnca-UA*0101 (lime green) with other representative pMHC-Is (gray) is shown in surface representation. The floating region (152F-D154) in the pAnca-UA*0101 α2 domain is circled by an ellipse marked by red dotted line. (B) View of the α2 domain on the side; the side chain of the shifted region in the α2 domain of Anca-UA*0101 is ∼4.5 Å upwards of that in other representative pMHC-I molecules. (C) The structures of pCtid-UAA*0102, pXela-UAAg, pAnca-UA*0101, and pAnpl-UAA*01 were superimposed based on the structure of the HLA-A2-TCR complex (PDB ID: 1BD2). The key residues important for the interaction between pMHC-I and TCR in the PBG are colored in red. Residues 152F-R153-D154 potentially contact the TCR and are circled by an ellipse marked with black dots.
Mutagenesis experiments
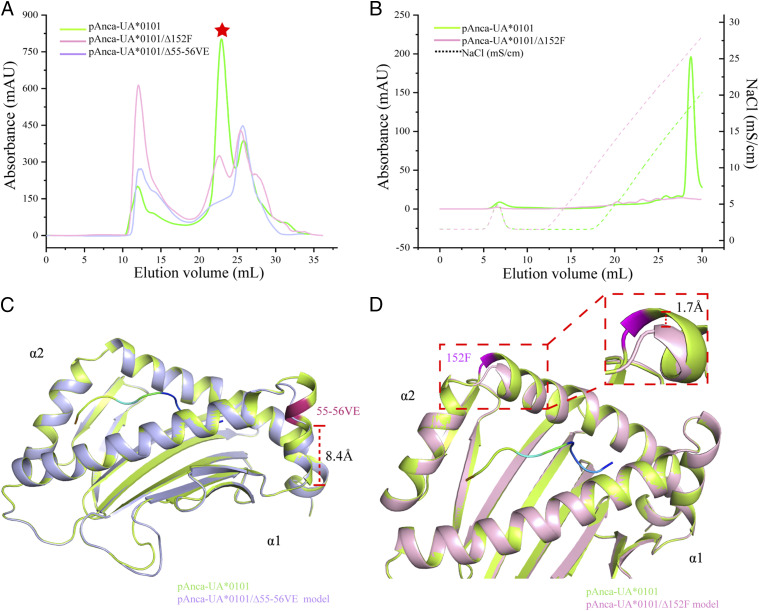
The results of the deletion mutagenesis experiment are shown in Fig. 9. Deletion of 55-56VE resulted in pAnca-UA*0101Δ55-56VE was difficult to assemble in vitro, and almost no complex was found after gel filtration (Fig. 9A). Deletion of 152F yielded pAnca-UA*0101Δ152F that could be assembled in vitro; however, the absence of 152F greatly reduced the refolding efficiency, and the complex was barely detectable after anion exchange chromatography (Fig. 9A, 9B). Moreover, the protein model of pAnca-UA *0101Δ55-56VE showed that the deletion of 55-56VE resulted in a long loop in the region, whereas the α1 helix region was shortened to ∼8.4 Å (Fig. 9C). Analysis of the protein model indicated that 152F deletion resulted in a decrease in the height of the α2 helix region by ∼1.7 Å (Fig. 9D).
FIGURE 9.
Assembly and protein structure modeling of pAnca-UA*0101Δ55-56VE and pAnca-UA*0101Δ152F. (A) Gel filtration chromatograms of Anca-UA*0101, Anca-UA*0101Δ152F, and Anca-UA*0101Δ55-56VE refolded in the presence of Anca-β2m and the peptide in vitro. The curves corresponding to pAnca-UA*0101, pAnca-UA*0101Δ152F, and pAnca-UA*0101Δ55-56VE are shown in green, pink, and purple, respectively, and the red star corresponds to the position of the pMHC-I peak. (B) Anion exchange chromatography of pAnca-UA*0101 and pAnca-UA*0101Δ152F. (C) Comparison of the pAnca-UA*0101Δ55-56VE model and pAnca-UA*0101 structure. pAnca-UA*0101 is green and pAnca-UA*0101Δ55-56VE is purple. The helix at the C terminus of the pAnca-UA*0101Δ55-56VE α1 domain is shortened to 8.4 Å. (D) Comparison of the pAnca-UA*0101Δ152F model and pAnca-UA*0101 structure. pAnca-UA*0101 is green, and pAnca-UA*0101Δ152F is pink. The panel on the right shows that height difference of the helical region in the red-dashed box is enlarged by 1.7 Å.
The peptide presentation profile of pAnca-UA*0101
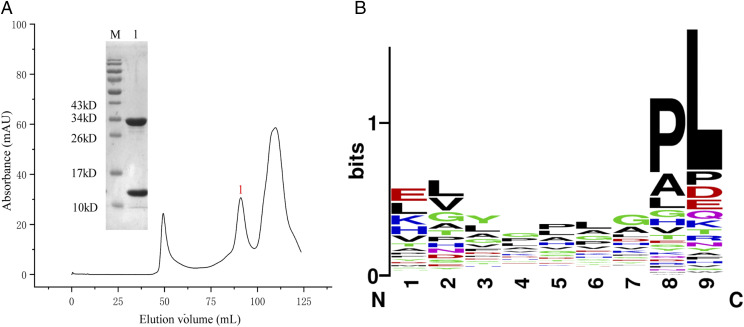
To confirm the peptide-binding motif of pAnca-UA*0101, Anca-UA*0101 and Anca-β2m were refolded with the Ran_9Xsplitted library. As shown in Fig. 10A, the pAnca-UA*0101 complex was prepared, and a total of 2335 bound nonapeptides were obtained as shown in Supplemental Table II. The results of the nonapeptide binding profile of pAnca-UA*0101 determined using the Ran_9Xsplitted library are shown in Fig. 10B. A peptide position with a higher Vs value was predicted to be a restricted position in the presentation (39). The Vs values were 0.90, 0.95, 0.75, 0.58, 0.66, 0.70, 0.81, 1.79, and 2.94 from P1 to P9, respectively, suggesting the presence of significantly restrictive features mainly in P2, P8, and P9. Therefore, the peptide-binding motif of pAnca-UA*0101 is X-L/I/V-XXXXX-P-I/L. Subsequently, four peptides (Supplemental Table I) were selected for refolding in vitro with Anca-UA*0101 and Anca-β2m. The complex of the nonapeptide HVYGPLKPI with Anca-UA*0101 and Anca-β2m enabled to obtain a crystal structure. In addition, we used a method previously reported by us (39) to screen the S and N proteins of three reptile lizard viruses (Shingleback nidovirus [GenBank: AOZ57154.1, AOZ57155.1]; Charleville sripuvirus [AZL49333.1, AZL49335.1, and AZL49338.1]; and iridovirus [Liz-CrIV: QEA08295.1]) to obtain 54 nonapeptides with high binding affinity to pAnca-UA*0101 (Table II).
FIGURE 10.
The result of liquid chromatography–tandem MS de novo analysis. (A) Gel filtration chromatograms of Anca-UA*0101 and Anca-β2m refolded in the presence of the Ran_9Xsplitted library in vitro. The abscissa axis corresponds to the peak volume (milliliter), and the ordinate axis corresponds to the UV signal (mAU). The insets show the analysis of the labeled peaks by reducing SDS-PAGE (15% gels). Lane M contains molecular mass markers. (B) Sequence logo showing the weighting probabilities of the amino acids at every position of the presented peptide.
Table II. Results of affinity prediction obtained using the scoring screening based on the binding of virus-derived peptides with pAnca-UA*0101.
| Protein of Virus | Location | Peptide | Score |
|---|---|---|---|
| Nidovirus (Shingleback nidovirus, spike protein, 1AOZ57154.1) | 279–287 aa | VVIRSTVPL | 8.207615151 |
| 406–414 aa | LGFNGTEPI | 7.822835473 | |
| 27–35 aa | WNVKYVPPI | 6.902269941 | |
| 4–12 aa | LVLVLCAAL | 6.539759642 | |
| 293–301 aa | LVQTFNDAL | 6.539759642 | |
| 62–70 aa | ELKQYNNII | 5.876599585 | |
| 641–649 aa | MLSYTAGIL | 5.876599585 | |
| 927–935 aa | MIKYTMALL | 5.876599585 | |
| 39–47 aa | VVRTVTDLL | 5.576518192 | |
| 88–96 aa | RVISPNSIL | 5.576518192 | |
| 245–253 aa | EVQPKYDLL | 5.576518192 | |
| 520–528 aa | LVQSIAQIL | 5.576518192 | |
| 666–674 aa | LVQQALDLI | 5.576518192 | |
| 936–944 aa | VVVAVLSLL | 5.576518192 | |
| 944–952 aa | LASVARTAL | 5.556342527 | |
| 505–513 aa | TTQEKATAL | 5.343536154 | |
| 663–671 aa | NTKLVQQAL | 5.343536154 | |
| 902–910 aa | ETINEDDAL | 5.343536154 | |
| 204–212 aa | VLPEIRSHI | 5.331900955 | |
| 273–281 aa | VLMIDGVVI | 5.264156347 | |
| 691–699 aa | NLRTSVKVL | 5.264156347 | |
| 841–849 aa | KLHSNDMVI | 5.264156347 | |
| 879–887 aa | DIGKFSTVL | 5.264156347 | |
| 933–841 aa | ALLVVVAVL | 5.264156347 | |
| Nidovirus (Shingleback nidovirus, membrane protein, AOZ57155.1) | 107–115 aa | KIAFSLFII | 5.876599585 |
| 113–121 aa | FIIITIALI | 5.876599585 | |
| 114–122 aa | IIITIALIL | 5.876599585 | |
| 144–152 aa | AIASPRAII | 5.876599585 | |
| 53–61 aa | VVVFLFDIL | 5.576518192 | |
| 83–91 aa | LVKLLFFLI | 5.576518192 | |
| 143–151 aa | IAIASPRAI | 5.556342527 | |
| 40–48 aa | STQDTLVAL | 5.343536154 | |
| 73–81 aa | FTRQIAKAI | 5.343536154 | |
| 117–125 aa | TIALILFVL | 5.264156347 | |
| Sripuvirus (Charleville virus, nucleoprotein, AZL49333.1) | 361–369 aa | DSDAEDEPI | 6.500907378 |
| 302–310 aa | WVHSVGSLL | 5.576518192 | |
| Sripuvirus (Charleville virus, glycoprotein, AZL49338.1) | 58–66 aa | GTLPFLIPL | 7.011391663 |
| 38–46 aa | NHTSLRCPI | 6.912538276 | |
| 158–166 aa | YNLDFVDPI | 6.902269941 | |
| 6–14 aa | GIFAILLAL | 6.839841034 | |
| 483–491 aa | LLYLIYFAL | 6.839841034 | |
| 56–64 aa | RVGTLPFLI | 5.576518192 | |
| 2–10 aa | YPNYGIFAI | 5.30480376 | |
| 452–460 aa | RGEMDLDLL | 5.191738514 | |
| 380–388 aa | WVPTGVSGI | 5.121616232 | |
| Iridovirus (iridovirus Liz-CrIV, major capsid protein, QEA08295.1) | 282–290 aa | APRHVWNPI | 6.972659269 |
| 192–200 aa | GVALPTAAL | 6.539759642 | |
| 340–348 aa | PSTGAFDPI | 6.500907378 | |
| 175–183 aa | PEADLNLPL | 6.199251679 | |
| 152–160 aa | MIGNISALI | 5.876599585 | |
| 330–338 aa | VITSTTVIL | 5.876599585 | |
| 250–258 aa | GTVWGNYAI | 5.343536154 | |
| 267–275 aa | MGCSVRDIL | 5.191738514 | |
| 297–305 aa | YDIRFSHAI | 5.093816102 |
Discussion
The pAnca-UA*0101 structure from reptile was elucidated for the first time by determining the crystal structure and analyzing the function of the peptide presentation profile of pAnca-UA*0101. Unique characteristics of the sequences and structures of Anca-UA*0101 and Anca-β2m represent some common features of reptilian pMHC-I. We have detected the insertion of 55-56VE in pAnca-UA*0101 that directly leads to the large angle flip of the α1 helix in the PBG resulting in the formation of a hydrogen-bonding network that stabilizes the pAnca-UA*0101 structure. Additionally, 152F enhances the interaction between the α2 helix and the peptide in pAnca-UA*0101. The data of the deletion mutagenesis of 55-56VE indicated that pAnca-UA*0101Δ55-56VE was difficult to assemble; thus, the VE insertion in the α-1 helix is important for the formation of pMHC-I. Analysis of the pAnca-UA*0101Δ55-56VE model indicated the formation of a long loop in the absence of 55-56VE that may explain the inability to form a complex by Anca-UA*0101Δ55-56VE due to increased flexibility of the loop region (Fig. 9C). Additionally, 152F deletion substantially decreased the refolding efficiency of pAnca-UA*0101Δ152F, and the complex was barely detectable after anion exchange chromatography (Fig. 9B). Analysis of the pAnca-UA*0101Δ152F model indicated that the number of hydrogen bonds interacting with the peptide in pAnca-UA*0101Δ152F was reduced. Deletion experiments confirmed the important role of the insertions of 55-56VE and 152F in the formation of the pAnca-UA*0101 complex. We also detected a number of differences in the sequences of MHC-I molecules between various reptile species. The identity of the MHC-I sequences of green anole lizard and iguana was ∼72%, and the identity of sequences of crocodile and tortoise was <51%. Therefore, not all reptiles have the 55-56VE insertion into pMHC-I.
The sequence identity of green anole lizard MHC-I molecules with four other classes of vertebrates, including fish (nurse shark and grass carp), amphibians (African frog), birds, and mammals, is <50%, and there are two prominent differences. First, comparison with the known sequences of mammalian MHC-1 molecules indicated 2 aa deletions after position 42 and 1 aa deletion after position 92 in grass carp, frog, lizard, and chicken MHC-I molecules. Structural analysis showed that the absence of these two regions leads to the shortening of the loops in the PBG region of pMHC-I. Thus, the length of the loops can be used as an important structural feature to distinguish nonmammalian and mammalian pMHC-I based on the available data on the pMHC-I structure. Second, frog, lizard, and chicken pMHC-I structures have an insertion of 1–2 aa after position 151, which leads to an upward shift of the α2 helix of pMHC-I. This shift is also involved in the interaction with the TCR, and may lead to the formation of relatively different TCR-docking modes of MHC-I. Additionally, the presence of the benzene ring C pocket in pAnca-UA*0101 causes an upward shift of the main peptide chain (Fig. 4A), which may account for extensive TCR docking.
The noncovalent bonding between MHC-I and β2m is clearly similar in the five classes of vertebrates; however, certain differences in the specific binding modes between the five vertebrate structures may influence the interaction mode between the CD loop of the MHC-I α3 domain and the CD8 molecule. Chen et al. (25) found that the interaction interface between MHC-I and β2m in carp and chicken was larger than that in mammals. Considering that the relative position of the pMHC-I α3 domain in the carp structure is shifted toward β2m, the binding mode of pMHC-I-CD8 in grass carp was hypothesized to be different from that in humans and mice. Our previous study demonstrated that the identity of CD8 coreceptors among species is low; however, the trend of their topological structure is very similar, and the interaction region between CD8 and pMHC is relatively conservative (38, 44). Ma et al. (26) suggested that the interaction between MHC-I and CD8 molecules in nonmammals is different from that in mammals based on the analysis of the distances between the CD loop shifts in the structures of nonmammals and mammals. The present study adds the structural data of reptilian pAnca-UA*0101. Notably, the interactions between the nonmammalian MHC-I α3 domain and β2m are generally stronger than that in the mammalian structures, further adding evidence that the interaction between MHC-I α3 domain and CD8 molecule in nonmammals is different from that in mammals.
The spread of West Nile virus attracted considerable attention to the studies of reptiles as reservoir hosts (45, 46), and the prediction of the pMHC-I peptide-binding profiles will be beneficial for the understanding of the T cell immunity. The application of liquid chromatography–tandem MS has created opportunities for the determination of the pMHC-I peptide-binding profiles (39). Currently, the corresponding peptide profiles of African frogs and bats have been obtained using this method (26, 39), and the peptide-binding motifs can be determined by peptide profiles and used to predict the epitopes. In this study, the peptide presentation profile and motif of pAnca-UA*0101 were also confirmed. The data of our preliminary experiments indicated that the presence of the binding motif in the nonapeptide library is sufficient for partial binding of 8-mer and 10-mer peptides. Because the motif is derived from the random nonapeptide library, the result obtained using the 9-mer peptides are more accurate and reliable; thus, only the results obtained using 9-mer peptides are shown (Fig. 10). Analysis of existing peptide profiles of various species indicated that F pockets generally have a binding preference for L/I, which may be related to high conservation of amino acids in F pockets. The anchoring of F pockets is crucial to the binding of the epitopes, and the L/I preference may stimulate the development of the applications of epitope vaccine immunization.
In conclusion, this study describes the unique features of pAnca-UA*0101 of green anole lizard using the analysis of the structure and Ag presentation function to demonstrate the differences in pMHC-I in reptiles; our data provide a foundation for the subsequent analysis of MHC evolution and applications related to T cell immunity in the animal kingdom.
Supplementary Material
Acknowledgments
We acknowledge the assistance of the staff of the Shanghai Synchrotron Radiation Facility of China.
This work was supported by National Natural Science Foundation of China Grants 31972683 and 31572493.
The protein structure presented in this article has been submitted to the Protein Data Bank (http://www.rcsb.org/pdb/home/home.do) under accession number 7CPO.
The online version of this article contains supplemental material.
- ASA
- accessible surface area
- HC
- H chain
- ID
- identification number
- β2m
- β2 microglobulin
- MHC-I
- MHC class I
- MHC-II
- MHC class II
- MS
- mass spectrometry
- PBG
- peptide-binding groove
- PDB
- Protein Data Bank
- pMHC-I
- peptide–MHC-I–β2m
- RMSD
- root mean square deviation
- TFA
- trifluoroacetic acid
- Vs
- coefficient of variation.
Disclosures
The authors have no financial conflicts of interest.
References
- 1.Flajnik, M. F. 2018. A cold-blooded view of adaptive immunity. Nat. Rev. Immunol. 18: 438–453. [DOI] [PMC free article] [PubMed] [Google Scholar]
- 2.Modesto, S. P. 2020. Rooting about reptile relationships. Nat. Ecol. Evol. 4: 10–11. [DOI] [PubMed] [Google Scholar]
- 3.Zimmerman, L. M., Vogel L. A., Bowden R. M.. 2010. Understanding the vertebrate immune system: insights from the reptilian perspective. J. Exp. Biol. 213: 661–671. [DOI] [PubMed] [Google Scholar]
- 4.Motani, R. 2009. The evolution of marine reptiles. Evolution Education and Outreach 2: 224–235. [Google Scholar]
- 5.Flajnik, M. F., Kasahara M.. 2010. Origin and evolution of the adaptive immune system: genetic events and selective pressures. Nat. Rev. Genet. 11: 47–59. [DOI] [PMC free article] [PubMed] [Google Scholar]
- 6.Wei, Z., Wu Q., Ren L., Hu X., Guo Y., Warr G. W., Hammarström L., Li N., Zhao Y.. 2009. Expression of IgM, IgD, and IgY in a reptile, Anolis carolinensis. J. Immunol. 183: 3858–3864. [DOI] [PubMed] [Google Scholar]
- 7.Benacerraf, B. 1981. Role of MHC gene products in immune regulation. Science 212: 1229–1238. [DOI] [PubMed] [Google Scholar]
- 8.Horton, R., Wilming L., Rand V., Lovering R. C., Bruford E. A., Khodiyar V. K., Lush M. J., Povey S., Talbot C. C. Jr., Wright M. W., et al. 2004. Gene map of the extended human MHC. Nat. Rev. Genet. 5: 889–899. [DOI] [PubMed] [Google Scholar]
- 9.Bourlet, Y., Béhar G., Guillemot F., Fréchin N., Billault A., Chaussé A. M., Zoorob R., Auffray C.. 1988. Isolation of chicken major histocompatibility complex class II (B-L) beta chain sequences: comparison with mammalian beta chains and expression in lymphoid organs. EMBO J. 7: 1031–1039. [DOI] [PMC free article] [PubMed] [Google Scholar]
- 10.Hashimoto, K., Nakanishi T., Kurosawa Y.. 1990. Isolation of carp genes encoding major histocompatibility complex antigens. Proc. Natl. Acad. Sci. USA 87: 6863–6867. [DOI] [PMC free article] [PubMed] [Google Scholar]
- 11.Flajnik, M. F., Kaufman J. F., Riegert P., Du Pasquier L.. 1984. Identification of class I major histocompatibility complex encoded molecules in the amphibian Xenopus. Immunogenetics 20: 433–442. [DOI] [PubMed] [Google Scholar]
- 12.Grossberger, D., Parham P.. 1992. Reptilian class I major histocompatibility complex genes reveal conserved elements in class I structure. Immunogenetics 36: 166–174. [DOI] [PubMed] [Google Scholar]
- 13.Wittzell, H., Madsen T., Westerdahl H., Shine R., von Schantz T.. 1998-1999. MHC variation in birds and reptiles. Genetica 104: 301–309. [DOI] [PubMed] [Google Scholar]
- 14.Olsson, M., Madsen T., Nordby J., Wapstra E., Ujvari B., Wittsell H.. 2003. Major histocompatibility complex and mate choice in sand lizards. Proc. Biol. Sci. 270(Suppl. 2): S254–S256. [DOI] [PMC free article] [PubMed] [Google Scholar]
- 15.Alföldi, J., Di Palma F., Grabherr M., Williams C., Kong L., Mauceli E., Russell P., Lowe C. B., Glor R. E., Jaffe J. D., et al. 2011. The genome of the green anole lizard and a comparative analysis with birds and mammals. Nature 477: 587–591. [DOI] [PMC free article] [PubMed] [Google Scholar]
- 16.Wang, Z., Pascual-Anaya J., Zadissa A., Li W., Niimura Y., Huang Z., Li C., White S., Xiong Z., Fang D., et al. 2013. The draft genomes of soft-shell turtle and green sea turtle yield insights into the development and evolution of the turtle-specific body plan. [Published erratum appears in 2014 Nat. Genet. 46: 657.] Nat. Genet. 45: 701–706. [DOI] [PMC free article] [PubMed] [Google Scholar]
- 17.Shaffer, H. B., Minx P., Warren D. E., Shedlock A. M., Thomson R. C., Valenzuela N., Abramyan J., Amemiya C. T., Badenhorst D., Biggar K. K., et al. 2013. The western painted turtle genome, a model for the evolution of extreme physiological adaptations in a slowly evolving lineage. Genome Biol. 14: R28. [DOI] [PMC free article] [PubMed] [Google Scholar]
- 18.Castoe, T. A., de Koning A. P., Hall K. T., Card D. C., Schield D. R., Fujita M. K., Ruggiero R. P., Degner J. F., Daza J. M., Gu W., et al. 2013. The Burmese python genome reveals the molecular basis for extreme adaptation in snakes. [Published erratum appears in 2013 Proc. Natl. Acad. Sci. USA 110; Published erratum appears in 2014 Proc. Natl. Acad. Sci. USA 111: 3194.] Proc. Natl. Acad. Sci. USA 110: 20645–20650. [DOI] [PMC free article] [PubMed] [Google Scholar]
- 19.Green, R. E., Braun E. L., Armstrong J., Earl D., Nguyen N., Hickey G., Vandewege M. W., St John J. A., Capella-Gutiérrez S., Castoe T. A., et al. 2014. Three crocodilian genomes reveal ancestral patterns of evolution among archosaurs. Science 346: 1254449. [DOI] [PMC free article] [PubMed] [Google Scholar]
- 20.Deakin, J. E., Ezaz T.. 2019. Understanding the evolution of reptile chromosomes through applications of combined cytogenetics and genomics approaches. Cytogenet. Genome Res. 157: 7–20. [DOI] [PubMed] [Google Scholar]
- 21.Jaratlerdsiri, W., Deakin J., Godinez R. M., Shan X., Peterson D. G., Marthey S., Lyons E., McCarthy F. M., Isberg S. R., Higgins D. P., et al. 2014. Comparative genome analyses reveal distinct structure in the saltwater crocodile MHC. PLoS One 9: e114631. [DOI] [PMC free article] [PubMed] [Google Scholar]
- 22.Ansari, T. H., Bertozzi T., Miller R. D., Gardner M. G.. 2015. MHC in a monogamous lizard--Characterization of class I MHC genes in the Australian skink Tiliqua rugosa. Dev. Comp. Immunol. 53: 320–327. [DOI] [PubMed] [Google Scholar]
- 23.Miller, H. C., O’Meally D., Ezaz T., Amemiya C., Marshall-Graves J. A., Edwards S.. 2015. Major histocompatibility complex genes map to two chromosomes in an evolutionarily ancient reptile, the tuatara Sphenodon punctatus. G3 (Bethesda) 5: 1439–1451. [DOI] [PMC free article] [PubMed] [Google Scholar]
- 24.Li, Z., Zhang N., Ma L., Zhang L., Meng G., Xia C.. 2020. The mechanism of β2m molecule-induced changes in the peptide presentation profile in a bony fish. iScience 23: 101119. [DOI] [PMC free article] [PubMed] [Google Scholar]
- 25.Chen, Z., Zhang N., Qi J., Chen R., Dijkstra J. M., Li X., Wang Z., Wang J., Wu Y., Xia C.. 2017. The structure of the MHC class I molecule of bony fishes provides insights into the conserved nature of the antigen-presenting system. J. Immunol. 199: 3668–3678. [DOI] [PMC free article] [PubMed] [Google Scholar]
- 26.Ma, L., Zhang N., Qu Z., Liang R., Zhang L., Zhang B., Meng G., Dijkstra J. M., Li S., Xia M. C.. 2020. A glimpse of the peptide profile presentation by Xenopus laevis MHC class I: crystal structure of pXela-UAA reveals a distinct peptide-binding groove. J. Immunol. 204: 147–158. [DOI] [PMC free article] [PubMed] [Google Scholar]
- 27.Li, X., Zhang L., Liu Y., Ma L., Zhang N., Xia C.. 2020. Structures of the MHC-I molecule BF2*1501 disclose the preferred presentation of an H5N1 virus-derived epitope. J. Biol. Chem. 295: 5292–5306. [DOI] [PMC free article] [PubMed] [Google Scholar]
- 28.Zhang, L., Li X., Ma L., Zhang B., Meng G., Xia C.. 2020. A newly recognized pairing mechanism of the α- and β-chains of the chicken peptide-MHC class II complex. J. Immunol. 204: 1630–1640. [DOI] [PMC free article] [PubMed] [Google Scholar]
- 29.Nguyen, T. B., Jayaraman P., Bergseng E., Madhusudhan M. S., Kim C. Y., Sollid L. M.. 2017. Unraveling the structural basis for the unusually rich association of human leukocyte antigen DQ2.5 with class-II-associated invariant chain peptides. J. Biol. Chem. 292: 9218–9228. [DOI] [PMC free article] [PubMed] [Google Scholar]
- 30.Zhao, M., Liu K., Luo J., Tan S., Quan C., Zhang S., Chai Y., Qi J., Li Y., Bi Y., et al. 2018. Heterosubtypic protections against human-infecting avian influenza viruses correlate to biased cross-T-cell responses. mBio 9: e01408-18. [DOI] [PMC free article] [PubMed] [Google Scholar]
- 31.Kaufman, J. 2018. Unfinished business: evolution of the MHC and the adaptive immune system of jawed vertebrates. Annu. Rev. Immunol. 36: 383–409. [DOI] [PubMed] [Google Scholar]
- 32.Vasilakis, N., Tesh R. B., Widen S. G., Mirchandani D., Walker P. J.. 2019. Genomic characterisation of Cuiaba and Charleville viruses: arboviruses (family Rhabdoviridae, genus Sripuvirus) infecting reptiles and amphibians. Virus Genes 55: 87–94. [DOI] [PubMed] [Google Scholar]
- 33.Papp, T., Marschang R. E.. 2019. Detection and characterization of invertebrate iridoviruses found in reptiles and prey insects in Europe over the past two decades. Viruses 11: 600. [DOI] [PMC free article] [PubMed] [Google Scholar]
- 34.Ariel, E. 2011. Viruses in reptiles. Vet. Res. (Faisalabad) 42: 100. [DOI] [PMC free article] [PubMed] [Google Scholar]
- 35.Petersen, L. R., Brault A. C., Nasci R. S.. 2013. West Nile virus: review of the literature. JAMA 310: 308–315. [DOI] [PMC free article] [PubMed] [Google Scholar]
- 36.Marschang, R. E. 2011. Viruses infecting reptiles. Viruses 3: 2087–2126. [DOI] [PMC free article] [PubMed] [Google Scholar]
- 37.Liang, R., Sun Y., Liu Y., Wang J., Wu Y., Li Z., Ma L., Zhang N., Zhang L., Wei X., et al. 2018. Major histocompatibility complex class I (FLA-E*01801) molecular structure in domestic cats demonstrates species-specific characteristics in presenting viral antigen peptides. J. Virol. 92: e01631-17. [DOI] [PMC free article] [PubMed] [Google Scholar]
- 38.Wang, J., Zhang N., Wang Z., Yanan W., Zhang L., Xia C.. 2018. Structural insights into the evolution feature of a bony fish CD8αα homodimer. Mol. Immunol. 97: 109–116. [DOI] [PubMed] [Google Scholar]
- 39.Qu, Z., Li Z., Ma L., Wei X., Zhang L., Liang R., Meng G., Zhang N., Xia C.. 2019. Structure and peptidome of the bat MHC class I molecule reveal a novel mechanism leading to high-affinity peptide binding. J. Immunol. 202: 3493–3506. [DOI] [PMC free article] [PubMed] [Google Scholar]
- 40.Caron, E., Kowalewski D. J., Chiek Koh C., Sturm T., Schuster H., Aebersold R.. 2015. Analysis of major histocompatibility complex (MHC) immunopeptidomes using mass spectrometry. Mol. Cell. Proteomics 14: 3105–3117. [DOI] [PMC free article] [PubMed] [Google Scholar]
- 41.Wu, Y., Wang J., Fan S., Chen R., Liu Y., Zhang J., Yuan H., Liang R., Zhang N., Xia C.. 2017. Structural definition of duck major histocompatibility complex class I molecules that might explain efficient cytotoxic T lymphocyte immunity to influenza A virus. J. Virol. 91: e02511-16. [DOI] [PMC free article] [PubMed] [Google Scholar]
- 42.Toth, E. A. 2007. Molecular replacement. Methods Mol. Biol. 364: 121–148. [DOI] [PubMed] [Google Scholar]
- 43.Saper, M. A., Bjorkman P. J., Wiley D. C.. 1991. Refined structure of the human histocompatibility antigen HLA-A2 at 2.6 A resolution. J. Mol. Biol. 219: 277–319. [DOI] [PubMed] [Google Scholar]
- 44.Liu, Y., Li X., Qi J., Zhang N., Xia C.. 2016. The structural basis of chicken, swine and bovine CD8αα dimers provides insight into the co-evolution with MHC I in endotherm species. Sci. Rep. 6: 24788. [DOI] [PMC free article] [PubMed] [Google Scholar]
- 45.Jacobson, E. R., Ginn P. E., Troutman J. M., Farina L., Stark L., Klenk K., Burkhalter K. L., Komar N.. 2005. West Nile virus infection in farmed American alligators (Alligator mississippiensis) in Florida. J. Wildl. Dis. 41: 96–106. [DOI] [PubMed] [Google Scholar]
- 46.Farfán-Ale, J. A., Blitvich B. J., Marlenee N. L., Loroño-Pino M. A., Puerto-Manzano F., García-Rejón J. E., Rosado-Paredes E. P., Flores-Flores L. F., Ortega-Salazar A., Chávez-Medina J., et al. 2006. Antibodies to West Nile virus in asymptomatic mammals, birds, and reptiles in the Yucatan Peninsula of Mexico. Am. J. Trop. Med. Hyg. 74: 908–914. [PubMed] [Google Scholar]
Associated Data
This section collects any data citations, data availability statements, or supplementary materials included in this article.


