

Abstract
Alpha-pyrrolidinovalerophenone (alpha-PVP), a novel psychoactive substance, has widespread recreational use. This with interest in its pharmacological effects creates a need for methods that measure alpha-PVP concentrations. We therefore developed an LC–MS-MS method that can quantitate alpha-PVP and 2-oxo-PVP in rat plasma using a 0.1-mL sample volume. Addition of internal standards (2.5 ng/mL alpha-PVP-d8/2-oxo-PVP-d6) was followed by liquid–liquid extraction with 1-chlorobutane:acetonitrile (4:1), evaporation and reconstitution with 0.1% formic acid. Extracts were analyzed by LC–MS-MS using an Agilent 1100 HPLC and a Thermo Scientific TSQ Quantum Access MS-MS, with a YMC ODS-AQ, 50 mm × 2 mm, 3 μm column. The mobile phase was 0.1% formic acid:acetonitrile gradient at a 0.2-mL/minute flow rate with positive ion electrospray. SRM was used for the analysis with transitions: alpha-PVP, 232 → 91; alpha-PVP-d8, 240 → 91; 2-oxo-PVP, 246 → 91; 2-oxo-PVP-d6, 252 → 91. Alpha-PVP and 2-oxo-PVP eluted at 6.4 and 8.9 min. Calibrators range from 0.25 to 500 ng/mL. Accuracy and precision evaluated quality control samples prepared at 0.75, 10 and 400 ng/mL. The intra-assay evaluation also included the 0.25-ng/mL LOQs prepared in six different blank plasma sources. The intra-assay accuracy ranged from 88.9 to 117.8% of the target, and the intra-assay precision ranged from 0.9 to 16.0%. The inter-assay accuracy ranged from 98.7 to 110.7% of the target, and the inter-assay precision ranged from 4.5 to 12.0%. Extraction recovery was at least 52% for alpha-PVP and 67% for 2-oxo-PVP. Ionization recoveries were at least 64% for alpha-PVP and 82% for 2-oxo-PVP. These losses did not adversely affect assay performance. Alpha-PVP and 2-oxo-PVP controls were stable at room temperature for up to 24 h and frozen for at least 36 days. Alpha-PVP and 2-oxo-PVP were also stable in processed samples (extracts) stored at room temperature for at least 24 days. The procedure was used to analyze rat plasma samples from a pharmacokinetic study.
Introduction
The worldwide use of novel psychoactive substance (NPS) compounds has increased tremendously in the past decade (1). NPS compounds are critical challenges to the clinical and forensic toxicology fields. The NPS use patterns constantly change as drug dealers and users are introducing and using new compounds as older ones become scheduled and regulated. Often, there is limited clinical, pharmacokinetic and toxicity information on the specific NPS compounds. Analytical toxicology laboratories need to constantly develop new analytical methods as new NPS compounds are introduced. Chemical compounds related to cathinone have been popular NPS compounds in recent years (2, 3). These compounds are strong central nervous system stimulants and produce euphoric effects. One such compound, alpha-pyrrolidinovalerophenone (alpha-PVP) (Figure 1), was first reported to be used between 2013 and 2016 (4, 5, 6). In clandestine circles, alpha-PVP has been known as flakka, gravel or one of the bath salts. In addition to inducing euphoria, low doses of alpha-PVP can increase alertness and improve cognitive functions (7). Higher doses and persistent use have the potential to cause severe anxiety, aggressive behavior and stimulant-induced psychosis characterized by delusions. Alpha-PVP overdose has caused death (8, 9). Since 2014, the US Drug Enforcement Administration has put alpha-PVP under Schedule I regulation. Research studies showed that alpha-PVP is a potent inhibitor of dopamine and norepinephrine reuptake and does not inhibit serotonin reuptake (7, 10, 11). Examination of urine collected from human alpha-PVP users has demonstrated the presence of several metabolites of alpha-PVP. It is thought that the two metabolites are 2-oxo-PVP (PVP lactam) (Figure 1) and β-OH-PVP (12). It is not yet known if any of the metabolites contribute to the pharmacological activity of alpha-PVP (7).
Figure 1.
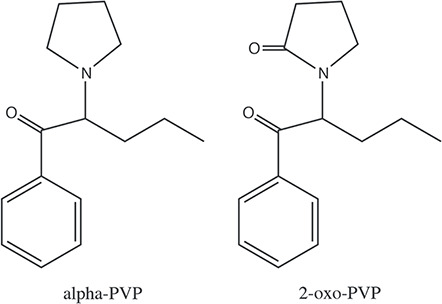
Chemical structures of alpha-PVP and 2-oxo-PVP.
The illicit use of alpha-PVP and interest in its pharmacological actions have created a need for effective analytical methods to test for alpha-PVP in biological samples. Mass spectrometry that is preceded by either gas chromatography or liquid chromatography is recognized as the most sound means to analyze for drugs and metabolites in biological samples. One report used gas chromatography–mass spectrometry (GC–MS) to analyze for alpha-PVP in a blood sample from a poisoning case (9). However, alpha-PVP and other cathinone-related compounds have been shown to undergo thermal decomposition (13). Liquid chromatography–mass spectrometry (LC-MS) has been used to analyze for alpha-PVP in blood (14, 15), urine (15, 16, 17), and oral fluid (18). Often, alpha-PVP is included as part of an analytical method that tests for a panel of synthetic cathinones and other psychoactive stimulants.
We have developed a procedure that measured alpha-PVP and its metabolite 2-oxo-PVP in rat plasma sample by liquid chromatography–triple quadrupole mass spectrometry (LC–MS-MS). Rat plasma samples from pharmacokinetic studies were analyzed by the method. To the best of our knowledge, this is the first report of a method that analyzes alpha-PVP and 2-oxo-PVP in plasma samples. This method was developed as part of a contract requirement for the sponsor. They provided the metabolite 2-oxo-PVP. While many other metabolites are known, they are not readily available, thus the inclusion of 2-oxo-PVP.
Materials and Methods
Chemicals and reagents
Alpha-PVP and alpha-PVP-d8 were obtained from Cerilliant (Round Rock, TX, USA). 2-Oxo-PVP and 2-oxo-PVP-d6 were obtained from Toronto Research Chemicals, Inc. (Toronto, Ontario, Canada). Ammonium hydroxide and formic acid were obtained from Fisher (Fairlawn, NJ, USA). 1-Chlorobutane was obtained from EMD Millipore (Billerica, MA, USA). LC–MS-grade acetonitrile and methanol were obtained from Burdick & Jackson (Muskegon, MI, USA). Rat plasma was obtained from BioChemed (Winchester, VA, USA).
Preparation of plasma calibration standards and plasma quality controls
A 1000-ng/mL alpha-PVP/2-oxo-PVP working solution was prepared with methanol and serially diluted to 100, 10 and 1 ng/mL. Separate working solution sets were used to prepare the calibration standards and quality controls. The working solutions were added to separate 16 × 100-mm glass culture tubes that contained 0.1 mL blank plasma for calibration standards with the following concentrations: 0.25, 0.5, 1.0, 2.5, 5.0, 10, 50, 100, 250 and 500 ng/mL. The controls were prepared at 0.75, 10 and 400 ng/mL. The controls were prepared in bulk batches and were stored frozen as 0.1-mL aliquots.
Extraction
A separate glass 16 × 100-mm culture tube was used for each calibrator, control, blank and research sample. A liquid–liquid extraction procedure was used for the analysis preparation. The matrix volume was 0.1 mL. As internal standard, 25 μL of 0.1 ng/μL alpha-PVP-d8/2-oxo-PVP-d6 was added to each tube. A 0.1-mL amount of concentrated ammonium hydroxide was added to the tubes, and the tubes were vortexed. A 2-mL volume of 1-chlorobutane:acetonitrile (4:1) was added to each tube, and a Teflon®-lined screw top was placed on each tube. The tubes were mixed for 15 min on a reciprocating shaker. After mixing, the tubes were centrifuged for 10 min at 1200 × g with an IEC FLx 40 centrifuge (Thermo Scientific, Waltham, MA, USA). Following centrifugation, the upper organic layer was collected and transferred to separate, clean 13 × 100 mm glass culture tubes. A TurboVap evaporator (Zymark, Hopkinton, MA, USA) set at 40°C was used to evaporate the extracts to dryness under a stream of air. After evaporation, the extracts were reconstituted by the addition of 0.2 mL of 0.1% formic acid. The tubes were vortexed, and the extracts were transferred to separate 300-μL conical polypropylene autosampler vials with snap caps.
LC–MS analysis
The LC–MS-MS analysis utilized an Agilent (Santa Clara, CA, USA) 1100 HPLC system that was coupled with a Thermo Scientific TSQ Quantum Access triple quadrupole mass spectrometer. A Hewlett Packard dc 7800 computer with a Windows XP version 5.1 operating system and Xcalibur 2.0, SR2 software (Thermo Scientific) was used to operate the LC-MS/MS. LCquan 2.7.0 software (Thermo Scientific) was used to process the analytical data. The chromatographic column was a YMC ODS-AQ 50 mm × 2 mm, 3 μm column (YMC America, Allentown, PA, USA). A mobile phase gradient that consisted of 0.1% formic acid (A) and acetonitrile (B) was used. The gradient conditions were as follows—Time 0 to 1 min: 90% A/10% B; from 1 min to 2 min: gradient progressed to 40% A/60% B; from 2 to 8.5 min; gradient held at 40% A/60% B; from 8.5 to 9 min: gradient returned to 90% A/10% B; from 9 to 18 min: gradient maintained at 90% A/10% B. The flow rate was 0.2 mL per minute. The LC column temperature was maintained at 25°C. For the MS analysis, positive ion electrospray was used. The spray capillary temperature was 270°C. Ultrahigh-purity argon was utilized as the collision gas. The analysis used selected reaction monitoring (SRM), and the following precursor to product ion m/z transitions was tracked: alpha-PVP, 232 → 91; alpha-PVP-d8, 240 → 91; 2-oxo-PVP, 246 → 91; 2-oxo-PVP-d6, 252 → 91. For all SRM transitions, the collision energy was set at 28.
Method validation
The analysis performance was evaluated as described in reports of other analytical methods developed in our laboratory (19, 20). Because this analytical method was to be used for research work that studied pharmacokinetics of alpha-PVP (known compound and metabolite being tested), FDA method validation guidance was generally followed (21). One deviation from FDA guidance was that quality control results were acceptable within 20% of target which is consistent with SWGTOX guidelines (22).
Matrix specificity
To examine if there was background that can interfere with the analysis of rat plasma samples that had alpha-PVP/2-oxo-PVP concentrations at potential lower limit of quantitation (LLOQ), six different blank rat plasma sources with only the internal standard (2.5 ng/mL, n = 6) and a single sample per source spiked at the LLOQ (0.25 ng/mL alpha-PVP/2-oxo-PVP) were processed and tested. The mean peak area ratio (any signal at the retention time of the analyte/internal standard signal) in the blanks was compared to the peak area ratios in the LLOQ standards. An additional sample (no internal standard added) per blank plasma source was processed to evaluate background at the retention time of the internal standard.
Accuracy and precision
Three concentrations of quality control samples were prepared in plasma. The intra-run evaluation involved analyzing five replicates (n = 5) at each concentration in a single analytical run. The intra-run evaluation also included testing of the LLOQ standard (N = 6) prepared in the six different blank plasma sources used in the specificity evaluation. The inter-run evaluation included the intra-run data, and two additional runs where five replicates of each control level were analyzed. The accuracy was determined by expressing the concentration of analyte compounds measured in the controls as a percent of the target concentration. The precision was expressed as the percent coefficient of variation (% CV).
Extraction recovery and matrix effect evaluation
The recovery and matrix effect (ion suppression) was studied at 0.75, 10 and 400 ng/mL for alpha-PVP/2-oxo-PVP and 2.5 ng/mL for alpha-PVP-d8/2-oxo-PVP-d6. For the recovery (extraction efficiency) evaluation, the analyte and internal standard working solutions were added to tubes containing 0.1 mL blank plasma prior to the extraction (n = 5/concentration). These recovery standards were processed by performing the liquid–liquid extraction procedure (SET C). For the matrix effect evaluation, five replicate tubes at each concentration to be tested were prepared by adding 0.1 mL blank plasma to each tube. These blank plasma tubes were processed up to the evaporation step by the liquid–liquid extraction procedure. Prior to evaporation, the analyte and internal standard working solutions were added to the blank plasma extracts. Then, the matrix evaluation tubes were taken through the completion of the preparation procedure (SET B). Analysis of these matrix effect evaluation extracts will show if components in the plasma extracts affect ionization of alpha-PVP/2-oxo-PVP and their internal standards. A set of reference standards were also prepared (n = 5). Working solutions of alpha-PVP/2-oxo-PVP and their internal standards were added to tubes that contained 0.1% formic acid so that the analyte and internal standard concentrations correspond to the concentrations that were evaluated in the extraction recovery and matrix effect evaluation samples. These reference tubes represent 100% recovery of the alpha-PVP and 2-oxo-PVP (SET A). The preparations from Sets A, B and C were analyzed by LC–MS-MS. To determine recovery, the mean peak areas of the alpha-PVP/2-oxo-PVP chromatographic peaks in Set C were divided by the mean peak areas of the alpha-PVP/2-oxo-PVP chromatographic peaks in Set A. For matrix effect extracts, the mean peak areas in Set B were divided by the mean peak areas in Set A.
Stability
Short-term room temperature stability of alpha-PVP and 2-oxo-PVP was assessed in the 0.75- and 400-ng/mL controls. Three replicates of each control per time were removed from the freezer and maintained for 4, 13.5 and 24 h at room temperature prior to extraction and analysis. Another three control replicates underwent three cycles of freezing and thawing over a 24-h period prior to extraction and testing. Stability of the extracts (processed samples) was evaluated in extracts maintained for 7 days at 4°C and 24 days maintained at room temperature. Stock solution stability was evaluated for 4 h at room temperature and since date of preparation (308 days) at −20°C.
Research study samples
Plasma samples were obtained from a research study involving rats. Subcutaneous injection was used to administer alpha-PVP (2.0 mg/kg) to male Sprague–Dawley rats. Surgically implanted jugular catheters were used to collect blood samples 15, 30, 60, 120, 240 and 480 min following injection. Plasma that was obtained from the blood samples was stored frozen until testing.
Results and Discussion
Extraction
The liquid–liquid extraction procedure used concentrated ammonium hydroxide to basify the samples and 1-chlorobutane:acetonitrile (4:1) as the extraction solvent. Our lab has used a similar extraction procedure for the analysis of oxycodone (19). The liquid–liquid procedure was easily performed. The 0.1-mL sample volume is practical for use in animal studies where there is limited sample volume. One procedure that tested blood had only used acetonitrile precipitation for sample preparation, but had a higher alpha-PVP LLOQ compared to this report (14).
LC–MS-MS analysis
Unextracted standards of alpha-PVP and 2-oxo-PVP were analyzed by single quadrupole mass spectrometry (Q1MS). The scan range for the Q1MS evaluation was 100 to 500 amu. Figure 2 shows that the alpha-PVP Q1MS had a prominent ion at m/z 232 and 2-oxo-PVP Q1MS had a prominent ion at m/z 246. These prominent ions correspond to the protonated molecular ions for alpha-PVP and 2-oxo-PVP and were used as the precursor ions for the tandem mass spectrometry analysis. For the internal standards, the alpha-PVP-d8 Q1MS spectrum had a prominent ion at m/z 240 and the 2-oxo-PVP-d6 Q1MS spectrum had a prominent ion at m/z 252. These were the protonated molecular ions and were used as the precursor ions for the internal standard in the LC–MS-MS analysis. The product ion spectrums for alpha-PVP, 2-oxo-PVP and their internal standards all showed a pronounced ion fragment at m/z 91 (Figure 3, data not shown for internal standards). These mass spectrum characteristics resulted in employing SRM transitions using the protonated molecular ions as the precursor ions and m/z 91 as the product ions for alpha-PVP, 2-oxo-PVP and their internal standards. Other reports have utilized the 232 to 91 MRM transition for the analysis of alpha-PVP (6, 14, 15, 16).
Figure 2.
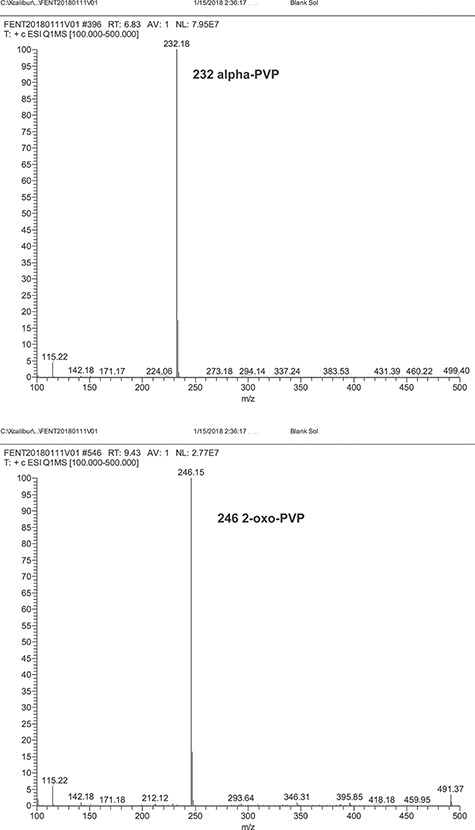
Precursor ion spectrum of alpha-PVP and 2-oxo-PVP.
Figure 3.
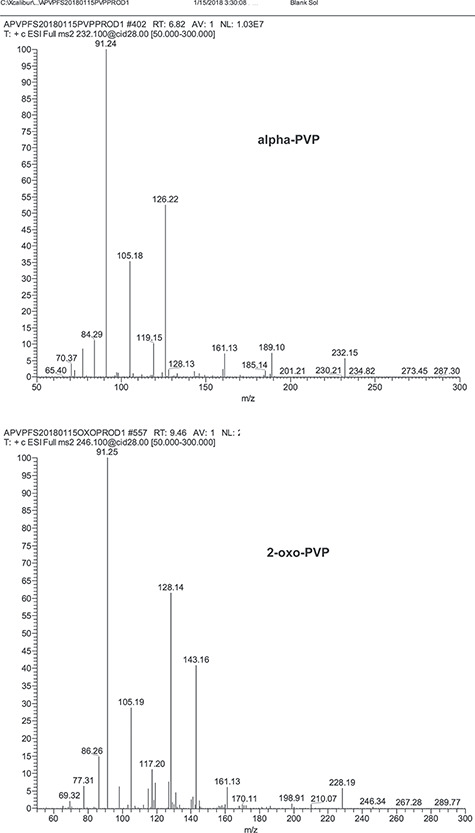
Product ion spectrum of alpha-PVP and 2-oxo-PVP.
Figure 4 shows the LC–MS-MS analysis for the 0.25-ng/mL alpha-PVP/2-oxo-PVP LLOQ calibration standard. The chromatographic peak shapes were distinct. A large peak at 8.0 min is currently unidentified, but the possibility of it being another metabolite of PVP is likely. The analysis sensitivity permitted use of 0.25 ng/mL as the LLOQ. Surprisingly, the more polar 2-oxo-PVP metabolite eluted later (8.9 min) compared to the less polar alpha-PVP parent drug (6.4 min) on the reversed-phase chromatography system. The calibration range for alpha-PVP and 2-oxo PVP was 0.25 to 500 ng/mL. A quadratic curve fit and a 1/x weighting was used for the calibration curve. Previous reports of methods developed to analyze for PVP in blood and urine reported higher LLOQs (6, 14, 15, 16, 17).
Figure 4.
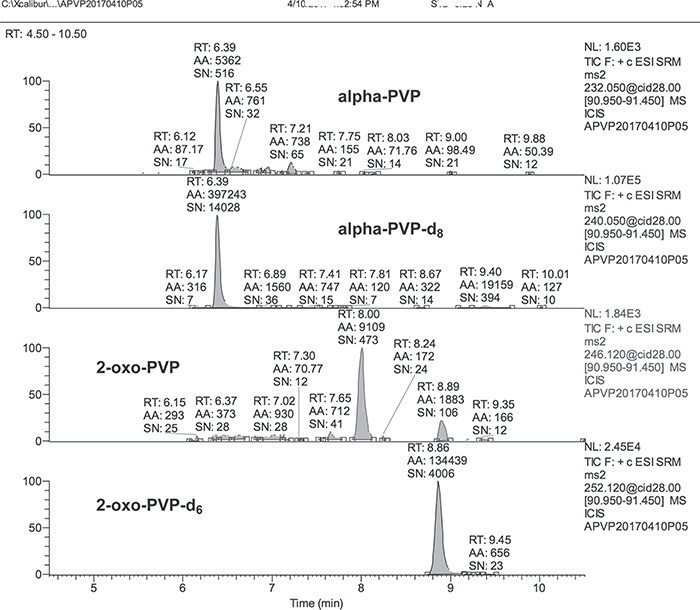
Chromatograms of the 0.25-ng/mL calibration standard.
Matrix specificity
The testing of six different blank plasma sources showed that there was minimal LC–MS-MS signal for alpha-PVP and 2-oxo-PVP at their respective retention times. The ratio of any signal area at the alpha-PVP and 2-oxo-PVP retention time to the internal standard area was less than 20% of the 0.25-ng/mL LLOQ peak area ratios (Table I). This supports setting the alpha-PVP and 2-oxo-PVP LLOQs at 0.25 ng/mL. All of the blank plasma sources had minimal LC-MS/MS signal for the alpha-PVP-d8 and 2-oxo-PVP-d6 internal standards.
Table I.
Specificity in Human Plasma
| Blank | ||
|---|---|---|
| Plasma | Alpha-PVP | 2-Oxo-PVP |
| Source | Percent (mean PAR of blank plasma source) | (LLOQ mean PAR) |
| 1 | 8.71 | 16.4 |
| 2 | 7.46 | 15.2 |
| 3 | 5.85 | 16.5 |
| 4 | 5.11 | 7.57 |
| 5 | 4.32 | 8.96 |
| 6 | 5.30 | 6.88 |
Values are the mean peak area ratios (PARs) for three replicates of blank plasma spiked with internal standard (2 ng/mL) divided by the mean of six LLOQ standards where plasma from each source was fortified at the LLOQ Concentration.
Accuracy and precision
In addition to the quality controls prepared at 0.75, 10 and 400 ng/mL, a set of controls was prepared at the LLOQ concentration in each of the blank plasma sources that were used in the matrix specificity evaluation. These LLOQ controls were analyzed in a single analytical run (intra-assay). Table II shows that the intra-assay % of the target ranged from 88.9 to 117.8% and the intra-assay precision ranged from 0.9 to 16.0%. The highest mean deviation from intra-assay accuracy was for alpha-PVP at the LLOQ level. The least precise intra-assay measurements were for 2-oxo-PVP at the LLOQ. For the rest of the intra-assay evaluation, the mean accuracy values were within 12% of the target and the %CVs were within 12%. For the inter-assay evaluation, the accuracy ranged from 98.7 to 110.7% of the target and the precision ranged from 4.5 to 12.0% (Table II). These data demonstrate that the presented LC–MS-MS analytical method was effective in quantitating alpha-PVP and 2-oxo-PVP in the rat plasma control samples.
Table II.
Accuracy and Precision
| LLOQ | Low | Medium | High | ||
|---|---|---|---|---|---|
| 0.25 ng/mL | 0.75 ng/mL | 10 ng/mL | 400 ng/mL | ||
| (% target/%CV) | |||||
| Intra-assay | Alpha-PVP | 88.9/16.0 | 102.3/0.9 | 109.8/3.2 | 106.6/2.5 |
| 2-Oxo-PVP | 117.8/11.3 | 96.1/6.9 | 98.7/6.1 | 90.9/4.5 | |
| Inter-assay | Alpha-PVP | 101.8/4.7 | 107.9/4.5 | 110.7/5.4 | |
| 2-Oxo-PVP | 98.7/7.7 | 101.5/5.3 | 103.5/12.0 | ||
Intra-assay precision and accuracy was determined at N = 5 for controls; LLOQs were run at N = 6, using the same six different sources of plasma as in the specificity study. The inter-assay determination included control results from intra-assay and two additional runs with each concentration at N = 5.
Extraction recovery and matrix effect
The extraction recovery was at least 52% for alpha-PVP and at least 67% for 2-oxo-PVP (Table III). For the matrix effect evaluation, the ionization recoveries were at least 64% for alpha-PVP and 82% for 2-oxo-PVP. Two other studies that analyzed for alpha-PVP in blood reported extraction and ionization recoveries greater than 80% (14, 15). Any loss of extraction recovery or ionization recovery as reflected by our evaluation did not adversely affect the analysis performance and still permitted a low LLOQ of 0.25 ng/mL.
Table III.
Extraction Recovery and Matrix Effect
| LLOQ | Low | High | Internal standard | ||
|---|---|---|---|---|---|
| 0.25 ng/mL | 0.75 ng/mL | 400 ng/mL | 25 ng/mL | ||
| (% extraction recovery) | |||||
| Extraction | Alpha-PVP | 52.2 | 55.5 | 61.0 | 71.7 |
| Recovery | 2-Oxo-PVP | 68.8 | 67.4 | 69.2 | 80.5 |
| Matrix | Alpha-PVP | 64.8 | 69.8 | 74.7 | 105.6 |
| Effect | 2-Oxo-PVP | 87.4 | 82.7 | 89.3 | 126.2 |
See Materials and Methods for more details on the procedure to determine extraction recovery and matrix effect.
Stability
Measurement of alpha-PVP and 2-oxo-PVP in plasma controls maintained at room temperature for 4, 13.5 and 24 h was within 20% of the target concentration. This implies that alpha-PVP and 2-oxo-PVP were stable in controls stored at room temperature for at least 24 h (Table IV). Our short-term room temperature stability evaluation results were consistent with another study that showed that it took 14 days at room temperature before there was a 20% loss of alpha PVP in blood (23). Three cycles of freezing and thawing within 24 h did not result in losses of alpha-PVP and 2-oxo-PVP. Plasma controls stored at −20°C were stable for at least 36 days. Alpha-PVP and 2-oxo-PVP were stable in the extracts (processed samples) for at least 7 days when stored at 4°C and at least 24 days when stored at room temperature. Another study showed that processed samples stored at room temperature were stable for 48 h (14). We also noted that alpha-PVP and 2-oxo-PVP were stable in the methanolic stocks solutions stored 308 days in the freezer (−20°C) and maintained 4 h at room temperature.
Table IV.
Stability in Plasma, Processed Samples and Methanolic Stock Solutions
| z | ||||
|---|---|---|---|---|
| Alpha-PVP | Alpha-PVP | 2-Oxo-PVP | 2-Oxo-PVP | |
| 0.75 ng/mL | 400 ng/mL | 0.75 ng/mL | 400 ng/mL | |
| (% of target/% CV) | ||||
| Plasma room temperature | ||||
| 4 h | 95.2/4.8 | 93.0/5.6 | 87.2/2.7 | 90.5/6.4 |
| 13.5 h | 93.1/5.9 | 90.5/2.8 | 92.7/10.3 | 95.0/1.1 |
| 24 h | 90.3/3.8 | 82.0/4.1 | 94.0/5.5 | 97.0/0.8 |
| Freeze thaw; 3 cycles | 104.5/11.9 | 104.0/1.4 | 96.9/4.1 | 99.3/2.7 |
| Plasma at −20 °C 36 days | 106.7/6.0 | 97.0/8.3 | 102.1/8.1 | 95.7/5.6 |
| Processed samples | ||||
| 4°C 7 days | 104.3/4.6 | 118.8/6.7 | 112.4/8.4 | 103.5/5.9 |
| Room temperature 25 days | 103.7/2.9 | 99.3/9.0 | 102.4/4.8 | 96.0/10.6 |
| Alpha-PVP | 2-Oxo-PVP | |||
| 1.0 ng/μL | 1.0 ng/μL | |||
| Methanolic stock solution stability | ||||
| Fresh room temperature 4 h | 103.5/2.3 | 100.0/6.7 | ||
| Frozen 308 days | 96.4/1.6 | 101.2/2.0 | ||
Research study analysis
The method was used to analyze rat plasma samples collected from a pharmacokinetic study. Alpha-PVP and 2-oxo-PVP were detected and quantitated (Figure 5). Both compounds showed a similar time course. For the 2.0-mg/kg dose, the mean peak alpha–PVP concentrations were 150 ng/mL. The alpha-PVP concentrations were about 20 times higher compared to the 2-oxo-PVP concentrations.
Figure 5.
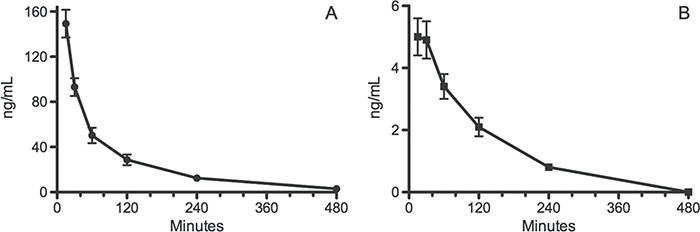
Time-course of (A) alpha-PVP and (B) 2-oxo-PVP after subcutaneous injection of 2.0 mg/kg alpha-PVP into male rats.
Conclusions
A method to test alpha-PVP and 2-oxo-PVP in rat plasma was developed and validated. The method utilized liquid–liquid extraction sample preparation and LC–MS-MS analysis. This is the first report of a quantitative method that tested for alpha-PVP in plasma samples. It is also the first report of a method that measured 2-oxo-PVP concentrations in biological samples. The practical usefulness of the method was demonstrated by analyzing rat plasma samples from a pharmacokinetic study.
Acknowledgements
This work was funded by a contract from the National Institute of Drug Abuse NIH201800364.
Contributor Information
David M Andrenyak, Center for Human Toxicology, Department of Pharmacology and Toxicology, University of Utah, 30 S. 2000 E. Rm 3861, Salt Lake City, UT 84108, USA.
David E Moody, Center for Human Toxicology, Department of Pharmacology and Toxicology, University of Utah, 30 S. 2000 E. Rm 3861, Salt Lake City, UT 84108, USA.
Jonathan M Crites, Center for Human Toxicology, Department of Pharmacology and Toxicology, University of Utah, 30 S. 2000 E. Rm 3861, Salt Lake City, UT 84108, USA.
Michael H Baumann, Designer Drug Research Unit, IRP, NIDA, NIH, DHHS, 333 Cassell Drive, Suite 4400, Baltimore, MD 21224, USA.
References
- 1. Baumann, M.H. (2016) The changing face of recreational drug use. Cerebrum, January-February, 1–16. [PMC free article] [PubMed] [Google Scholar]
- 2. German, C.L., Fleckenstein, A.E., Hanson, G.R. (2014) Bath salts and synthetic cathinones: An emerging designer drug phenomenon. Life Science, 97, 2–8. [DOI] [PMC free article] [PubMed] [Google Scholar]
- 3. Karila, L., Megarbane, B., Cottencin, O., Lejoyeux, M. (2015) Synthetic cathinones: A new public health problem. Current Neuropharmacology, 13, 12–20. [DOI] [PMC free article] [PubMed] [Google Scholar]
- 4. Marinetti, L.J., Antonides, H.M. (2013) Analysis of synthetic cathinones commonly found in bath salts in human performance and post mortem toxicology: Method development, drug distribution and interpretation of results. Journal of Analytical Toxicology, 37, 135–146. [DOI] [PubMed] [Google Scholar]
- 5. Knoy, J.L., Peterson, B.L., Couper, F.J. (2014) Suspected impaired driving case involving α-pyrrolidinovalerophenone, methylone and ethylone. Journal of Analytical Toxicology, 38, 615–617. [DOI] [PubMed] [Google Scholar]
- 6. Wright, T.H., Harris, C. (2016) Twenty-one cases involving alpha-pyrrolidinovalerophenone (α-PVP). Journal of Analytical Toxicology, 40, 396–402. [DOI] [PubMed] [Google Scholar]
- 7. Glennon, R.A., Young, R. (2016) Neurobiology of 3,4-methlenedioxypyrovalerone (MDPV) and α-pyrrolidinovalerophenone (α-PVP). Brain Research Bulletin, 126, 111–126. [DOI] [PMC free article] [PubMed] [Google Scholar]
- 8. Potocka-Banas, B., Janus, T., Majdanik, S., Banas, T., Dembinska, T., Borowiak, K. (2017) Fatal intoxication with α-PVP, a synthetic cathinone derivative. Journal of Forensic Sciences, 63, 553–556. [DOI] [PubMed] [Google Scholar]
- 9. Grapp, M., Sauer, C., Vidal, C., Muller, D. (2016) GC-MS analysis of the designer drug α-pyrrolidinovalerophenone and its metabolites in urine and blood in an acute poisoning case. Forensic Science International, 259, e14–e19. [DOI] [PubMed] [Google Scholar]
- 10. Meltzer, P.C., Butler, D., Deschamps, J.R., Madras, B.K. (2006) 1-(4-methylphenyl)-2-pyrrolidin-1-yl-pentan-1-one (pyrovalerone) analogues: A promising class of monoamine reuptake inhibitors. Journal of Medicinal Chemistry, 49, 1420–1432. [DOI] [PMC free article] [PubMed] [Google Scholar]
- 11. Marusich, J.A., Antonazzo, K.R., Wiley, J.L., Blough, B.E., Partilla, J.S., Baumann, M.H. (2014) Pharmacology of novel synthetic stimulants structurally related to the “bath salts” constituent 3,4-methylenedioxypyrovalerone (MDPV). Neuropharmacology, 87, 206–213. [DOI] [PMC free article] [PubMed] [Google Scholar]
- 12. Shima, N., Katagi, M., Kamata, H., Matsuda, S., Sasaki, K., Kamata, T. et al. (2014) Metabolism of the newly encountered designer drug α-pyrrolidinovalerophenone in humans: Identification and quantification of urinary metabolites. Forensic Toxicology, 32, 59–67. [Google Scholar]
- 13. Kerrigan, S., Savage, M., Cavazos, C., Bell, P. (2016) Thermal degradation of synthetic cathinones: Implications for forensic toxicology. Journal of Analytical Toxicology, 40, 1–11. [DOI] [PubMed] [Google Scholar]
- 14. Pasin, D., Bidny, S., Fu, S. (2015) Analysis of new designer drugs in post-mortem blood using high-resolution mass spectrometry. Journal of Analytical Toxicology, 39, 163–171. [DOI] [PubMed] [Google Scholar]
- 15. Glicksberg, L., Bryand, K., Kerrigan, S. (2016) Identification and quantification of synthetic cathinones in blood and urine using liquid chromatography-quadrupole/time of flight (LC-Q/TOF) mass spectrometry. Journal of Chromatography B, 1035, 91–103. [DOI] [PubMed] [Google Scholar]
- 16. Concheiro, M., Anizan, S., Ellefsen, K., Huestis, M.A. (2013) Simultaneous quantification of 28 synthetic cathinones and metabolites by liquid chromatography-high resolution mass spectrometry. Analytical and Bioanalytical Chemistry, 405, 9437–9448. [DOI] [PubMed] [Google Scholar]
- 17. Concheiro, M., Castaneto, M., Kronstrand, R., Huestis, M.A. (2015) Simultaneous determination of 40 novel psychoactive stimulants in urine by liquid chromatography-high resolution mass spectrometry and library matching. Journal of Chromatography A, 1397, 32–42. [DOI] [PMC free article] [PubMed] [Google Scholar]
- 18. Williams, M., Martin, J., Galettis, P. (2017) A validated method for the detection of 32 bath salts in oral fluid. Journal of Analytical Toxicology, 41, 659–669. [DOI] [PubMed] [Google Scholar]
- 19. Fang, W.B., Lofwal, M.R., Walsh, S.L., Moody, D.E. (2013) Determination of oxycodone, noroxycodone, and oxymorphone by high-performance liquid chromatography-electrospray ionization-tandem mass spectrometry in human matricies: In vivo and in vitro applications. Journal of Analytical Toxicology, 32, 208–219. [DOI] [PMC free article] [PubMed] [Google Scholar]
- 20. Andrenyak, D.M., Moody, D.M., Slawson, M.H., O’Leary, D.S., Haney, M. (2017) Determination of Δ-9-tetrahydrocannabinol (THC), 11-hydroxy-THC, 11-nor-9-carboxy-THC and cannabidiol in human plasma using gas chromatography-tandem mass spectrometry. Journal of Analytical Toxicology, 41, 277–288. [DOI] [PMC free article] [PubMed] [Google Scholar]
- 21. (A) FDA, U.S . (2001) Guidance for industry-Bioanalytical method development. http://www.fda.gov/cder/guidance/index.htm ().
- 22. (B) SWGTOX (2013) Scientific Working Group for Forensic Toxicology (SWGTOX) standard practices for method validation in forensic toxicology. Journal of Analytical Toxicology, 37, 452–474. [DOI] [PubMed] [Google Scholar]
- 23. Glicksberg, L., Kerrigan, S. (2017) Stability of synthetic cathinones in blood. Journal of Analytical Toxicology, 41, 711–719. [DOI] [PubMed] [Google Scholar]