

Abstract
Objective:
To assess whether pre-diagnostic metabolites were associated with incident pancreatic ductal adenocarcinoma (PDAC) in a prospective cohort study.
Design:
We conducted an untargeted analysis of 554 known metabolites measured in pre-diagnostic serum (up to 24 years) to determine their association with incident PDAC in a nested-case control study of male smokers (372 matched case-control sets) and an independent nested case-control study in that included women and non-smokers (107 matched sets). Metabolites were measured using Orbitrap Elite or Q-Exactive high resolution/accurate mass spectrometers. Controls were matched to cases by age, sex, race, date of blood draw and follow-up time. We used conditional logistic regression adjusted for age to calculate odds ratios (OR) and 95% confidence intervals (CI) for a 1 standard deviation increase in log-metabolite level separately each cohort and combined the two ORs using a fixed effects meta-analysis.
Results:
Thirty-one metabolites were significantly associated with PDAC at an FDR < 0.05 with 12 metabolites below the Bonferroni-corrected threshold (P-value < 9.04 × 10⁻⁵). Similar associations were observed in both cohorts. The dipeptides glycylvaline, aspartylphenylalanine, pyroglutamylglycine, phenylalanylphenylalanine, phenylalanylleucine, and tryptophylglutamate and amino acids aspartate and glutamate were positively while the dipeptides tyrosylglutamine and α-glutamyltyrosine, fibrinogen cleavage peptide DSGEGDFXAEGGGVR, and glutathione related amino acid cysteine-glutathione disulfide were inversely associated with PDAC after Bonferroni correction. Five top metabolites demonstrated significant time varying associations (P-value < 0.023) with the strongest associations observed 10–15 years after participants’ blood collection and attenuated thereafter.
Conclusion:
Our results suggest that pre-diagnostic metabolites related to subclinical disease, γ-glutamyl cycle metabolism, and adiposity/insulin resistance are associated with PDAC.
Keywords: pancreatic cancer, prospective study, metabolomics, prediagnostic blood, epidemiology
INTRODUCTION
Pancreatic cancer is a leading cause of cancer deaths and one whose incidence is increasing in the United States (US) and worldwide.1 There is no effective screening test for the malignancy, the majority are diagnosed at advanced stages, and has poor survival.1 Most pancreatic cancers are ductal adenocarcinomas (PDAC).2 Smoking, history of diabetes mellitus, and adiposity are among the few established risk factors.2 PDAC cases often have gastrointestinal problems, weight loss, or diabetes prior to being diagnosed due to sub-clinical cancer which can influence biomarkers. Prospective studies with prediagnostic measures of exposures are less prone to these issues.
Metabolomics is a high throughput method that measures many small molecules in biospecimens. A metabolomic profile represents the collection of metabolites within a biological system that reflects endogenous, environmental and genetic factors, as well as, the gut microflora that may play a role in metabolism. As the pancreas is a major organ involved in metabolic regulation, the metabolomics approach may offer improved insights into etiology and uncover biochemical pathways unique to pancreatic carcinogenesis, tumor proliferation, and systemic response to the tumor. We conducted an untargeted analysis to determine whether metabolites were prospectively associated with incident PDAC in a nested-case control study of male smokers from the Alpha-Tocopherol, Beta-Carotene Cancer Prevention Study (ATBC) and an independent nested case-control study in the Prostate, Lung, Colorectal, and Ovarian Cancer Screening Trial (PLCO). We hypothesized that unique metabolic profiles would be associated with PDAC.
MATERIAL AND METHODS
We conducted a nested case-control study of 373 matched cases-control pairs within the ATBC cohort and an independent nested case-control study of 107 matched cases-control pairs from PLCO cohort. Details of ATBC and PLCO have previously been described.3, 4
The ATBC was a randomized primary prevention trial that tested whether alpha-tocopherol, beta-carotene, or both would reduce the incidence of lung or other cancers in male smokers. The study included 29,133 men from southwestern Finland, ages 50 to 69 years at baseline, who smoked at least five cigarettes per day.3 Participants provided a serum sample after an overnight fast prior to randomization between 1985 and 1988.3 The PLCO was a randomized multicenter trial in the United States (Birmingham, AL; Denver, CO; Detroit, MI; Honolulu, HI; Marshfield, WI; Minneapolis, MN; Pittsburgh, PA; Salt Lake City, UT; St. Louis, MO; and Washington, DC) that sought to determine the effectiveness of early detection screening procedures for prostate, lung, colorectal, and ovarian cancers on disease-specific mortality.4 The PLCO screening arm included approximately 77,000 men and women, ages 55 to 74, who provided non-fasting blood samples at enrollment between 1993 and 2001.4 Aliquots of serum were stored at −70C. Informed consent was obtained by study participants. The ATBC was approved by the institutional review boards of the US National Cancer Institute and the National Public Health Institute in Finland. The PLCO was approved by the institutional review boards at the 10 PLCO screening centers and the US National Cancer Institute.
Data on demographics, lifestyle factors, and possible confounders were collected from self-administered questionnaires at baseline from each cohort.3, 4 For the ATBC participants’ height and weight were measured by trained study staff.
Case ascertainment and selection of controls
Cases were incident primary pancreatic adenocarcinomas (ICD-O-3: C25.0-C25.3, C25.7-C25.9). Cases from ATBC were identified via linkage to the Finnish Cancer Registry. PLCO cases were ascertained by annual mail-in survey, cancer registries, and/or National Death Index, and confirmed by trained study abstractors. The interval between serum collection and diagnosis was up to December 31, 2011 and May 15, 2010 for ATBC and PLCO, respectively.
One matched control was selected for each case. Controls were alive and free from PDAC on the date of cancer case diagnosis. Controls were matched to cases on age at blood draw (±5 years), and date of blood draw within 30 days for ATBC. For PLCO, controls were frequency matched to cases on age at blood draw (5-year blocks), date of blood collection (2-month blocks), sex, and race. We excluded one ATBC case-control set because one case was identified as having extreme outlier measurements for multiple metabolites. Our final analytic ATBC set included 372 matched cases-control pairs.
Laboratory analysis
The samples were sent to Metabolon, Inc. (Durham, NC, USA) on dry ice with the ATBC (2013/2014) samples having metabolites measured prior to the PLCO (2017) samples. Serum samples were assayed using untargeted ultrahigh performance liquid chromatography-tandem mass spectrometry and/or gas chromatography mass spectrometry (Supplemental methods).5, 6 Metabolites were measured using either the Orbitrap Elite or Orbitrap Q-Exactive platforms. Metabolite peak intensity was normalized according to run-day by dividing each metabolite observation by the median for that metabolite on that run-day. Peaks were identified via linkage to Metabolon’s known chemical reference library. Metabolon grouped the metabolites into chemical classes and sub-pathways based upon Kyoto Encyclopedia of Genes and Genomes classifications.7
Serum samples from cases and their matched controls were chosen from never thawed parent vials, aliquoted, and processed in a controlled, consistent manner. Case and their matched control samples were placed consecutively in each batch. Blinded replicate quality control samples, comprising 10% of the overall study, were included across all batches. The median (25th to 75th percentile range) intra-class correlation coefficient was 0.85 (0.63–0.95).
Across the two studies, 1058 known metabolites and 740 unknown metabolites were measured. We excluded metabolites where ≥ 50% of participants had metabolite values below the limit of detection (LOD) in ATBC. We did not apply the same LOD restrictions on PLCO because we wanted to replicate metabolites in ATBC and < 20% of PLCO participants were current smokers. We also excluded dipeptide and lysolipid metabolites that were not curated on the Q-Exactive platform (used to measure PLCO metabolites) and unknown metabolites. In total, 554 known metabolites were included in our analytic set. Metabolites below detection were assigned with the minimum observed value for that metabolite. Metabolite levels were then log-transformed and normalized to have a standard deviation equal to one.
Statistical analyses
We tested for differences in selected characteristics between cases and controls using Wilcoxon’s rank-sum for continuous variables and chi-square for categorical variables. For each study, we calculated the odds ratios (OR) and 95% confidence intervals (CI) for a 1 standard deviation increase in log-metabolite level using conditional logistic regression which inherently adjusts for the matching factors (sex, age, race, date-season of blood draw, and time). We calculated an overall estimate by combining the two ORs using a fixed-effects meta-analysis. As some of the metabolites may be on the causal pathway or characterize known exposures associated with PDAC (i.e. body mass index (BMI), diabetes, smoking), we first evaluated associations without adjusting for confounders beyond the matching factors. Secondary analyses were additionally adjusted for smoking (ATBC: years smoked and smoking intensity; PLCO: never, former quit >15 years ago, former quit <15 years ago, or current smoking), BMI (kg/m2, continuous), and diabetes (yes, no). We carefully evaluated smoking as a confounder in each cohort. Cohort specific smoking variables were created given the characteristics of each population and the manner in which smoking history was queried in each cohort.
We evaluated the association between metabolic pathways and PDAC using 42 pre-defined groups based on chemical class (Supplemental methods). For each of the two studies, we combined the P-values of the metabolites included in a given pathway by Fisher’s method (Fisher’s Statistic = ) and obtained a pathway-level P-value by comparing the observed statistic to a permutation-based null distribution. We then calculated an overall pathway level P-value by combining the ATBC and PLCO values using Fisher’s method.
We evaluated whether the strength of the association varied with time between blood draw and diagnosis separately in the ATBC and PLCO cohorts for the Bonferroni-corrected significant metabolites because the ATBC participants had longer follow-up time (Supplemental table 1). We performed a likelihood ratio test comparing two models. The first model allowed the coefficient, β(t), for the log-metabolite to vary by time since blood draw. This model, describing the coefficient β(t) by a natural spline with 3 degrees of freedom, was fit using the gam function in R with a random intercept for the case/control pair. The second model assumed the coefficient was constant over time, β(t)=β.
We considered a false discovery rate (FDR) level of 0.05 for statistical significance (Q-value), however note the Bonferroni-adjusted α-level for the combined analyses is 9.04 × 10⁻⁵ (0.05/554) for individual metabolites and 0.0012 (0.05/42) for metabolic pathways.
The descriptive analyses were preformed using Statistical Analysis Systems (SAS) software versions 9.3 (SAS Institute, Inc., Cary, North Carolina) and the remaining analyses were performed using the R programming language. All statistical tests were two-tailed.
RESULTS
The characteristics of cases and controls in each cohort are shown in Table 1. The median interval between serum collection and diagnosis was 11.4 years for ATBC (0.06 to 23.8 years) and 5.4 years for PLCO (0.29 to 16.2 years). The median PDAC diagnosis age was 69 years in ATBC and 70 years in PLCO. Compared to each study’s controls, ATBC cases more often reported a history of diabetes, and smoked slightly more cigarettes per day (although medians were the same, P-values < 0.05), while PLCO cases were more often current smokers (P-value=0.06). Compared to the PLCO participants, the ATBC participants were slightly younger at baseline when their blood sample was collected, all male, all Caucasian, and current smokers; had smoked greater pack-years, however had similar median BMI and age when diagnosed with PDAC.
Table 1.
Baseline characteristics of participants in the two nested-control studies (median, 25th and 75% percentile or numbers and proportions)
| ATBC | PLCO | |||||
|---|---|---|---|---|---|---|
| Cases | Controls | Cases | Controls | |||
| (n = 372) | (n = 372) | P-valuea | (n = 107) | (n = 107) | P-valuea | |
| Age, years | ||||||
| Blood draw | 57 (53– 61) | 57 (53– 61) | 0.98 | 65 (61–69) | 65 (61–68) | 0.73 |
| Diagnosis (range) | 69 (50–87) | 70 (56–86) | ||||
| Time to diagnosis, years (range) | 11.4 (0.06–23.8) | 5.4 (0.29–16.2) | ||||
| Males, n (%) | 372 (100) | 372 (100) | 1.00 | 67 (62.6) | 67 (62.6) | 1.00 |
| Race, n (%) | ||||||
| White | 372 (100) | 372 (100) | 1.00 | 93 (86.9) | 93 (86.9) | 1.00 |
| Black | 5 (4.7) | 5 (4.7) | ||||
| Asian | 5 (4.7) | 5 (4.7) | ||||
| Other | 4 (3.7) | 4 (3.7) | ||||
| Smoking Status, n (%) | ||||||
| Never | 39 (36.5) | 43 (40.2) | 0.06 | |||
| Former | 47 (43.9) | 55 (51.4) | ||||
| Current | 372 (100) | 372 (100) | 1.00 | 21 (19.6) | 9 (8.4) | |
| Cigarettes smoked per day | 20 (15–25) | 20 (15–25) | 0.03 | 20 (20–30) | 30 (30–40) | 0.14 |
| Number of years smoked | 36 (32–42) | 36 (30–41) | 0.47 | 44 (37–48) | 48 (42–52) | 0.20 |
| Pack-years | 38.0 (27.0–46.5) | 35.0 (23.0–45.0) | 0.02 | 17.5 (0–45.0) | 9.0 (0–37.0) | 0.20 |
| Self-reported diabetesb, n (%) | 23 (6.2) | 11 (3.0) | 0.04 | 6 (5.6) | 3 (3.0) | 0.24 |
| Body mass index (kg/m2) | 26.2 (24.0–28.5) | 26.0 (23.6–28.1) | 0.25 | 26.4 (23.7–29.2) | 27.2 (23.8–29.7) | 0.70 |
| BMI categoriesc, % | ||||||
| Normal | 131 (35.2) | 148 (39.8) | 0.34 | 38 (35.5) | 34 (31.8) | 0.84 |
| Overweight | 175 (47.0) | 169 (45.4) | 45 (42.1) | 48 (44.9) | ||
| Obese | 66 (17.7) | 55 (14.8) | 24 (22.4) | 25 (23.4) | ||
| Alcohol used, g per day | 11.4 (3.1–28.4) | 9.4 (2.2–24.5) | 0.12 | 2.1 (0.3–16.8) | 1.7 (0.4–10.0) | 0.98 |
| Alcohol use4, categories, n (%) | ||||||
| 0 g | 40 (11.3) | 51 (14.3) | 0.19 | 0 | 0 | 0.14 |
| > 0 and < 15 g | 161 (45.4) | 170 (47.6) | 76 (72.9) | 75 (77.9) | ||
| > 15 and <30 g | 65 (18.3) | 69 (19.3) | 7 (7.3) | 11 (11.5) | ||
| > 30 g | 89 (25.1) | 67 (18.8) | 21 (19.8) | 10 (10.6) | ||
P values for categorical and continuous variables were based on chi-square test and Wilcoxon’s rank-sum test, respectively.
Self-reported diabetes 1 PLCO control missing data
BMI = Body Mass Index. BMI was calculated by dividing measured weight (kg) by height squared (m2) and categorized according to the World Health Organization obesity classifications as less than 25 (normal), 25 to 30 (overweight), and 30 kg/m2 or more (obese)
Missing alcohol use data: ATBC 17 cases and 15 controls missing data, PLCO 3 cases and 11 controls missing data
In combined analyses, 31 metabolites were significant at a Q-value < 0.05 (Figure 1 and Table 2) and twelve metabolites were significant at the Bonferroni-corrected threshold with similar direction of associations in both ATBC and PLCO with the exception of guanine which was present in ATBC but not PLCO. Most metabolite associations were more significant for the combined results than either cohort alone. Among the top metabolite associations, eight dipeptide metabolites were associated with PDAC below the Bonferroni-corrected threshold: six were positively (glycylvaline, aspartylphenylalanine, pyroglutamylglycine, phenylalanylphenylalanine, phenylalanylleucine, and tryptophylglutamate: OR=1.30 to 1.46, P-value=4.84 X 10⁻⁵ to 4.33 × 10⁻⁸, Q-value < 0.001) and two were inversely (tyrosylglutamine and α-glutamyltyrosine: OR=0.72 to 0.74, P-value= 3.21 to 5.63 X 10⁻⁶, Q-value < 0.00035). A fibrinogen cleavage peptide, DSGEGDFXAEGGGVR (OR=0.74, P-value = 1.05 × 10⁻⁵, Q-value=0.0005) and amino acid, cysteine-glutathione disulfide (OR=0.75, P-value = 1.49 × 10⁻⁵, Q-value=0.0006) were inversely while the amino acids aspartate (OR=1.31, P-value = 3.93 × 10⁻⁵, Q-value=0.001) and glutamate (OR=1.31, P-value = 8.91 × 10⁻⁵, Q-value=0.002) were positively associated with PDAC. Many of the top metabolites were correlated (Supplemental figures 1 A. and B).
Figure 1.
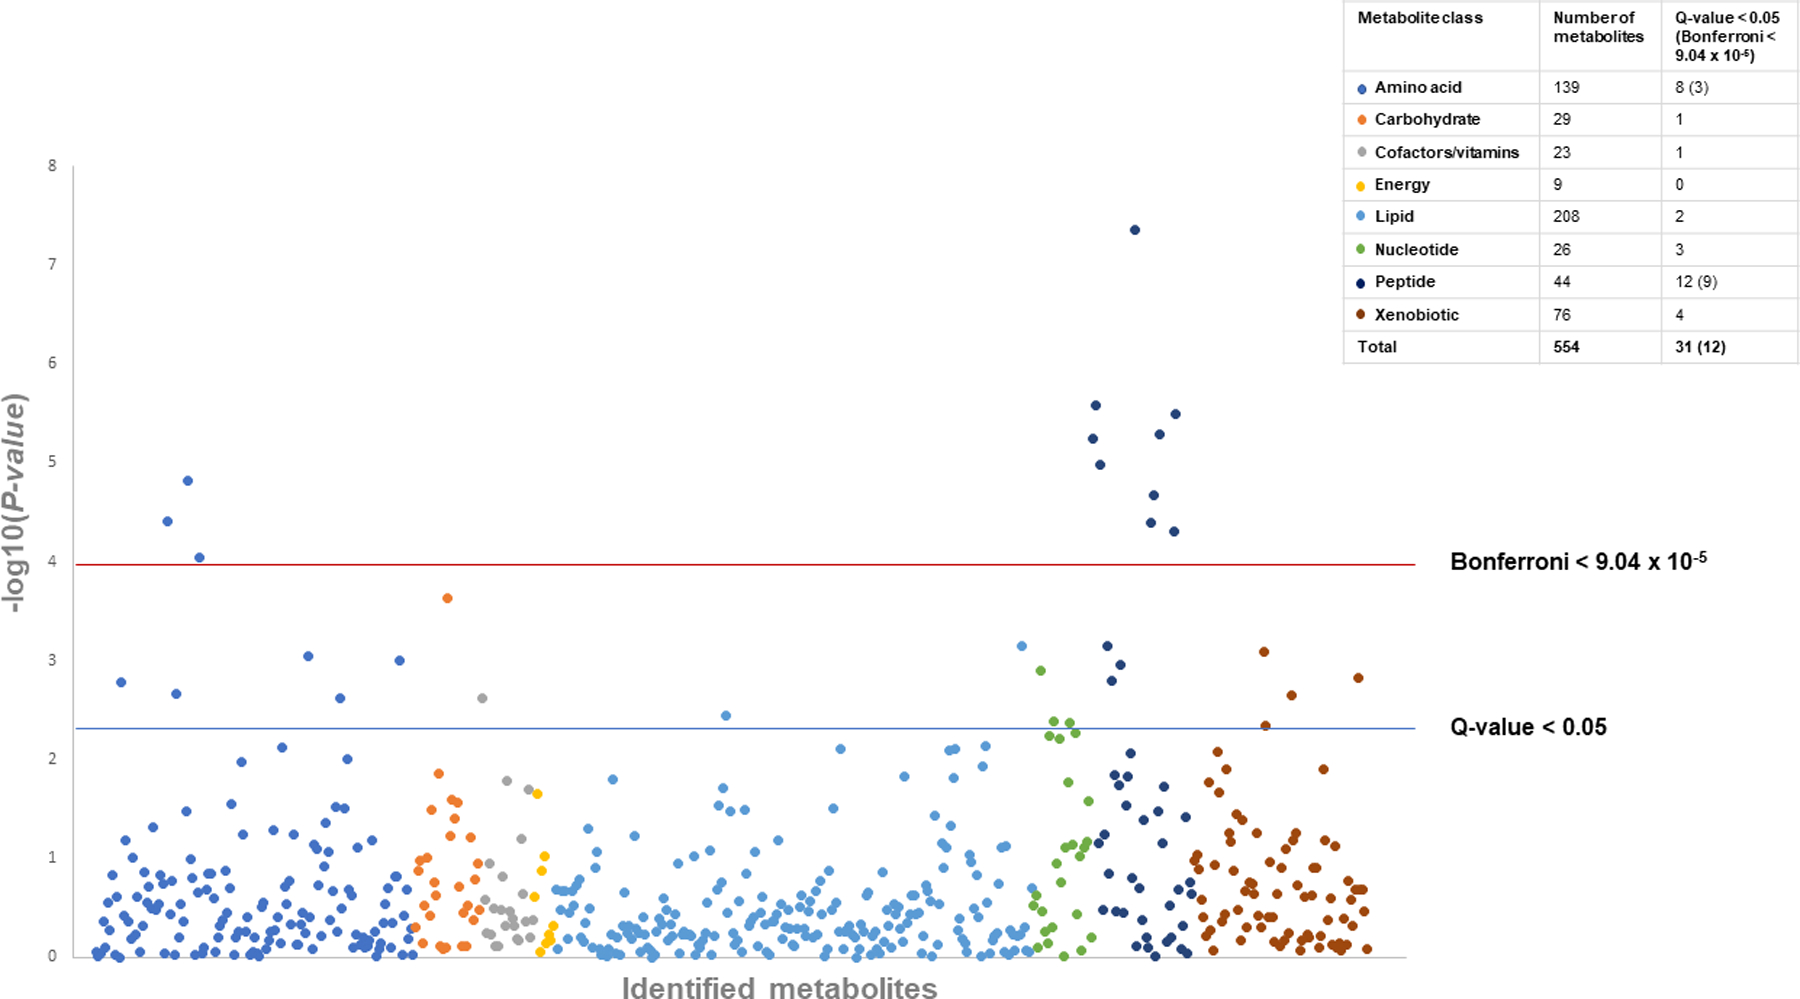
Manhattan plot of the P-values for metabolites associated with pancreatic cancer by metabolite chemical class, meta-analysis nested case-control results from the Alpha-Tocopherol, Beta-Carotene Cancer Prevention Study (ATBC) and Prostate, Lung, Colorectal, and Ovarian Cancer Screening Trial (PLCO). The total number of metabolites and the number with statistically significant associations (Bonferroni P-value < 9.04 × 10⁻⁵, Q-value < 0.05) are presented by chemical class in the key.
Table 2.
Metabolites associated with pancreatic ductal adenocarcinoma in each nested case-control study and both studies combined
| ATBC – Studya (n=372 case-control sets) |
PLCO – Studya (n=107 case-control sets) |
Meta-analysisa (n=379 case-control sets) |
|||||||
|---|---|---|---|---|---|---|---|---|---|
| Metabolites | Sub-Pathway | Class | OR (95% CI) | P-value | OR (95% CI) | P-value | OR (95% CI) | P-value | Q-value |
| Glycylvaline | Dipeptide | Peptide | 1.47 (1.26,1.71) | 7.40E-07 | 1.43 (1.06,1.92) | 0.02 | 1.46 (1.28,1.67) | 4.33E-08 | 1.33E-05 |
| Aspartylphenylalanine | Dipeptide | Peptide | 1.37 (1.18,1.60) | 4.53E-05 | 1.44 (1.06,1.95) | 0.02 | 1.38 (1.21,1.59) | 2.60E-06 | 3.28E-04 |
| Tyrosylglutamine | Dipeptide | Peptide | 0.69 (0.59,0.81) | 8.32E-06 | 0.80 (0.62,1.04) | 0.09 | 0.72 (0.63,0.83) | 3.21E-06 | 3.28E-04 |
| Pyroglutamylglycine | Dipeptide | Peptide | 1.33 (1.16,1.54) | 7.04E-05 | 1.40 (1.04,1.87) | 0.02 | 1.35 (1.18,1.53) | 5.16E-06 | 3.46E-04 |
| α-glutamyltyrosine | Dipeptide | Peptide | 0.73 (0.63,0.85) | 2.69E-05 | 0.76 (0.56,1.04) | 0.08 | 0.74 (0.65,0.84) | 5.63E-06 | 3.46E-04 |
| DSGEGDFXAEGGGVR | Fibrinogen cleavage peptide | Peptide | 0.71 (0.61,0.83) | 1.03E-05 | 0.85 (0.64,1.14) | 0.28 | 0.74 (0.65,0.85) | 1.05E-05 | 5.37E-04 |
| Cysteine-glutathione disulfide | Glutathione metabolism | Amino acid | 0.74 (0.64,0.86) | 6.85E-05 | 0.77 (0.57,1.04) | 0.09 | 0.75 (0.65,0.85) | 1.49E-05 | 6.54E-04 |
| Phenylalanylphenylalanine | Dipeptide | Peptide | 1.38 (1.18,1.60) | 4.36E-05 | 1.21 (0.93,1.57) | 0.02 | 1.33 (1.17,1.52) | 2.15E-05 | 8.23E-04 |
| Aspartate | Alanine and aspartate metabolism | Amino acid | 1.28 (1.11,1.47) | 6.17E-04 | 1.44 (1.07,1.94) | 0.02 | 1.31 (1.15,1.49) | 3.93E-05 | 1.23E-03 |
| Phenylalanylleucine | Dipeptide | Peptide | 1.31 (1.12,1.53) | 5.56E-04 | 1.44 (1.05,1.96) | 0.02 | 1.33 (1.16,1.53) | 4.02E-05 | 1.23E-03 |
| Tryptophylglutamate | Dipeptide | Peptide | 1.36 (1.18,1.58) | 3.26E-05 | 1.13 (0.87,1.47) | 0.27 | 1.30 (1.15,1.48) | 4.84E-05 | 1.35E-03 |
| Glutamate | Glutamate metabolism | Amino acid | 1.29 (1.11,1.50) | 1.02E-03 | 1.37 (1.03,1.83) | 0.03 | 1.31 (1.14,1.49) | 8.91E-05 | 2.28E-03 |
| Mannose | Sugar metabolism | Carbohydrate | 1.26 (1.04,1.53) | 0.02 | 1.79 (1.27,2.52) | 8.28E-04 | 1.37 (1.16,1.62) | 2.34E-04 | 5.53E-03 |
| γ-glutamylglutamate | γ-glutamyl amino acid | Peptide | 1.23 (1.06,1.43) | 7.15E-03 | 1.54 (1.08,2.20) | 0.02 | 1.27 (1.11,1.46) | 6.99E-04 | 0.01 |
| Sphingosine | Sphingolipid metabolism | Lipid | 1.28 (1.05,1.57) | 0.02 | 1.52 (1.10,2.09) | 0.01 | 1.34 (1.13,1.59) | 7.07E-04 | 0.01 |
| Cotinine | Tobacco metabolite | Xenobiotics | 1.22 (1.04,1.43) | 0.01 | 1.35 (1.05,1.74) | 0.02 | 1.26 (1.10,1.44) | 8.15E-04 | 0.02 |
| Phenylalanine | Phenylalanine & tyrosine metabolism | Amino acid | 1.30 (1.11,1.52) | 1.41E-03 | 1.17 (0.89,1.55) | 0.27 | 1.26 (1.10,1.45) | 8.91E-04 | 0.02 |
| 3-ureidopropionate | Alanine and aspartate metabolism; pyrimidine metabolism, uracil containing | Amino acid; nucleotide | 1.19 (1.02,1.39) | 0.02 | 1.50 (1.13,2.01) | 5.66E-03 | 1.26 (1.10,1.44) | 9.82E-04 | 0.02 |
| γ-glutamylphenylalanine | γ-glutamyl amino acid | Peptide | 1.25 (1.07,1.46) | 4.59E-03 | 1.33 (0.95,1.86) | 0.10 | 1.26 (1.10,1.45) | 1.11E-03 | 0.02 |
| 7-methylguanine | Purine metabolism, guanine containing | Nucleotide | 1.31 (1.10,1.54) | 1.77E-03 | 1.17 (0.87,1.58) | 0.31 | 1.27 (1.10,1.47) | 1.25E-03 | 0.02 |
| O-cresol sulfate | Benzoate metabolism; phenylalanine & tyrosine metabolism | Xenobiotics; amino acid | 1.20 (1.03,1.39) | 0.02 | 1.42 (1.07,1.89) | 0.02 | 1.24 (1.09,1.42) | 1.50E-03 | 0.02 |
| γ-glutamylisoleucine | γ-glutamyl amino acid | Peptide | 1.27 (1.09,1.47) | 2.37E-03 | 1.17 (0.85,1.59) | 0.33 | 1.25 (1.09,1.43) | 1.60E-03 | 0.02 |
| 3-methoxytyrosine | Phenylalanine & tyrosine metabolism | Amino acid | 1.25 (1.06,1.46) | 7.40E-03 | 1.33 (0.96,1.85) | 0.09 | 1.26 (1.09,1.46) | 1.64E-03 | 0.02 |
| C-glycosyltryptophan | Tryptophan metabolism | Amino acid | 1.32 (1.11,1.56) | 1.77E-03 | 1.12 (0.84,1.48) | 0.44 | 1.26 (1.09,1.46) | 2.17E-03 | 0.03 |
| Hydroxycotinine | Tobacco metabolite | Xenobiotics | 1.20 (1.02,1.40) | 0.03 | 1.32 (1.03,1.70) | 0.03 | 1.23 (1.08,1.41) | 2.22E-03 | 0.03 |
| Tryptophan | Tryptophan metabolism | Amino acid | 1.27 (1.09,1.49) | 2.66E-03 | 1.13 (0.85,1.49) | 0.39 | 1.24 (1.08,1.42) | 2.38E-03 | 0.03 |
| Alpha-tocopherol | Tocopherol metabolism | Cofactors and vitamins | 0.84 (0.71,0.98) | 0.03 | 0.62 (0.43,0.89) | 0.01 | 0.80 (0.69,0.92) | 2.41E-03 | 0.03 |
| 7-α-hydroxy-3-oxo-4-cholestenoate (7-Hoca) | Sterol | Lipid | 1.24 (1.07,1.44) | 5.19E-03 | 1.15 (0.86,1.55) | 0.34 | 1.22 (1.07,1.40) | 3.53E-03 | 0.04 |
| Guanine | Purine metabolism, guanine containing | Nucleotide | 0.74 (0.61,0.91) | 4.10E-03 | -- b | -- b | 0.74 (0.61,0.91) | 4.10E-03 | 0.04 |
| N2,N2-dimethylguanosine | Purine metabolism, guanine containing | Nucleotide | 1.30 (1.09,1.54) | 2.84E-03 | 1.09 (0.80,1.47) | 0.60 | 1.24 (1.07,1.44) | 4.23E-03 | 0.04 |
| Cotinine N-oxide | Tobacco metabolite | Xenobiotics | 1.21 (1.03,1.41) | 0.02 | 1.24 (0.96,1.61) | 0.10 | 1.22 (1.06,1.39) | 4.60E-03 | 0.046 |
Odds Ratios (OR) and 95% confidence intervals (CI) for a 1 standard deviation (SD) increase in log-metabolite level calculated using conditional logistic regression which adjusts for the matching variables (age, date of blood draw, sex, race, and follow-up time). An overall estimate was calculated by combining the two ORs using a fixed-effects meta-analysis because the associations were derived from different populations and the metabolites measured at different times.
Not present in the PLCO samples
There were several additional notable top-ranking metabolites (Table 2). The monosaccharide mannose, three peptide metabolites in the γ-glutamyl amino acid group (γ-glutamylglutamate, γ-glutamylphenylalanine, γ-glutamylisoleucine), two phenylalanine (phenylalanine, 3-methoxytyrosine) and two tryptophan (C-glycosyltryptophan, tryptophan) amino acid metabolites were positively associated with PDAC. Nucleotide metabolites in the purine metabolism group (7-methylguanine, n2, n2-dimethylguanosine) were positively associated, except for the purine guanine which was inversely associated in ATBC. Most of the metabolites showed linear associations in that ORs consistently increased or decreased over the quartiles (Supplemental table 2).
Further adjustment for age, smoking, BMI, and baseline diabetes did not affect most associations (Supplemental Table 3): twenty-four metabolites remained associated with PDAC at Q-value < 0.05. Notably tobacco metabolites (cotinine, hydroxycotinine, cotinine N-oxide, O-cresol sulfate) were no longer significant at the FDR threshold.
We also performed a forward stepwise logistic regression analysis to determine the number and magnitude of the conditionally independent associations of the top 31 FDR < 0.05 metabolites (Supplemental table 4). This method selects the most significant metabolite associated with PDAC given the other selected metabolites in the model. Seven metabolites (glycylvaline, α-tocopherol, mannose, 3-methoxytyrosine, tryptophan, hydroxycotinine, and tyrosylglutamine) were significantly associated with PDAC up to step 7 after which the risk estimates became unstable with additional metabolites.
Among the twelve top metabolites, five metabolites had significant time varying associations (Figure 2) with the strength of the associations for glycylvaline (P-value=0.015), α-glutamyltyrosine (P-value=0.006), DSGEGDFXAEGGGVR (P-value=0.02), aspartate (P-value=0.02), and tryptophylglutamate (P-value= 4.85 × 10⁻⁴) stronger among cases diagnosed within 10 to 15 years after their blood collection in the ATBC cohort. There was no significant time varying association among the PLCO participants (P-values > 0.05, supplemental figure 2 shows patterns in PLCO for the five metabolites that were time varying in ATBC).
Figure 2.
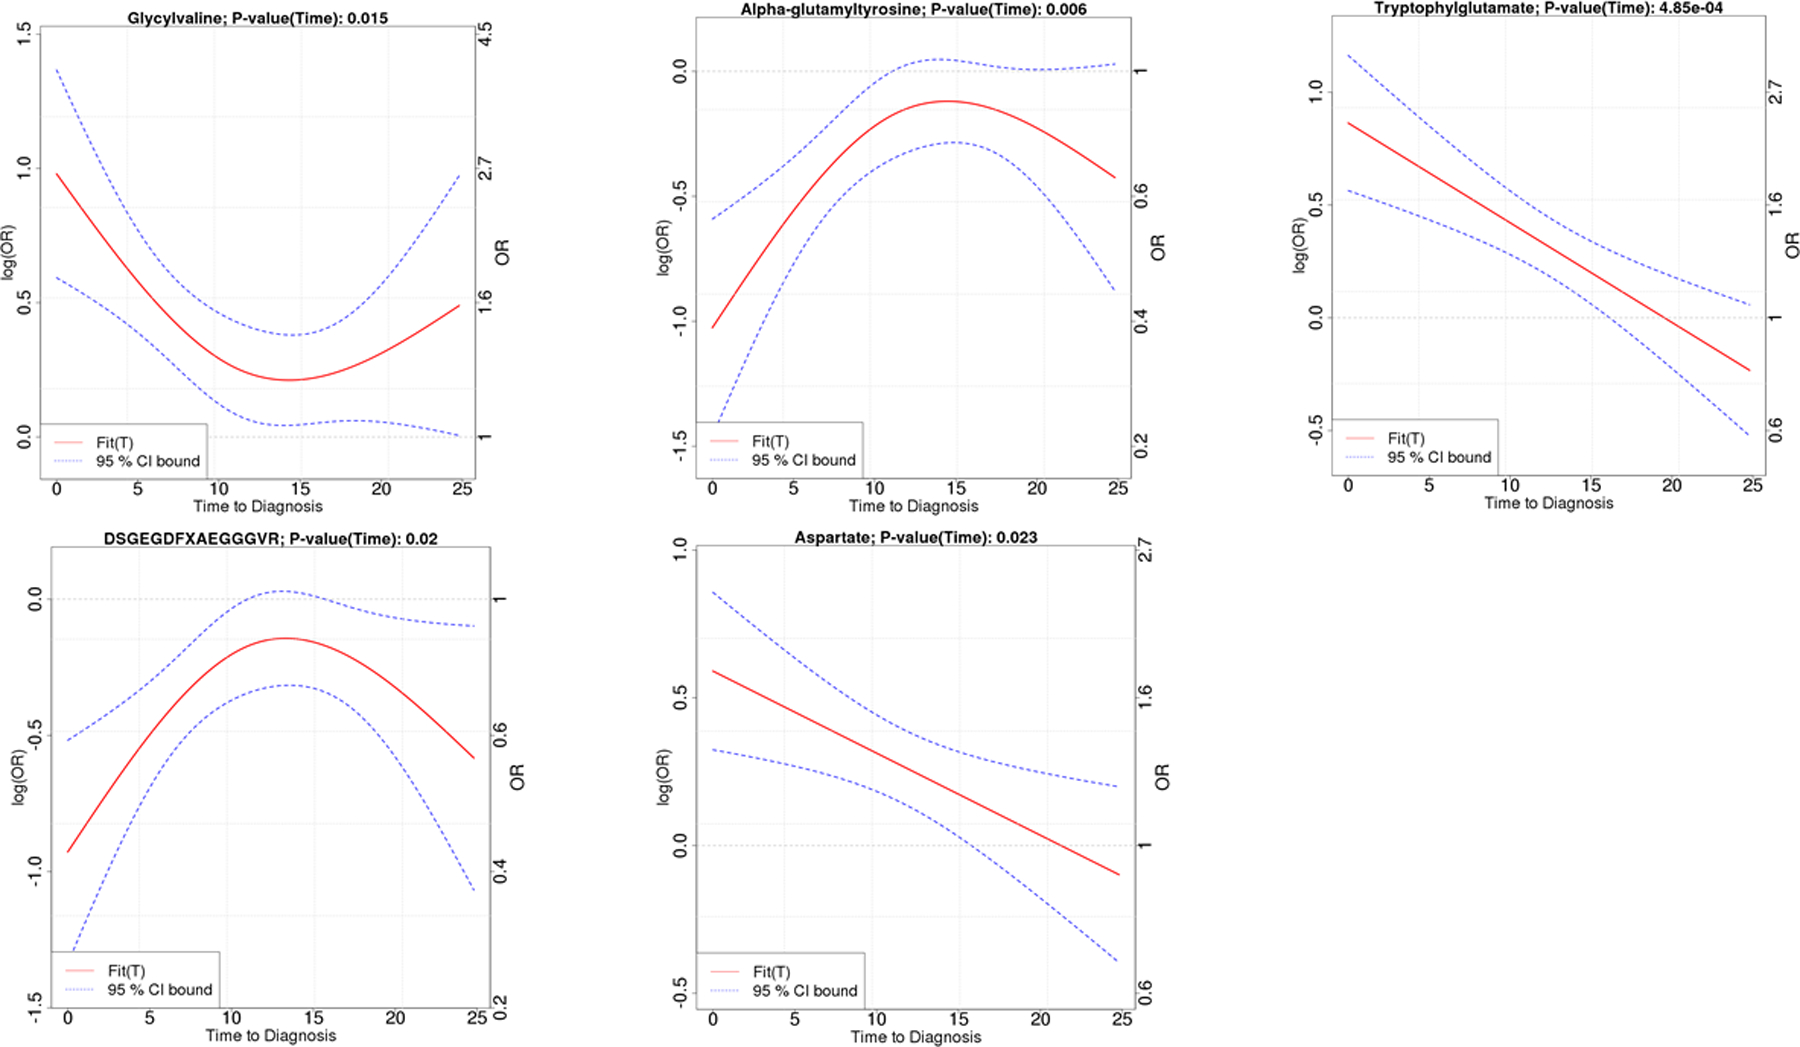
Metabolites with significant time varying associations (P-value < 0.05), nested case-control results from the Alpha-Tocopherol, Beta-Carotene Cancer Prevention Study (ATBC). Glycylvaline, α-glutamyltyrosine and tryptophylglutamate are dipeptides, DSGEGDFXAEGGGVR is a fibrinogen cleavage peptide, and aspartate is a non-essential amino acid. X axis is time from baseline blood draw (0 year) to date of pancreatic adenocarcinoma diagnosis up to 24 years. The Y-axis shows the strength of the association measured as either the OR (right axis) or log(OR) (left axis). The magnitude of the associations are larger (i.e. further from OR = 1 or log(OR) = 0) when the blood draw is closer to the date of diagnosis.
Six metabolic pathways were associated with PDAC at the Bonferroni-corrected threshold of 0.0012 (Table 3 and Supplemental Table 5, i.e. dipeptide, fibrinogen cleavage peptide, alanine and aspartate, glutathione, purine, and tobacco). The γ-glutamyl amino acid and glutamate metabolism groups were close to the Bonferroni threshold (P-value < 0.0017). Twenty pathways had P-values <0.05.
Table 3:
| Sub-pathway | Metabolites, n | P-value |
|---|---|---|
| Dipeptide group/polypeptide | 28 | <0.0001 |
| Fibrinogen cleavage peptide | 2 | 0.0002 |
| Alanine and aspartate metabolism group | 8 | 0.0005 |
| Glutathione metabolism | 3 | 0.0005 |
| Purine metabolism group | 17 | 0.0009 |
| Tobacco metabolism group | 4 | 0.001 |
| Gamma-glutamyl amino acid metabolism group | 13 | 0.0015 |
| Glutamate metabolism | 4 | 0.0017 |
| Glycolysis, gluconeogenesis, pyruvate metabolism group | 7 | 0.004 |
| Bile acids | 19 | 0.006 |
| Sphingolipid metabolism | 5 | 0.007 |
| Benzoate metabolism | 20 | 0.009 |
| Tocopherol metabolism | 6 | 0.01 |
| Tryptophan metabolism group | 17 | 0.01 |
| Phenylalanine & tyrosine metabolism | 18 | 0.02 |
| Sugar metabolism | 10 | 0.02 |
| Pyrimidine metabolism group | 13 | 0.03 |
| Sterol/steroid | 28 | 0.03 |
| Butanoate metabolism; cysteine, methionine, SAM, taurine metabolism | 15 | 0.04 |
| Urea cycle; arginine and proline metabolism group | 17 | 0.04 |
Pathways are based on the Kyoto Encyclopedia of Genes and Genomes (KEGG) and described in Supplementary Table 1. For each of the two studies, we combined the P-values of the metabolites included in a given pathway by Fisher’s method. We then calculated an overall pathway level P-value by combining the ATBC and PLCO values using Fisher’s method. The analyses include 479 case-control sets (372 from the ATBC study,107 from the PLCO study).
The p-values are not adjusted for multiple comparisons. The Bonferroni corrected significance for the 42 pathways is 0.05/42=0.0012. The dipeptide, fibrinogen cleavage peptide, alanine and aspartate, glutathione, purine, and tobacco metabolism groups significant after Bonferroni correction. Complete pathway results in supplemental table 5.
DISCUSSION
In this nested case-control study, we observed significant associations between multiple metabolites and PDAC. Thirty-one metabolites were significantly associated with PDAC at an FDR < 0.05 with 12 metabolites below the Bonferroni-corrected threshold. Metabolites in the dipeptide, fibrinogen cleavage peptide, alanine and aspartate, glutathione, purine, tobacco, γ-glutamyl amino acid and glutamate metabolism groups were the most strongly associated with PDAC. Similar associations were observed in male smokers and an independent nested case-control study that included non-smokers and women.
To our knowledge four prospective epidemiologic studies have examined metabolomic profiles and PDAC with varying results.8, 9, 10, 11 The first measured 83 metabolites in 453 cases and 898 matched controls from four cohorts and showed significant positive associations between three plasma branched-chain amino acids (BCAA: i.e. isoleucine, leucine, and valine) and PDAC, associations that were confirmed in a mutant KRAS mouse model.8 The strongest associations were observed among participants with samples collected between 2 to 5 years prior to cancer diagnosis that the mouse model demonstrated was related to tissue protein breakdown that occurs in early stage disease.8 Another study, which measured 167 metabolites in 226 matched case-control sets from two Shanghai cohorts, showed significant inverse associations for 6 glycerophospholipids and tetracosanoic acid, and positive associations for one glycerophospholipid (PC15:0/18:2), coumarin, and picolinic acid.9 Two recent studies showed no significant associations.10, 11 In contrast to these studies, the present study included more cases and measured a larger number of metabolites. We observed positive associations for the BCAA however below our multiple comparison significance threshold (OR=1.09 to 1.15, P-value > 0.03, Q-value > 0.13) and no associations for the other metabolites. Our lack of replication of the Shanghai study’s results may be related to the different platforms used to measure metabolites9 or population differences including racial/ethnic group and exposures.
Five of our most significant metabolites (glycylvaline, α-glutamyltyrosine, tryptophylglutamate, DSGEGDFXAEGGGVR, and aspartate) had significant time varying effects with the strongest associations observed among cases diagnosed within 10 to 15 years after their blood collection. These metabolites largely consist of dipeptide metabolites which are incomplete breakdown products of protein catabolism. Some of these associations might reflect a pre-cachexic, paraneoplastic state.8 They could also be related to other physiologic tumor processes such as nutrient scavenging and catabolism of intracellular and extracellular protein that fuel tumor growth.12, 13 Our results suggest metabolic changes due to subclinical disease may occur up to 15 years prior to cancer diagnosis.
The elevated risk associated with higher concentrations of the non-essential amino acids aspartate and glutamate is consistent with known PDAC biology.13, 14 Experimental studies of PDAC show that mutant KRAS modifies glutamine metabolism within PDAC cells such that aspartate is synthesized from glutamine-derived glutamate to generate fuel (NADPH) that promotes tumor growth.13 This process also maintains higher reduced glutathione levels and redox balance.13, 15 In previous metabolomic studies, blood, saliva and tumor tissue glutamate concentrations have been associated with PDAC in small case-control studies,16, 17, 18, 19 and rodent studies have shown higher glutamate concentrations in blood and pancreatic tissue from pancreatic intraepithelial neoplasia and PDAC compared to control animals.20, 21 These studies show less consistent associations for aspartate.21, 22
We are unsure what might explain the protective association for the fibrinogen cleavage peptide, DSGEGDFXAEGGGVR. DSGEGDFXAEGGGVR is the N-terminal cleaved form of ADpSGEGDFXAEGGGVR, a fibrinogen A-alpha chain peptide. Loci in the ABO blood group, fucosyltransferase 2 (secretor status included, FUT2), alkaline phosphate (ALPL), and glutamyl-aminopeptidase (ENPEP) genes have been associated with fibrinogen peptide phosphorylation.23 ABO blood group and loci in the ABO gene have also been associated with PDAC24 and venous thromboembolism25, 26 with O blood type conferring protective associations for both outcomes. Thromboembolic disease (Trousseau syndrome) is known to occur in some PDAC patients27 and it is possible that this process might somehow contribute to the time varying association we observe.
We observed PDAC associations for multiple metabolites related to glutathione metabolism and homeostasis, namely positive associations for γ-glutamyl amino acid and glutamate and an inverse association for cysteine-glutathione disulfide. Cysteine-glutathione disulfide is an oxidized form of glutathione. The γ-glutamyl amino acids metabolites are formed using the extracellular membrane bound enzyme γ-glutamyltransferase (GGT) which transfers a γ-glutamyl moiety from glutathione to amino acids and peptides.28 The γ-glutamyl cycle synthesizes and degrades glutathione in response to reactive oxygen species with glutamate being a product of the degradation. Higher circulating GGT concentrations have been associated with digestive cancers29 including pancreatic cancer in large cohort studies.30, 31 While glutathione metabolism is important for detoxification of carcinogens, moderate levels of reactive oxygen species and elevated glutathione concentrations can activate signaling pathways that promote tumor growth and metastasis.15 In addition, higher GGT expression has been correlated to therapeutic resistance, worst prognosis and reduced cancer survival15 which is characteristic of PDAC. Taken together, the associations that we observe might be indicative of a process related to oxidative stress, γ-glutamyl cycle metabolism and metabolites and pathways that interact with the γ-glutamyl cycle.
Glutamate, the γ-glutamyl amino acids, mannose, phenylalanine, tryptophan, N2,N2-dimethylguanosine, 7-methylguanine, and 7-HOCA have been associated with higher BMI, insulin resistance, progression to diabetes, or type 2 diabetes in epidemiologic studies,32, 33, 34, 35, 36, 37, 38, 39, 40 known risk factors for PDAC. BMI is not strongly associated with PDAC in our study or in smokers41, 42 and it is plausible that these metabolites are more sensitive indicators of visceral adiposity and its metabolic processes. For example, mannose may be a more accurate biomarker than glucose for assessing insulin resistance.43 This is particularly relevant for pancreatic carcinogenesis given the proximity of the pancreas to visceral adipose tissue and the greater potential for fatty pancreas infiltration,44, 45 which has been associated with PDAC.46 Some of these metabolites have also been associated with other cancers.47, 48, 49 Our results suggest that the metabolic profiles may be detecting an aspect of diabetes and metabolic disease related to PDAC beyond that determined by BMI.
Strengths of our study include its prospective design and replication in an independent cohort. Our study includes a large number of PDAC cases increasing our ability to observe associations if they exist. The metabolites were measured in blood collected up to 24 years prior to cancer diagnosis, reducing the likelihood of reverse causation and enabling us to evaluate time varying associations that might be related to tumor biology. Our nested case-control design has internal validity and no control selection bias. The case-control samples were handled in a comparable manner and the metabolic platform was reliable. Although long-term serum storage could change some compounds, given that we matched by follow-up time, any changes would be non-differential by case-control status and not bias risk estimates. Limitations include that pancreatic tissue specific metabolite concentrations risk associations may differ from what we observe in peripheral blood. Metabolites were measured at one time point, baseline. Repeated metabolite measurements may increase the accuracy of the exposure and better evaluate associations related to pre-invasive disease, particularly blood samples collected within 5 to 10 years prior to cancer diagnosis. As many of the top metabolites are highly correlated, we do not know if one of the correlated metabolites alone is associated with PDAC or a process that incorporates all contributes to the associations that we observe. Diabetes was queried once at baseline without distinguishing type (e.g. type 2 versus pancreatogenic diabetes) and a very small proportion of participants reported being diagnosed with diabetes; therefore, we cannot carefully evaluate how diabetes may mediate the associations we observe or whether associations differ by diabetes. We do not have adequate power to evaluate time varying interactions in PLCO, given the smaller number of cases and shorter follow-up time (up to 16 years in PLCO compared to 24 years in ATBC). Most participants in our study were from the ATBC study and current smokers at the time their blood was collected. The ranking of metabolites associated with PDAC may differ in American populations and those which include more non-smokers and women. As our population is primarily middle-aged or older individuals of European ancestry, our results might not be generalizable to other ethnicities or younger populations.
In conclusion, our prospective study results suggest prediagnostic systemic metabolism is associated with PDAC. We observed associations for metabolites related to subclinical disease, γ-glutamyl cycle metabolism, and adiposity/insulin resistance. The associations that we observe can be used to inform future hypothesis-driven investigations and the time varying metabolite associations in combination with known risk factors, other PDAC biomarkers and screening modalities might have utility for risk prediction and early detection. Additional population, clinical, and experimental research is needed to confirm and more fully understand our findings.
Supplementary Material
Significance of this study.
What is already known on this subject?
Pancreatic cancer is most often diagnosed at advanced stages, has poor survival, and has few established risk factors beyond cigarette smoking, history of diabetes, and excess body weight.
Metabolomics profiles may offer improved insights into etiology and the system of factors involved in the process of pancreatic tumorigenesis.
Limited large prospective epidemiologic studies have examined associations between prediagnostic metabolites and pancreatic ductal adenocarcinoma risk.
What are the new findings?
This large prospective study measured 554 identified metabolites in serum collected up to 24 years prior to cancer diagnosis.
Thirty-one pre-diagnostic circulating metabolites were significantly associated with pancreatic cancer with twelve metabolites below the Bonferroni correction threshold.
Metabolites in the dipeptide, fibrinogen cleavage peptide, alanine and aspartate, glutathione, purine, tobacco, γ-glutamyl amino acid and glutamate metabolism groups were the most strongly associated with pancreatic cancer.
Five top metabolites, the dipeptides glycylvaline, α-glutamyltyrosine, tryptophylglutamate; a fibrinogen cleavage peptide, DSGEGDFXAEGGGVR; and an amino acid, aspartate had significant time varying associations such that associations were strongest during the first 10 to 15 years after participants’ blood collection and were attenuated thereafter.
How might it impact on clinical practice in the foreseeable future?
Provides clues to understand etiology and potential mechanisms that may have utility for prevention or therapeutic approaches.
The metabolites that were more strongly associated among cases diagnosed within 10–15 after their blood collection may be related to subclinical disease. These metabolites in combination with other biomarkers and screening modalities may have usefulness for early detection in high risk groups.
Acknowledgments:
We thank all the participants, the investigators, and all support staff of the ATBC and PLCO cohort studies in Finland and in the United States that without this research would not be possible.
Funding:
This work was supported by the Intramural Research Program of the National Cancer Institute, National Institutes of Health, Department of Health and Human Services and by the U.S. Army Medical Research Acquisition Activity through the Peer Review Cancer Research Program Discovery Award under Award No. W81XWH-12–1–0369. Opinions, interpretations, conclusions and recommendations are those of the author and are not necessarily endorsed by the U.S. Army. The Department of Defense sponsors had no role in the design of the study; the collection, analysis, and interpretation of the data; the writing of the manuscript; and the decision to submit the manuscript for publication.
Abbreviations:
- ATBC
Alpha-Tocopherol, Beta-Carotene Cancer Prevention Study
- BCAA
Branched-chain amino acids
- BMI
Body mass index
- CI
Confidence intervals
- FDR
False discovery rate
- GGT
γ-glutamyltransferase
- LOD
Limit of detection
- OR
Odds ratios
- PDAC
Pancreatic ductal adenocarcinoma
- PLCO
Prostate, Lung, Colorectal, and Ovarian Cancer Screening Trial
- US
United States
Footnotes
Data Sharing Statement: Ethical restrictions on human subjects’ data prevents our posting the data used for this analysis. Biomedical research scientists from recognized research institutions can contact us directly to request data as bona fide researchers by e-mailing corresponding author.
Conflicts of Interest:
The authors disclose no potential conflicts of interest related to this study.
REFERENCES
- 1.Luo G, Zhang Y, Guo P, et al. Global patterns and trends in pancreatic cancer incidence: age, period, and birth cohort analysis. Pancreas 2019;48:199–208. [DOI] [PubMed] [Google Scholar]
- 2.Stolzenberg-Solomon RZ, Amundadottir LT. Epidemiology and inherited predisposition for sporadic pancreatic adenocarcinoma. Hematol Oncol Clin North Am 2015;29:619–40. [DOI] [PMC free article] [PubMed] [Google Scholar]
- 3.The alpha-tocopherol, beta-carotene lung cancer prevention study: design, methods, participant characteristics, and compliance. The ATBC Cancer Prevention Study Group. Ann Epidemiol 1994;4:1–10. [DOI] [PubMed] [Google Scholar]
- 4.Hayes RB, Sigurdson A, Moore L, et al. Methods for etiologic and early marker investigations in the PLCO trial. MutatRes 2005. [DOI] [PubMed]
- 5.Evans AM, DeHaven CD, Barrett T, et al. Integrated, nontargeted ultrahigh performance liquid chromatography/electrospray ionization tandem mass spectrometry platform for the identification and relative quantification of the small-molecule complement of biological systems. Anal Chem 2009;81:6656–67. [DOI] [PubMed] [Google Scholar]
- 6.Evans AM, Bridgewater BR, Liu Q, et al. High resolution mass spectrometry improves data quantity and quality as compared to unit mass resolution mass spectrometry in high-throughput profiling metabolomics Metabolomics 2014;4:7. [Google Scholar]
- 7.Ogata H, Goto S, Sato K, et al. KEGG: Kyoto Encyclopedia of Genes and Genomes. Nucleic Acids Res 1999;27:29–34. [DOI] [PMC free article] [PubMed] [Google Scholar]
- 8.Mayers JR, Wu C, Clish CB, et al. Elevation of circulating branched-chain amino acids is an early event in human pancreatic adenocarcinoma development. NatMed 2014;20:1193–8. [DOI] [PMC free article] [PubMed] [Google Scholar]
- 9.Shu X, Zheng W, Yu D, et al. Prospective metabolomics study identifies potential novel blood metabolites associated with pancreatic cancer risk. Int J Cancer 2018. [DOI] [PMC free article] [PubMed]
- 10.Jiao L, Maity S, Coarfa C, et al. A prospective targeted serum metabolomics study of pancreatic cancer in postmenopausal women. Cancer Prev Res (Phila) 2019;12:237–46. [DOI] [PMC free article] [PubMed] [Google Scholar]
- 11.Fest J, Vijfhuizen LS, Goeman JJ, et al. Search for early pancreatic cancer blood biomarkers in five European prospective population biobanks using metabolomics. Endocrinology 2019;160:1731–42. [DOI] [PMC free article] [PubMed] [Google Scholar]
- 12.Davidson SM, Jonas O, Keibler MA, et al. Direct evidence for cancer-cell-autonomous extracellular protein catabolism in pancreatic tumors. Nat Med 2017;23:235–41. [DOI] [PMC free article] [PubMed] [Google Scholar]
- 13.Perera RM, Bardeesy N. Pancreatic cancer metabolism: breaking it down to build it back up. Cancer Discov 2015;5:1247–61. [DOI] [PMC free article] [PubMed] [Google Scholar]
- 14.Sullivan LB, Luengo A, Danai LV, et al. Aspartate is an endogenous metabolic limitation for tumour growth. Nature Cell Biology 2018;20:782–8. [DOI] [PMC free article] [PubMed] [Google Scholar]
- 15.Bansal A, Simon MC. Glutathione metabolism in cancer progression and treatment resistance. J Cell Biol 2018;217:2291–8. [DOI] [PMC free article] [PubMed] [Google Scholar]
- 16.McConnell YJ, Farshidfar F, Weljie AM, et al. Distinguishing benign from malignant pancreatic and periampullary lesions using combined use of (1)H-NMR spectroscopy and gas chromatography-mass spectrometry. Metabolites 2017;7. [DOI] [PMC free article] [PubMed] [Google Scholar]
- 17.Sakai A, Suzuki M, Kobayashi T, et al. Pancreatic cancer screening using a multiplatform human serum metabolomics system. Biomark Med 2016;10:577–86. [DOI] [PubMed] [Google Scholar]
- 18.Itoi T, Sugimoto M, Umeda J, et al. Serum metabolomic profiles for human pancreatic cancer discrimination. Int J Mol Sci 2017;18. [DOI] [PMC free article] [PubMed] [Google Scholar]
- 19.Budhu A, Terunuma A, Zhang G, et al. Metabolic profiles are principally different between cancers of the liver, pancreas and breast. Int J Biol Sci 2014;10:966–72. [DOI] [PMC free article] [PubMed] [Google Scholar]
- 20.Lin X, Zhan B, Wen S, et al. Metabonomic alterations from pancreatic intraepithelial neoplasia to pancreatic ductal adenocarcinoma facilitate the identification of biomarkers in serum for early diagnosis of pancreatic cancer. Mol Biosyst 2016;12:2883–92. [DOI] [PubMed] [Google Scholar]
- 21.Wen S, Li Z, Feng J, et al. Metabonomic changes from pancreatic intraepithelial neoplasia to pancreatic ductal adenocarcinoma in tissues from rats. Cancer Sci 2016;107:836–45. [DOI] [PMC free article] [PubMed] [Google Scholar]
- 22.Sugimoto M, Wong DT, Hirayama A, et al. Capillary electrophoresis mass spectrometry-based saliva metabolomics identified oral, breast and pancreatic cancer-specific profiles. Metabolomics 2010;6:78–95. [DOI] [PMC free article] [PubMed] [Google Scholar]
- 23.Shin SY, Fauman EB, Petersen AK, et al. An atlas of genetic influences on human blood metabolites. Nat Genet 2014;46:543–50. [DOI] [PMC free article] [PubMed] [Google Scholar]
- 24.Wolpin BM, Kraft P, Gross M, et al. Pancreatic cancer risk and ABO blood group alleles: results from the pancreatic cancer cohort consortium. Cancer Res 2010;70:1015–23. [DOI] [PMC free article] [PubMed] [Google Scholar]
- 25.Tregouet DA, Morange PE. What is currently known about the genetics of venous thromboembolism at the dawn of next generation sequencing technologies. Br J Haematol 2017. [DOI] [PubMed]
- 26.Vasan SK, Rostgaard K, Majeed A, et al. ABO Blood Group and Risk of Thromboembolic and Arterial Disease: A Study of 1.5 Million Blood Donors. Circulation 2016;133:1449–57; discussion 57. [DOI] [PubMed] [Google Scholar]
- 27.Ansari D, Ansari D, Andersson R, et al. Pancreatic cancer and thromboembolic disease, 150 years after Trousseau. Hepatobiliary Surg Nutr 2015;4:325–35. [DOI] [PMC free article] [PubMed] [Google Scholar]
- 28.Orlowski M, Meister A. The gamma-glutamyl cycle: a possible transport system for amino acids. Proceedings of the National Academy of Sciences of the United States of America 1970;67:1248–55. [DOI] [PMC free article] [PubMed] [Google Scholar]
- 29.Strasak AM, Rapp K, Brant LJ, et al. Association of gamma-glutamyltransferase and risk of cancer incidence in men: a prospective study. Cancer Res 2008;68:3970–7. [DOI] [PMC free article] [PubMed] [Google Scholar]
- 30.Tsuboya T, Kuriyama S, Nagai M, et al. Gamma-glutamyltransferase and cancer incidence: the Ohsaki cohort study. J Epidemiol 2012;22:144–50. [DOI] [PMC free article] [PubMed] [Google Scholar]
- 31.Van Hemelrijck M, Jassem W, Walldius G, et al. Gamma-glutamyltransferase and risk of cancer in a cohort of 545,460 persons - the Swedish AMORIS study. Eur J Cancer 2011;47:2033–41. [DOI] [PubMed] [Google Scholar]
- 32.Moore SC, Playdon MC, Sampson JN, et al. A metabolomics analysis of body mass index and postmenopausal breast cancer risk. J Natl Cancer Inst 2018;110:588–97. [DOI] [PMC free article] [PubMed] [Google Scholar]
- 33.Mastrangelo A, Barbas C. Chronic diseases and lifestyle biomarkers identification by metabolomics. Adv Exp Med Biol 2017;965:235–63. [DOI] [PubMed] [Google Scholar]
- 34.Carayol M, Leitzmann MF, Ferrari P, et al. Blood metabolic signatures of body mass index: A targeted metabolomics study in the EPIC cohort. J Proteome Res 2017;16:3137–46. [DOI] [PMC free article] [PubMed] [Google Scholar]
- 35.Yin X, Subramanian S, Willinger CM, et al. Metabolite signatures of metabolic risk factors and their longitudinal changes. J Clin Endocrinol Metab 2016;101:1779–89. [DOI] [PMC free article] [PubMed] [Google Scholar]
- 36.Shi L, Brunius C, Lehtonen M, et al. Plasma metabolites associated with type 2 diabetes in a Swedish population: a case-control study nested in a prospective cohort. Diabetologia 2018;61:849–61. [DOI] [PMC free article] [PubMed] [Google Scholar]
- 37.Wang TJ, Larson MG, Vasan RS, et al. Metabolite profiles and the risk of developing diabetes. NatMed 2011;17:448–53. [DOI] [PMC free article] [PubMed] [Google Scholar]
- 38.Cheng S, Rhee EP, Larson MG, et al. Metabolite profiling identifies pathways associated with metabolic risk in humans. Circulation 2012;125:2222–31. [DOI] [PMC free article] [PubMed] [Google Scholar]
- 39.Ottosson F, Smith E, Melander O, et al. Altered asparagine and glutamate homeostasis precede coronary artery disease and type-2 diabetes. J Clin Endocrinol Metab 2018. [DOI] [PubMed]
- 40.Ottosson F, Smith E, Gallo W, et al. Purine metabolites and carnitine biosynthesis intermediates are novel biomarkers for incident type 2 diabetes. The Journal of Clinical Endocrinology & Metabolism 2019. [DOI] [PMC free article] [PubMed]
- 41.Stolzenberg-Solomon RZ, Schairer C, Moore S, et al. Lifetime adiposity and risk of pancreatic cancer in the NIH-AARP Diet and Health Study cohort. Am J Clin Nutr 2013;98:1057–65. [DOI] [PMC free article] [PubMed] [Google Scholar]
- 42.Genkinger JM, Spiegelman D, Anderson KE, et al. A pooled analysis of 14 cohort studies of anthropometric factors and pancreatic cancer risk. IntJ Cancer 2011;129:1708–17. [DOI] [PMC free article] [PubMed] [Google Scholar]
- 43.Lee S, Zhang C, Kilicarslan M, et al. Integrated Network Analysis Reveals an Association between Plasma Mannose Levels and Insulin Resistance. Cell Metab 2016;24:172–84. [DOI] [PMC free article] [PubMed] [Google Scholar]
- 44.van Geenen EJ, Smits MM, Schreuder TC, et al. Nonalcoholic fatty liver disease is related to nonalcoholic fatty pancreas disease. Pancreas 2010;39:1185–90. [DOI] [PubMed] [Google Scholar]
- 45.Wong VW, Wong GL, Yeung DK, et al. Fatty pancreas, insulin resistance, and beta-cell function: a population study using fat-water magnetic resonance imaging. Am J Gastroenterol 2014;109:589–97. [DOI] [PubMed] [Google Scholar]
- 46.Hori M, Takahashi M, Hiraoka N, et al. Association of pancreatic Fatty infiltration with pancreatic ductal adenocarcinoma. ClinTranslGastroenterol 2014;5:e53. [DOI] [PMC free article] [PubMed] [Google Scholar]
- 47.Dinges SS, Hohm A, Vandergrift LA, et al. Cancer metabolomic markers in urine: evidence, techniques and recommendations. Nature Reviews Urology 2019;16:339–62. [DOI] [PubMed] [Google Scholar]
- 48.Djukovic D, Baniasadi HR, Kc R, et al. Targeted serum metabolite profiling of nucleosides in esophageal adenocarcinoma. Rapid Commun Mass Spectrom 2010;24:3057–62. [DOI] [PubMed] [Google Scholar]
- 49.Loft S, Svoboda P, Kasai H, et al. Prospective study of urinary excretion of 7-methylguanine and the risk of lung cancer: Effect modification by mu class glutathione-S-transferases. Int J Cancer 2007;121:1579–84. [DOI] [PubMed] [Google Scholar]
Associated Data
This section collects any data citations, data availability statements, or supplementary materials included in this article.