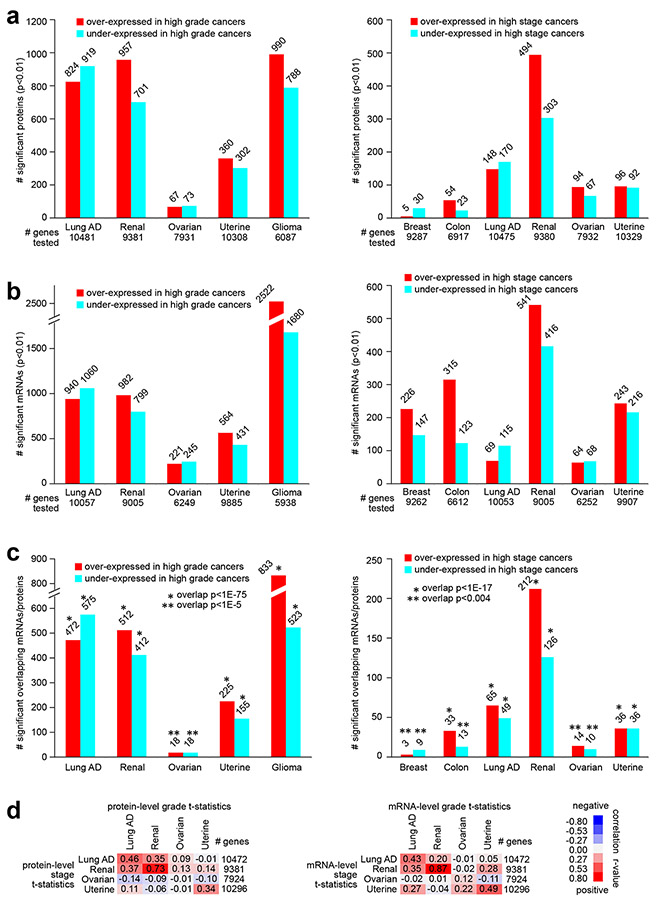
Fig. 1. Proteomic and transcriptomic signatures of high grade or high stage cancers, according to cancer type.
(a) For each of the indicated cancer types, numbers of top differentially expressed proteins (p<0.01, Pearson’s using log-transformed data), associated with higher cancer grade (left) or with higher cancer stage (right). Numbers of unique genes tested are indicated for each comparison (involving proteins for which measurements were made in over half of samples profiled). (b) Similar to part a, but for differentially expressed mRNAs. Numbers of unique genes tested are indicated for each comparison (involving mRNAs with available data for which proteins were considered in part a). (c) Overlapping top protein and mRNA features (p<0.01 for protein and p<0.05 for mRNA, based on shared gene) by comparisons according to grade (left) or according to stage (right). P-values for significance of overlap by one-sided Fisher’s exact tests. (d) For each cancer type, overall concordance or discordance in differential gene feature patterns between grade (columns) and stage (rows) comparisons for both protein data (left) and mRNA data (right). For all gene features examined, correlations between t-statistic by grade comparison versus t-statistic by stage comparison were computed (based on all profiled features). R-values by Pearson’s are shown. Red square denotes overall concordance between grade and stage results for the given cancer type, and blue square denotes discordance. Breast, Breast invasive carcinoma; Colon, Colon adenocarcinoma; Lung AD, Lung adenocarcinoma; Renal, Clear cell renal cell carcinoma; Ovarian, Ovarian serous carcinoma; Uterine, Uterine corpus endometrial carcinoma; Glioma, Pediatric glioma. See also Figs. S1, S2, and S3 and Supplementary Data 1-6.

