

Abstract
Background and Objectives:
Spatial Frequency Domain Imaging (SFDI), an optical imaging technique capable of quantitatively measuring tissue hemodynamics over a large field-of-view, has captured the interest of scientists and clinicians due to its ability to image rapidly and noninvasively. The goal of this study was to apply SFDI in a preclinical murine model to assess its ability to measure hemodynamic changes due to hindlimb ischemia in vivo longitudinally.
Materials and Methods:
Complete unilateral femoral artery ligation was performed on a total of nine C57BL/6J mice to induce ischemia in the left hindlimb. Changes in vascular perfusion in each mouse was monitored through SFDI acquisition of both the ischemic and control limbs throughout the course of four weeks. High frequency pulsed-wave Doppler ultrasound was also acquired to confirm occlusion of the left femoral artery post-ligation compared to the control limb while histological analysis was used to quantify femoral artery lumen shape and size.
Results:
Tissue oxygen saturation in the ischemic limb normalized to the control limb decreased from a ratio of 0.96±0.06 at baseline to 0.86±0.10 at day 1, then 0.94±0.06 at day 3, followed by 0.95±0.14 at day 7, 0.91±0.09 at day 14, 0.90±0.09 at day 21, and 1.01±0.09 at day 28.
Conclusion:
The results of this study indicate the utility of SFDI to detect hemodynamic changes in a preclinical murine model, as well as how to effectively use this tool to extract information regarding ischemia-induced hindlimb changes. In our model we observed a decline in tissue oxygen saturation within one day post-ischemic injury, followed by a return to baseline values over the four week study period. While reducing skin artifacts and modifying camera hardware could still improve this murine imaging approach, our multimodality study presented here suggests that SFDI can be used to reliably characterize ischemia mediated changes in a clinically relevant mouse model of peripheral arterial disease.
Keywords: optical imaging, near infrared spectroscopy, spatial frequency domain imaging, peripheral artery disease, hemodynamics
INTRODUCTION
More than 202 million people on a global scale and approximately 8.5 million Americans ≥ 40 years of age are affected by peripheral artery disease (PAD) [1, 2]. The risks associated with PAD range from heart attack to stroke as well as limb amputation [3] primarily as a result of atherosclerosis, or the build-up of plaque within the systemic arteries [4]. A majority of patients with PAD do not present symptoms, such as leg pain [5], making treatment of PAD challenging during its early phases.
The financial impact of PAD is also important to consider. Mean annual healthcare expenditures for patients with PAD are estimated at more than $12,000 annually [6], with surgical intervention accounting for a majority of these expenditures [3]. In comparison, those without PAD spend on average less than $5,000 per year on healthcare [6], indicating the need to develop therapies to treat PAD which can be accelerated through the monitoring of PAD progression via an affordable and noninvasive imaging technique applied to preclinical models of hindlimb ischemia.
A method frequently used to assess PAD is the ankle brachial index (ABI), which can be calculated as the ratio between the systolic blood pressures of the ankle and the arm [1, 7]. Although it is a low-cost and noninvasive tool to quickly evaluate PAD, the accuracy of this method for all patients is variable. While several methods to determine ABI exist, the standardization of how ABI is calculated is necessary in instances for which ABI sensitivity declines, such as in patients with severe cases of diabetes [7].
A noninvasive imaging modality with superior spatial and temporal resolution and large penetration depth that is affordable with quick-acquisition time is therefore needed to comprehensively assess vascular function in a model of peripheral ischemia. Imaging methods such as ultrasound and computed tomography (CT) can be used for vascular imaging [8], however these noninvasive imaging approaches do not provide the resolution needed to capture hemoglobin information at the capillary level [9]. Magnetic resonance imaging can be used to assess vascular hemodynamics, but it is often costly and has lower spatial/temporal resolution compared to ultrasound and CT [8]. Digital Subtraction Angiography has been referred to as the gold standard in evaluating atherosclerosis of the lower extremities because of its superior resolution and ability to identify calcified arteries [10, 11]. This modality, however, requires ionizing radiation, is invasive, and carries risks like arterial dissection or rupture [10, 12]. Laser Doppler Perfusion Imaging (LDPI) measures blood flow in the human microvasculature but is often limited by its depth of penetration, approximately 1 mm, which depends on the tissue being imaged and the light source being used [13, 14, 15]. Multispectral optoacoustic tomography (MSOT), a more quantitative approach with greater penetration depth (3–4 cm), has been applied in a clinical setting on patients during temporary arterial occlusion to quantify muscle perfusion and oxygenation by extraction of Hb and HbO parameters [16]. Likewise, Near Infrared Spectroscopy (NIRS) has the capability of reaching depths of several centimeters and can even be used to track such hemodynamic parameters in preclinical models of disease over long periods of time [17].
In this study we implement a noninvasive technique unique to NIRS known as Spatial Frequency Domain Imaging (SFDI) [17] to quantitatively obtain measurements of oxyhemoglobin and deoxyhemoglobin concentrations in a murine model of hindlimb ischemia by directly measuring and correcting for tissue optical scattering. This wide-field camera-based method has been used in both a clinical and preclinical setting to measure tissue oxygenation by extracting oxy- and deoxyhemoglobin concentration in blood at depths greater than 1 mm and up to 3 mm in mouse skin, depending on the application [18]. The relatively low absorption of NIR light in tissue and high sensitivity levels of NIRS has allowed this modality to gain prominence in vascular imaging applications [8]. For example, a study by Yafi et al. demonstrates SFDI application in studying the microvasculature of the skin in a preclinical cutaneous flap model by which tissue reperfusion is assessed by measuring oxy- and deoxyhemoglobin, total hemoglobin, and tissue oxygen saturation in rats [19]. Detection of vascular occlusion in studies involving the use of SFDI principles in pedicle flap studies in murine [20] and porcine [21] models have also been used to assess tissue health in time frames of 65 minutes to 4 hours, respectively. Other studies, such as that of Weinkauf et al. demonstrate the ability of SFDI to take clinical measurements of perfusion in diabetic vs. nondiabetic patients with and without PAD short-term.
To our knowledge, this is the first report of SFDI used in a longitudinal study of murine hindlimb ischemia for PAD assessment. Although SFDI has been used in a human study of PAD, it has only been implemented on the plantar aspect of the foot at a single timepoint and not further upstream [22], which may provide a more holistic view of ischemia-mediated effects. The initial goal of this study, thus, is not short-term translation, but to demonstrate the use of this technique as a preclinical imaging tool to study long-term effects of ischemic injury in a PAD model with repeatability and specificity despite optical scattering and other limitations common to optical imaging modes such as imaging depth [17]. With this technique, we are able to track vascular function before, during, and after induction of ischemia throughout the course of 28 days.
In order to validate this method, we used high frequency pulsed-wave Doppler ultrasound to measure blood velocity in the hindlimbs and histology to confirm occlusion of the femoral arteries. The study performed was used to determine whether NIRS SFDI could effectively measure changes in hemodynamics in our preclinical model, which shows potential in the monitoring of PAD. By detecting these hemodynamic parameters using SFDI, we can also determine if this method can be incorporated in the quantification of other ischemic vascular diseases beyond PAD.
MATERIALS AND METHODS
SFDI System Design
SFDI, a wide-field and non-contact imaging technique, can measure the pixel-wise absorption and scattering profiles of tissue using multispectral structured illumination. Spatially modulated light in the visible and near infrared range is projected at different spatial frequencies onto tissue, from which the reflected light is captured by a CCD or CMOS camera [23]. The optical properties of absorption and scattering are then obtained by fitting the demodulated reflectance data to a light transport model [24]. Using the Beer-Lambert Law, the wavelength dependence of light absorption is analyzed to extract chromophore maps of oxyhemoglobin (HbO) and deoxyhemoglobin (Hb) [25]. Total hemoglobin (THb = HbO + Hb) and oxygen saturation (StO2 = HbO / THb × 100) can then be calculated from these parameters.
In this study we used the Reflect RS™ SFDI system (Modulim, Irvine, CA) for all optical measurements (Figure 1). We acquired images at spatial frequencies 0 and 0.1 mm−1 at 659, 731, and 851 nm wavelengths. Depth sensitivity is estimated to be up to 3 mm for mouse skin imaged at a 851 nm wavelength and spatial frequency of 0 mm−1 [18]. Calibration was accomplished via the use of a phantom with known optical properties [17, 24]. A custom MATLAB (The Math-works Inc., Natick, MA) code for calibration, demodulation, height and angle correction, as well as optical property and chromophore extraction in raw image data was also utilized [26].
Fig. 1:
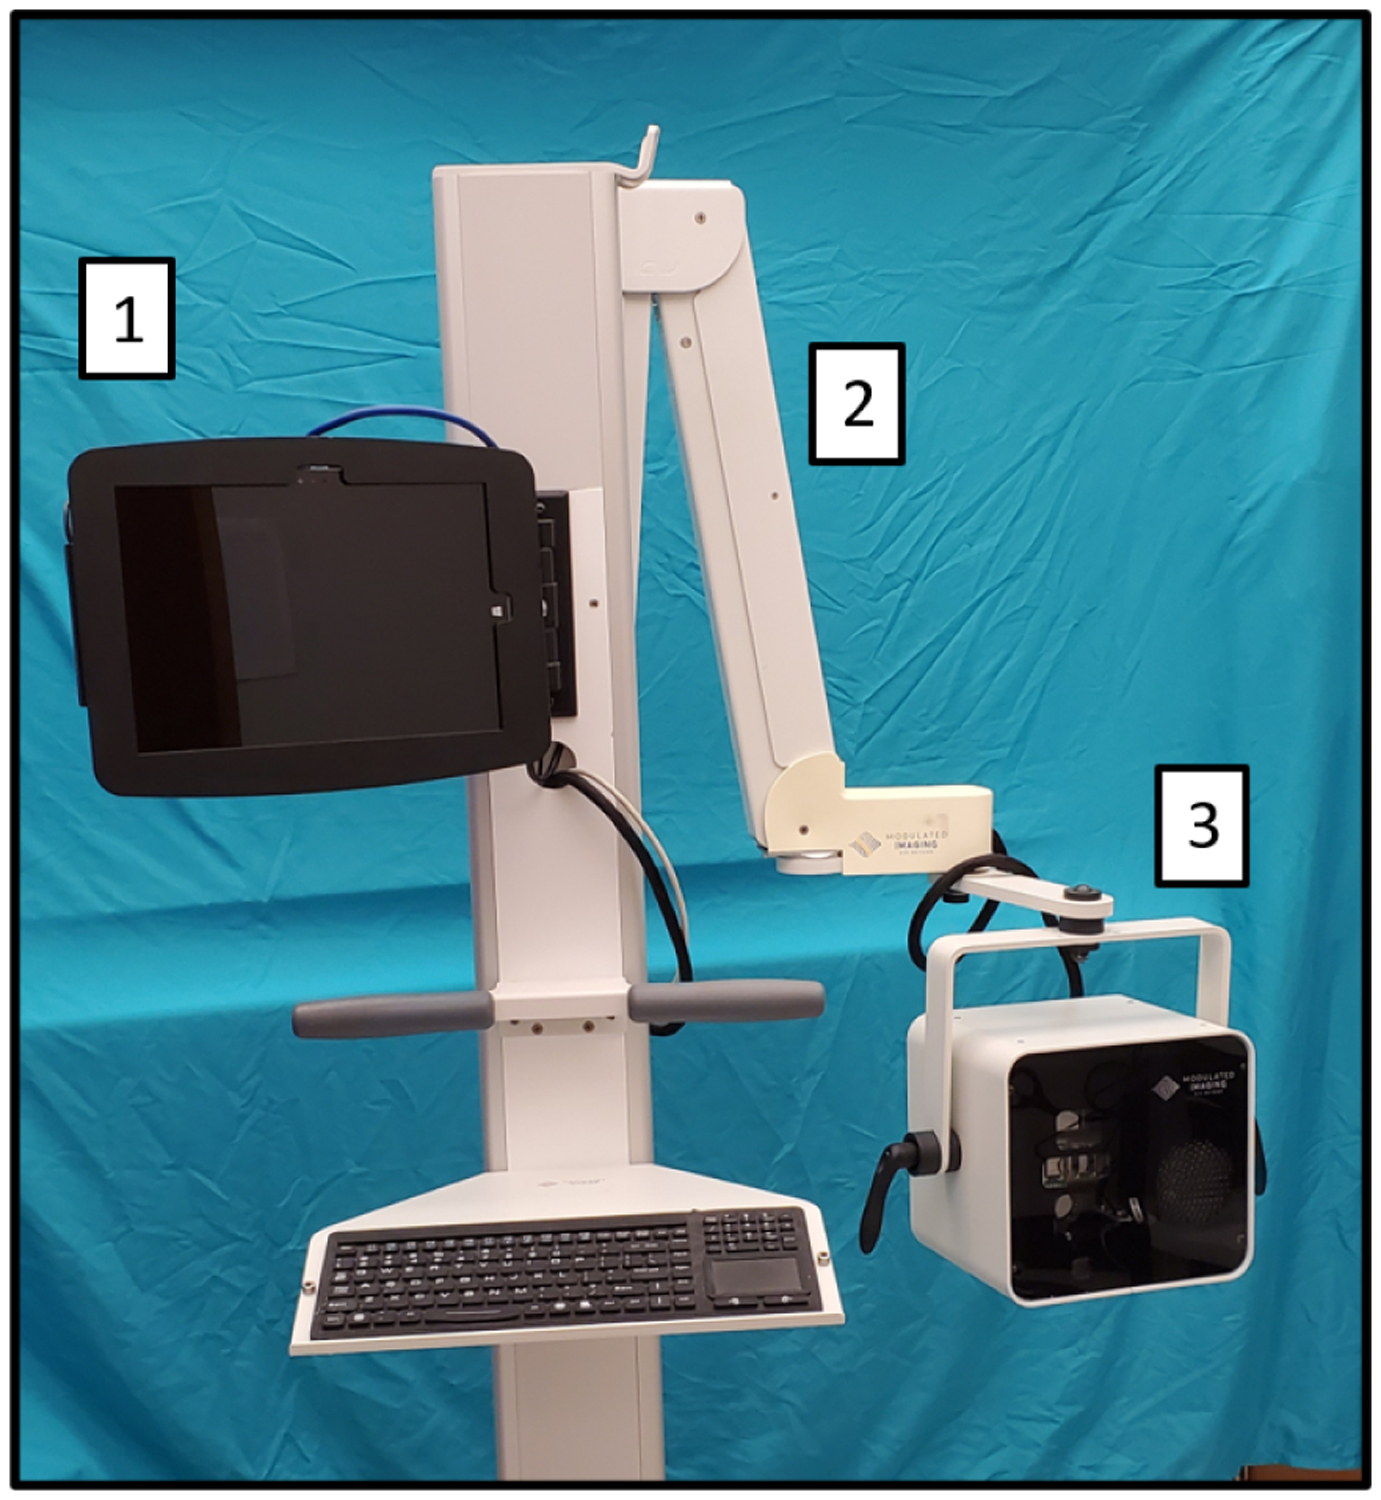
Modulim’s Reflect RS™ with features utilized in the collection of preclinical SFDI. 1) Touch screen interface. 2) Extendable arm for positioning imaging head. 3) SFDI imaging head.
In Vivo Validation Study
C57BL/6J mice (n=9), chosen for their wide use and availability in biomedical research [27], 5 to 10 weeks old were acquired from Jackson Laboratory (Bar Harbor, ME). All protocols and procedures employed in this study were ethically reviewed and approved by the Institutional Animal Care and Use Committee (IACUC) and comply with the US National Research Council’s Guide for the Care and Use of Laboratory Animals as well as the US Public Health Service’s Policy on Humane Care and Use of Laboratory Animals. We performed baseline imaging of the vascular networks downstream the hindlimbs with SFDI and ultrasound. For this study, the right hindlimb served as the control. To begin the baseline imaging process on ultrasound, anesthesia was administered to each mouse using a traditional vaporizer (1.5 – 3% isoflurane). To maintain body temperature, each mouse was affixed to a heating stage in the supine position and a rectal probe was used to ensure temperature was maintained at 34–36°C. Prior to imaging, eye lubricant was applied to the eyes of the animals and depilatory cream was used to remove fur below the waist. Electrodes on the heating stage were also used to monitor and maintain the heart rate of the animal at 450 to 600 bpm and respiratory rate at 40 to 80 breaths per minute. Long-axis B-mode, color Doppler, and pulsed-wave Doppler ultrasound images of the femoral arteries of both limbs were then acquired using a Vevo3100 high frequency small animal ultrasound system (FUJIFILM Visual Sonics, Toronto, Ontario, Canada) with a 40 MHz center frequency transducer. SFDI images were then obtained using the Reflect RS™, a non-contact NIRS research device. Before imaging each animal, a square phantom made of silicone was placed on a flat and stable surface to calibrate the device. After calibration, each animal was anesthetized once more with a digital vaporizor (SomnoSuite, Kent Scientific, Torrington, CT) using 1.5–3% isoflurane and underwent a similar procedure during ultrasound imaging in which eye lubrication and temperature monitoring were used to prepare the animal before data collection. Wide-field images of the mouse (Figure 3) were acquired to measure scattering and absorption spectra and used to calculate the HbO, Hb, THb, and StO2 chromophore concentration maps. Each measurement, including alignment of the system and mouse placement, takes approximately 5 minutes. Calibration, done once at the beginning of each imaging session, takes an additional 5 minutes.
Fig. 3:
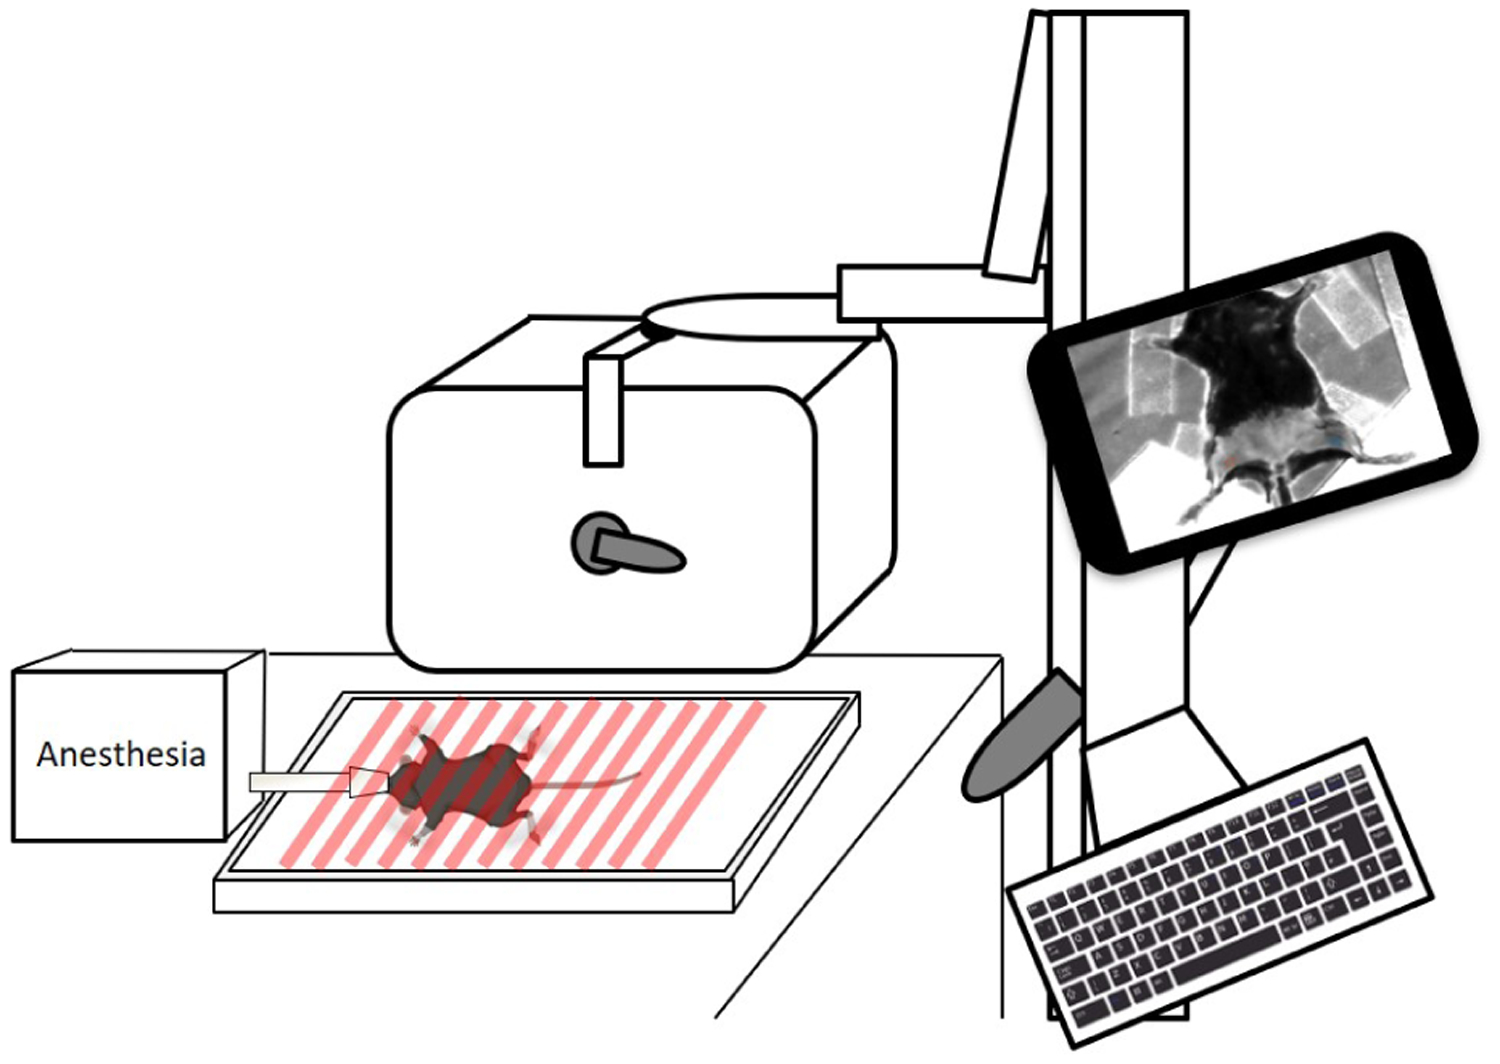
System setup of in vivo imaging with SFDI device delivering spatially modulated light on anesthetized mouse. Created with Biorender.com
To simulate PAD progression in our preclinical murine model, hindlimb ischemia was induced after baseline imaging via a complete femoral artery ligation procedure in the left leg of each animal. Using the SomnoSuite with 1.5 – 3% isoflurane and 225 mL/min room air, animals were anesthetized, eye lubricant was applied, and sterilization of the left hindlimb was accomplished in preparation for the following procedure. The femoral artery was exposed by first making an incision in the left hindlimb midway of the knee and towards the medial thigh [28]. Fine forceps were then used to dissect subcutaneous fat-tissue and the femoral artery was identified. The femoral vasculature consisting of the femoral nerve, artery, and vein was separated and a 6–0 silk suture was proximally placed toward the iliac arteries to ligate the femoral artery using a double knot. Sutures were then used to close the incision on the skin and the mice were removed from anesthesia to be monitored for one hour after surgery. SFDI images of each mouse were then taken for 4 weeks at days 1, 3, 7, 14, 21, and 28 post-surgery while ultrasound images were taken at days 3, 7, 14, 21, and 28. Ultrasound data was not collected on day 1 to minimize the time mice were anesthetized after surgery.
Histology
Euthanization of mice after the four week study period was followed by exposure of the femoral vasculature (Figure 2) and hindlimbs were dissected from 5 of 9 mice to be used for histology. Hindlimbs were fixed in 4% paraformaldehyde, embedded in paraffin, sliced proximal to the femoral condyles, and stained with hematoxylin and eosin (H&E). Using a Leica microscope, femoral arteries from the ischemic and control limbs were identified and captured (Figure 4) using an ICC50 W HD camera (Leica Microsystems, Wetzlar, Germany).
Fig. 2:
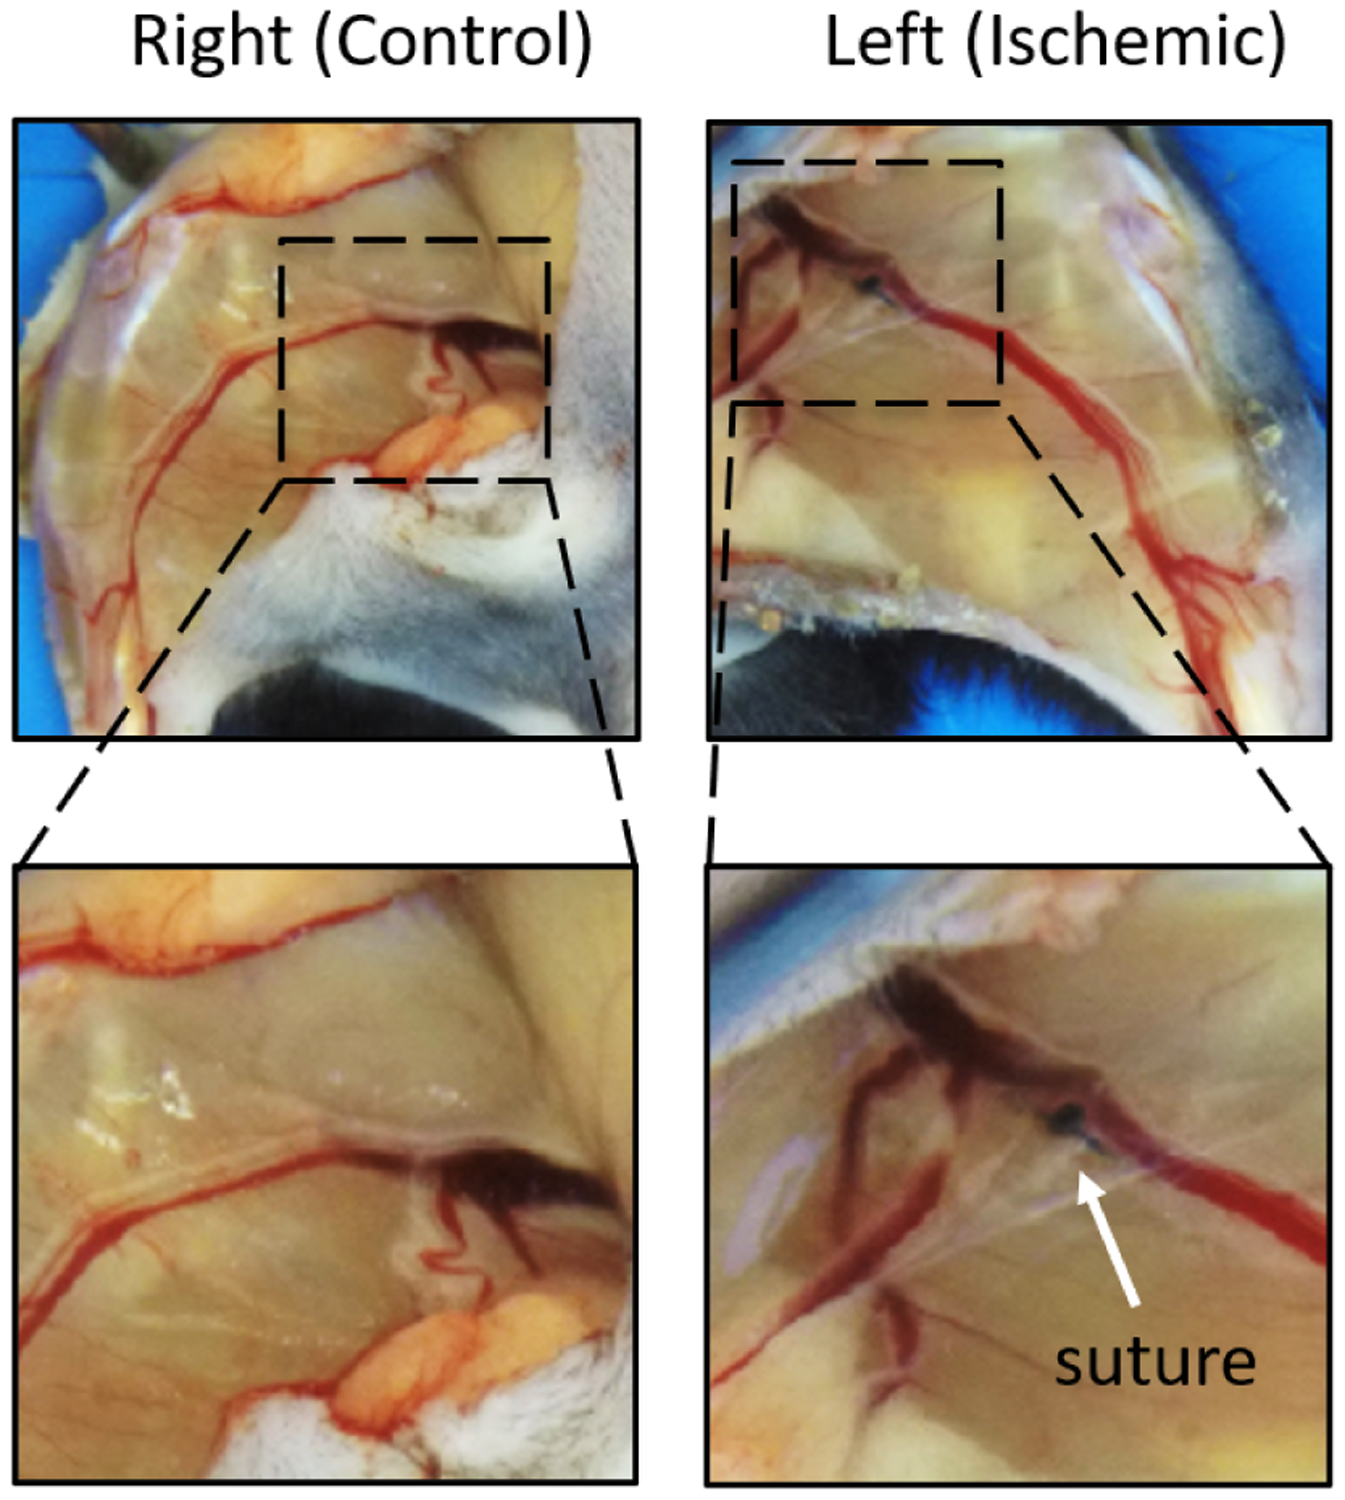
Exposed vasculature of control hindlimb and ischemic hindlimb from one of nine mice 28 days post-ligation. Suture was placed below the iliac artery between the femoral vein and nerve.
Fig. 4:
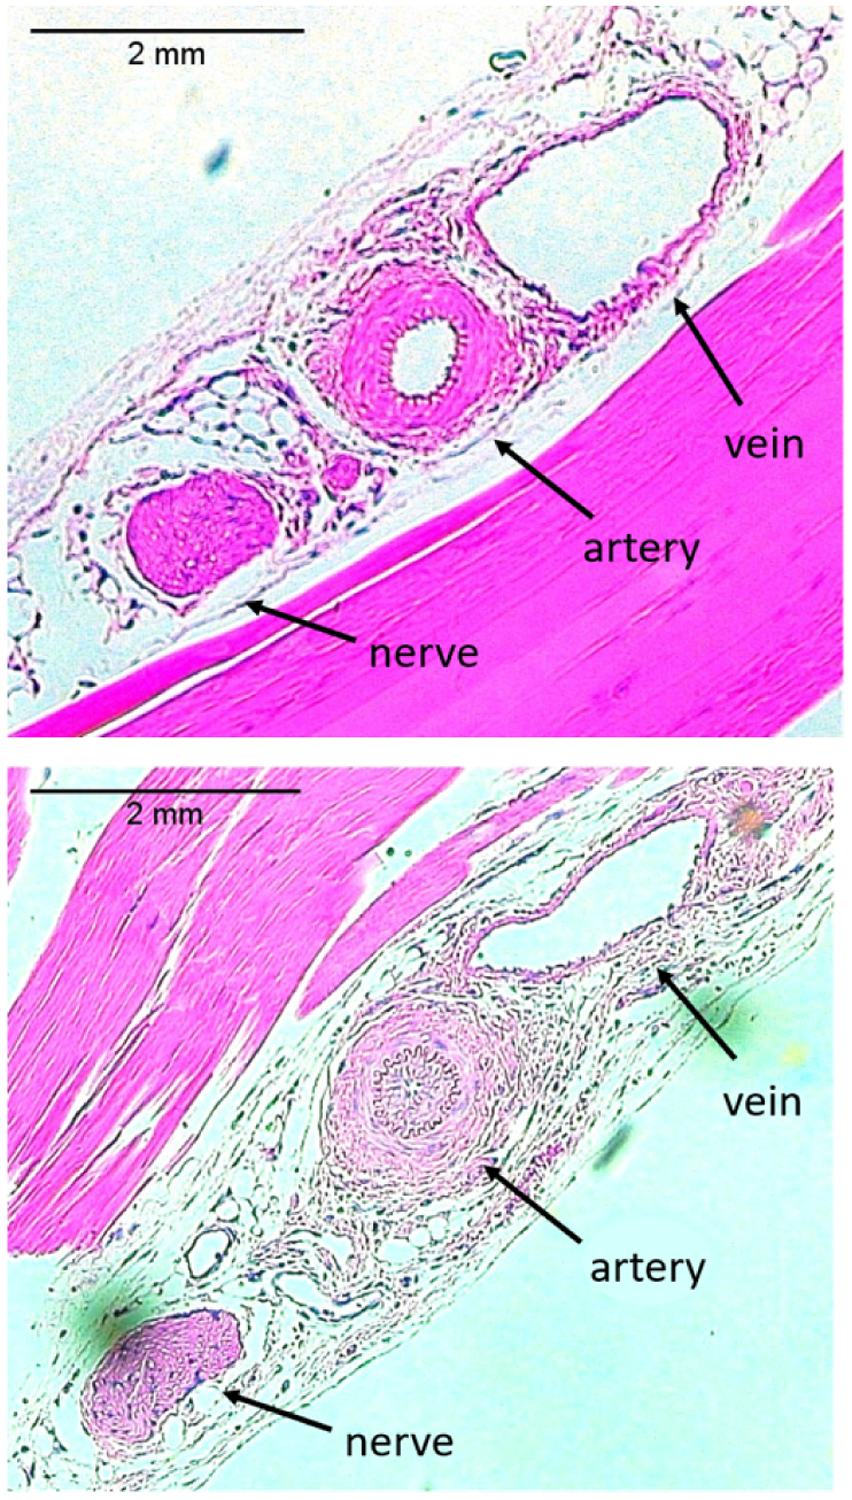
Histology slides of control limb (top) and ischemic limb (bottom) from one of n = 9 mice demonstrating the femoral vein, artery, and nerve.
ROI selection
Using a custom MATLAB GUI, a region of interest (ROI) with an average size of 46.2 ± 2.5 mm2 from each chromophore image of the mice was manually selected in the control and ischemic limbs, as seen in the reflectance and scattering images of Figure 5. ROI selection is accomplished by selecting points on the reflectance image first, particularly in the ischemic lower hindlimb region away from the suture, as shown in Figure 5A. The ROI is then saved and mirrored on to the control limb. Once both ROIs have been selected and saved on the reflectance image, they appear on the scattering image as shown in Figure 5B. The colorbar on the scattering image indicates the intensity of scattering, with the highest value appearing red and lowest value appearing blue in color. Chromophore concentration average and standard deviation values in the ROIs were calculated and compared among ischemic and control limbs.
Fig. 5:
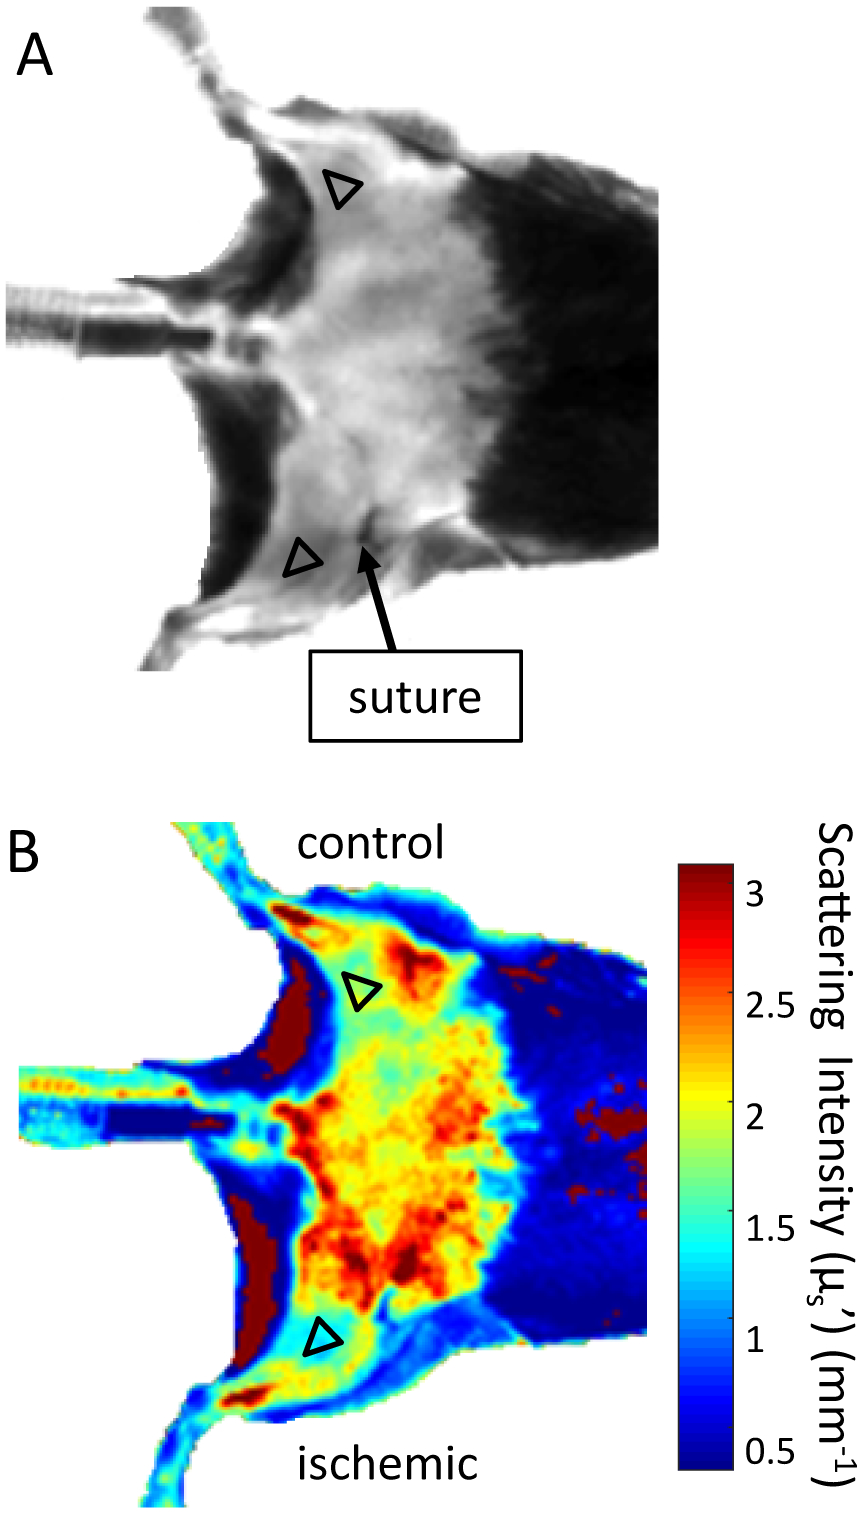
Sample (A) reflectance image and (B) scattering image of ROI selection using custom MATLAB script on the hindlimbs of one of n = 9 mice at day 3. Color bar in (B) indicates scattering intensity in mm−1.
To check for system variability, a similar procedure was followed in which ROI selection on the calibration phantom was used to quantify absorption and scattering coefficients at the three wavelengths used throughout the study (659, 731, and 851 nm).
Image Analysis
Vevo LAB (FUJIFILM VisualSonics) was used to analyze ultrasound images (Figure 10 A–B) and MATLAB was used to extract the average peak velocity from the pulsed-wave Doppler data of the femoral arteries (Figure 11). In 3 of 5 histology slides, the femoral arteries could be identified in both the ischemic and control limbs. Histology slides were first analyzed on LAS X Life Science software from the Leica Application Suite X and adjusted for contrast and brightness on Fiji software [29]. Quantification of femoral artery lumen size was done by manually selecting the lumen area on MATLAB and then calculating the area via a custom MATLAB code (Figure 12).
Statistical Analysis
The Shapiro-Wilk test was used to test for Gaussian distributions within our datasets. Each timepoint passed the normality test (95% confidence interval) except for baseline and day 7. Thus, to test for significant differences in SFDI ishemic to control ratio, a Kruskal-Wallis non-parametric one-way analysis of variance with a Dunn’s post-hoc for multiple comparisons (95% confidence interval) was used for all parameters comparing all timepoints to baseline and all timepoints with each other. A two-tailed unpaired parametric Student’s t-test with unequal variance was also used to compare the lumen area between the ischemic and control limbs after day 28.
RESULTS
SFDI Results
Average chromophore concentrations (HbO and Hb) and derived tissue parameters (THb and StO2) of the selected ROIs from both the ischemic and control limbs for all nine mice across all timepoints (Days 0, 1, 3, 7, 14, 21, and 28) were calculated (Figure 6). Ischemic to control ratios for all four parameters across all timepoints were also calculated (Figure 7). From a qualitative perspective, we observe an immediate drop in the StO2 ischemic to control ratio at day 1 post-surgery (Figure 8) followed by a slow increase in ischemic to control ratio leveling off to baseline values by day 28. Statistically, we see a significant difference in StO2 ischemic to control ratio between baseline and day 1 (p = 0.0335) when comparing all timepoints to baseline (Figure 7). We also observed a significant difference between day 1 and day 28 (p = 0.0399) when comparing all timepoints among each other. Additionally, there was a reduction in HbO by approximately 19±15.8% (p = 0.149), a reduction in THb by 9.5±13.8%, and a reduction in %StO2 by 10.8±8.2% average on one day post-surgery relative to baseline in the ischemic limb compared to the control limb. Additionally, results from phantom data show little variation in absorption (1 – 1.2% normalized standard deviation) and scattering (0.28 – 0.31% normalized standard deviation) (Figure 9).
Fig. 6:
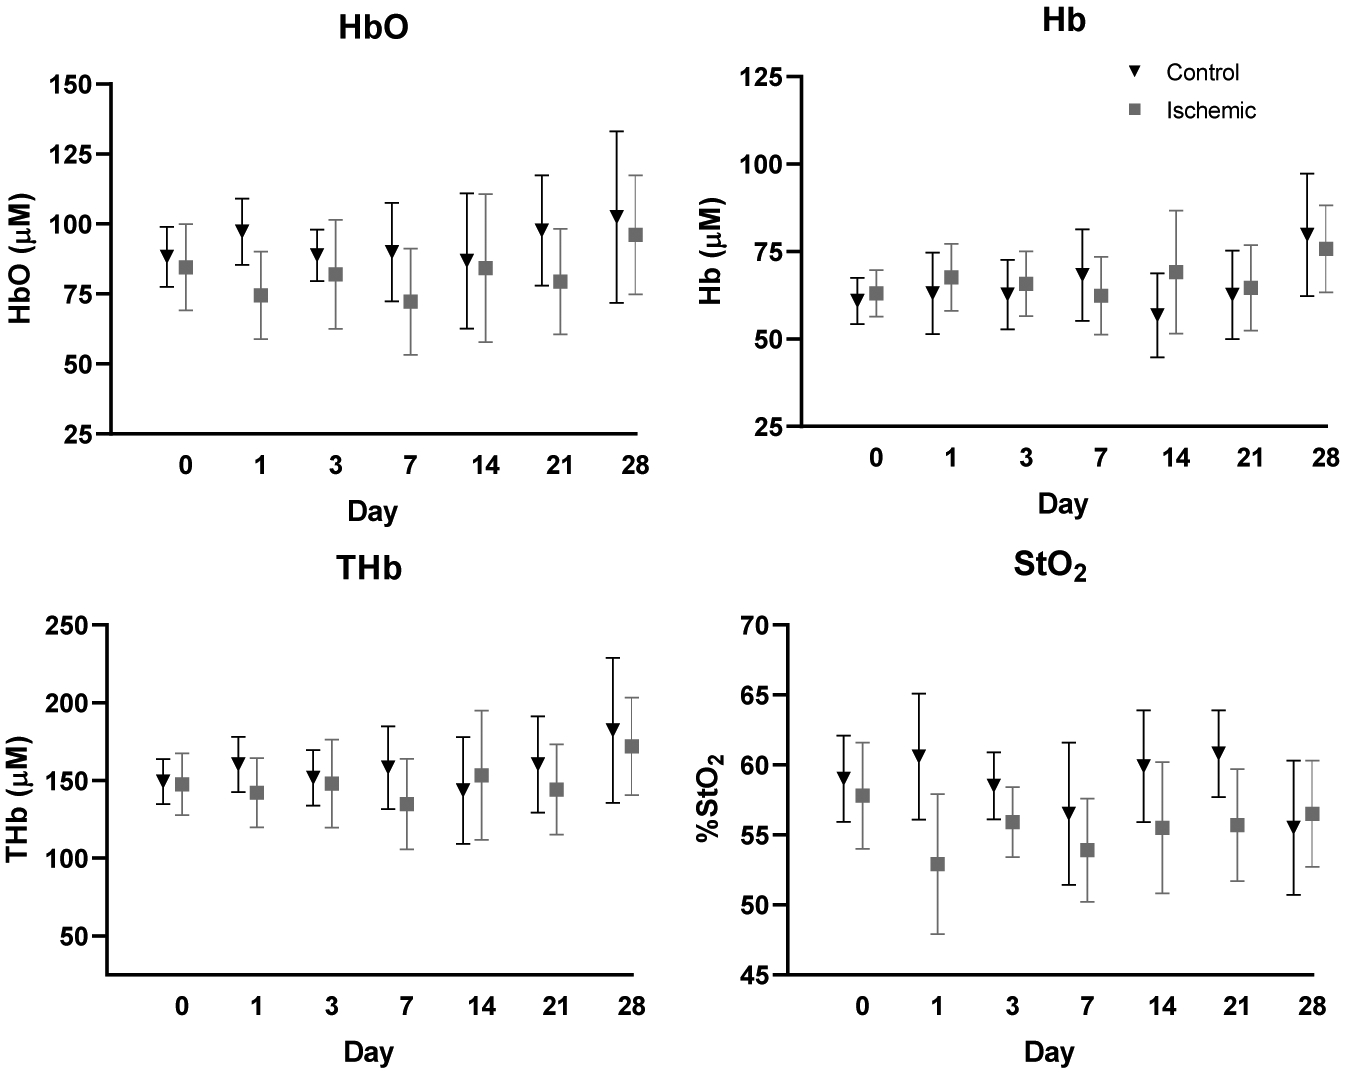
Average HbO, Hb, THb, and StO2 chromophore concentrations of ischemic and control limbs across all timepoints. Error bars represent standard deviation for all mice (n = 9) at each timepoint.
Fig. 7:
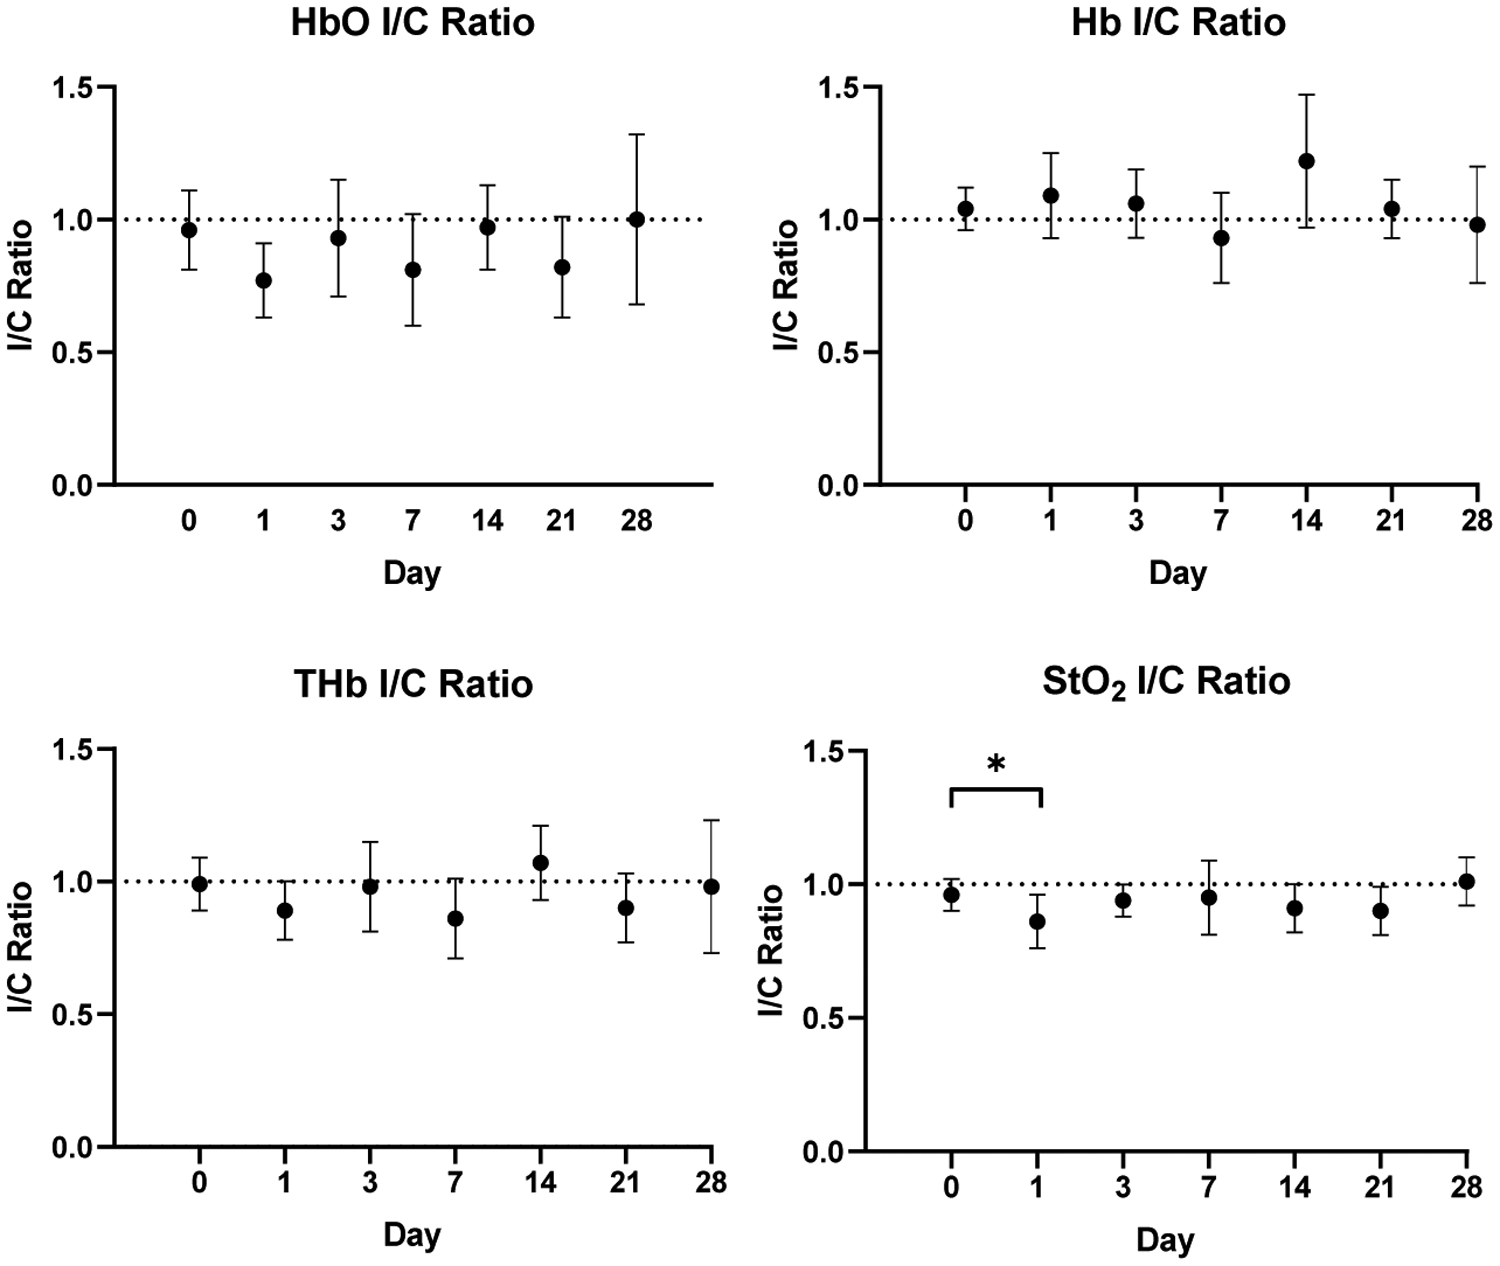
Average ischemic to control (I/C) ratios for all four parameters across all timepoints. Quantitative assessment shows statistical significance in StO2 ischemic to control ratio between baseline and day 1 (p<0.05). Error bars show standard deviation for all mice (n = 9) at each timepoint.
Fig. 8:
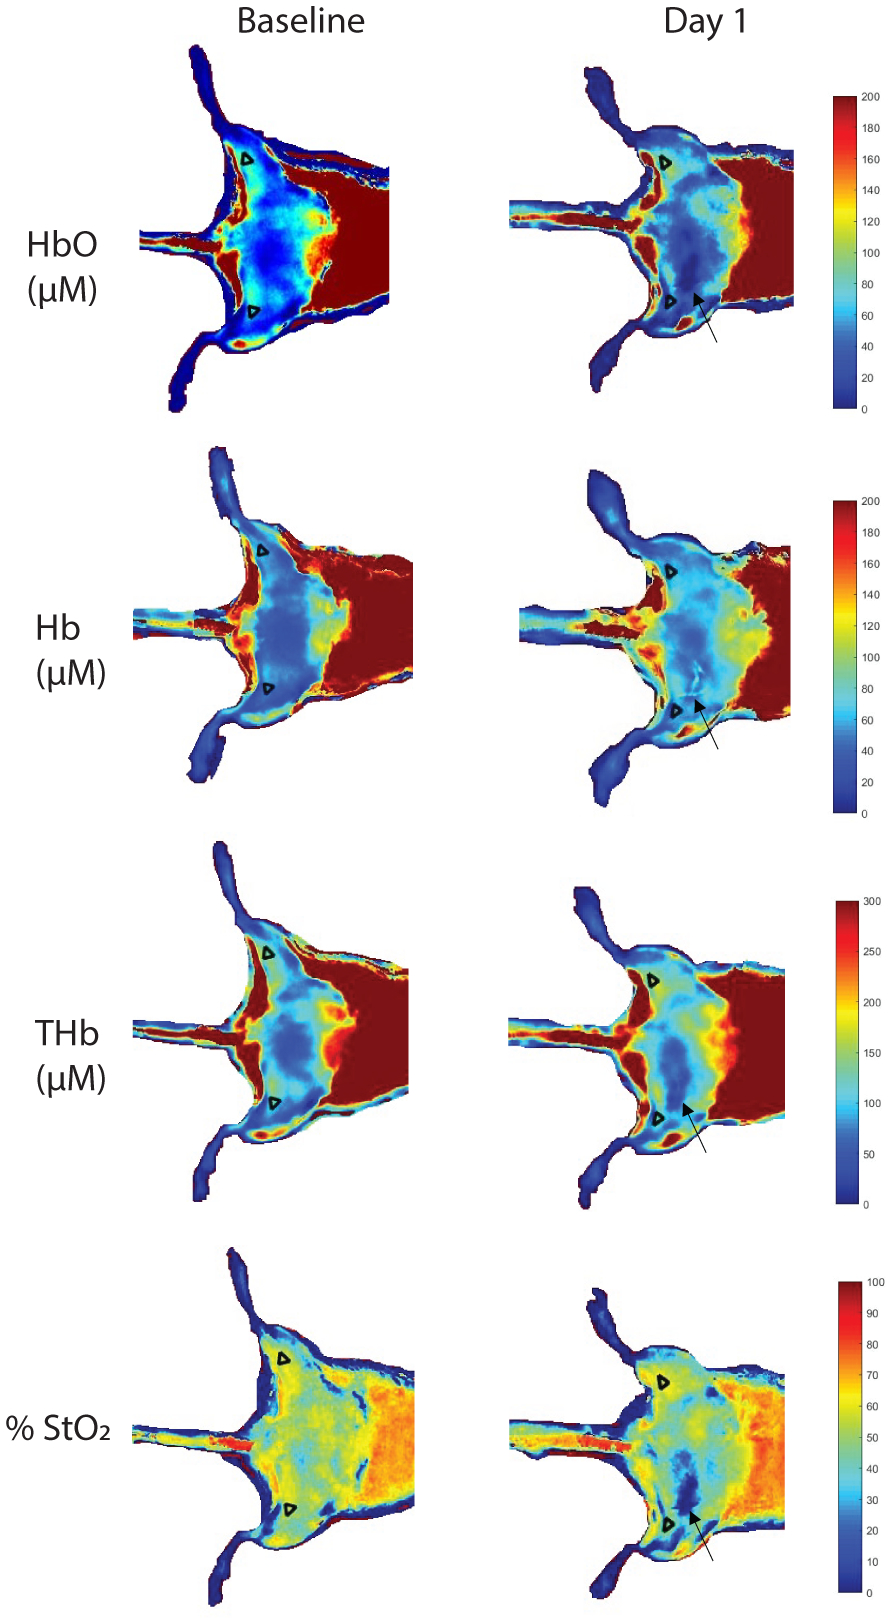
Representative SFDI chromophore maps of one mouse at baseline and at day 1 with ROIs overlaid. Arrows point to suture location on ischemic limb. Color bars indicate intensity for HbO, Hb, and THb in micromolars and StO2 percentage.
Fig. 9:
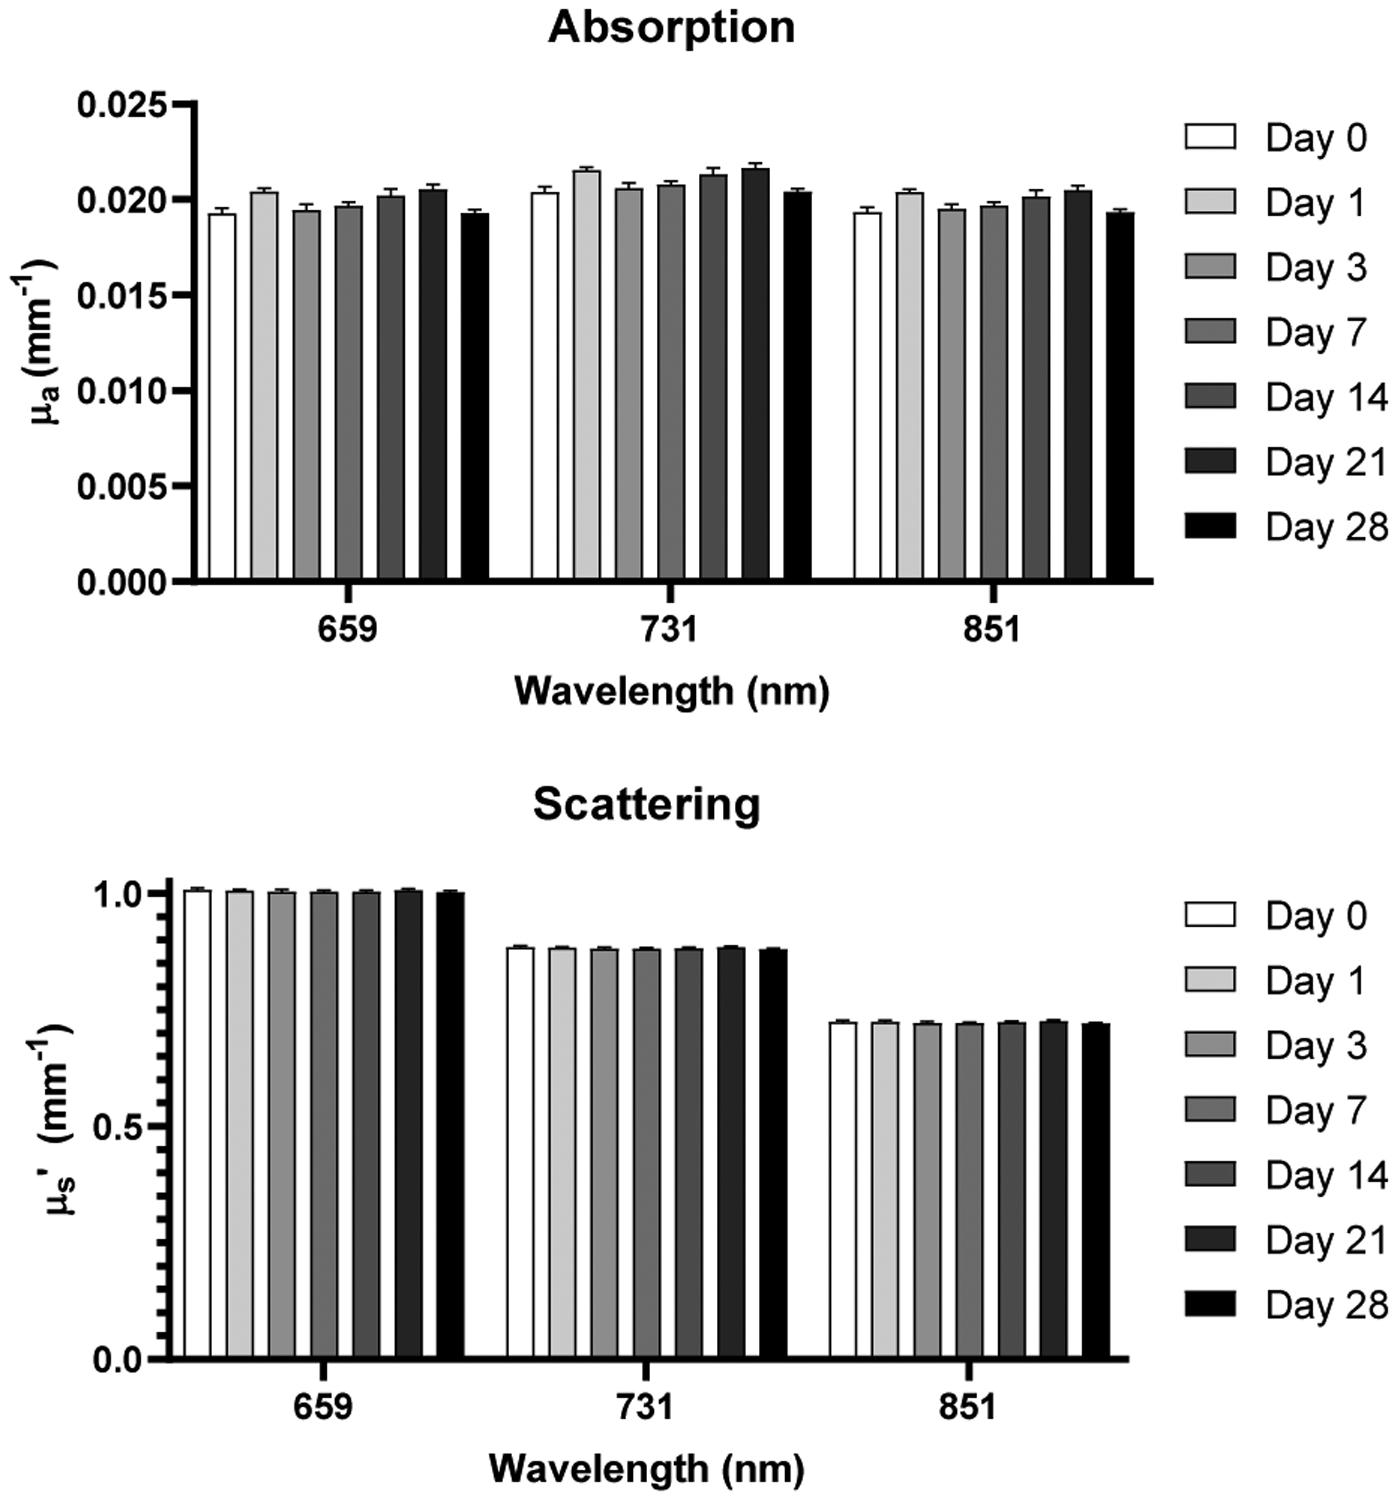
Absorption and scattering coefficients acquired from calibration phantom data across all timepoints and wavelengths employed by SFDI system.
Ultrasound Results
The average peak blood flow velocities of the femoral arteries in the ischemic and control limbs of all nine mice acquired from pulsed-wave Doppler ultrasound are summarized in Figure 11 for imaging at baseline and days 3, 7, 14, 21, and 28. An example of pulsed-wave Doppler images (day 14) of the hindlimbs of one of n = 9 mice from which this data was obtained is shown in Figure 10. The peak blood flow velocities at baseline were, on average, 5.59 ± 2.17 cm/s in the control limb and 4.78 ± 2.48 cm/s in the ischemic limb. After baseline, the peak blood flow velocity in the control limb varied but remained above 3.20 ± 1.26 cm/s, while the peak blood flow velocity in the ischemic limb after baseline was 0 ± 0 cm/s at day 3 onward. Occlusion of the ischemic limb after ligation is therefore confirmed by these results.
Fig. 11:
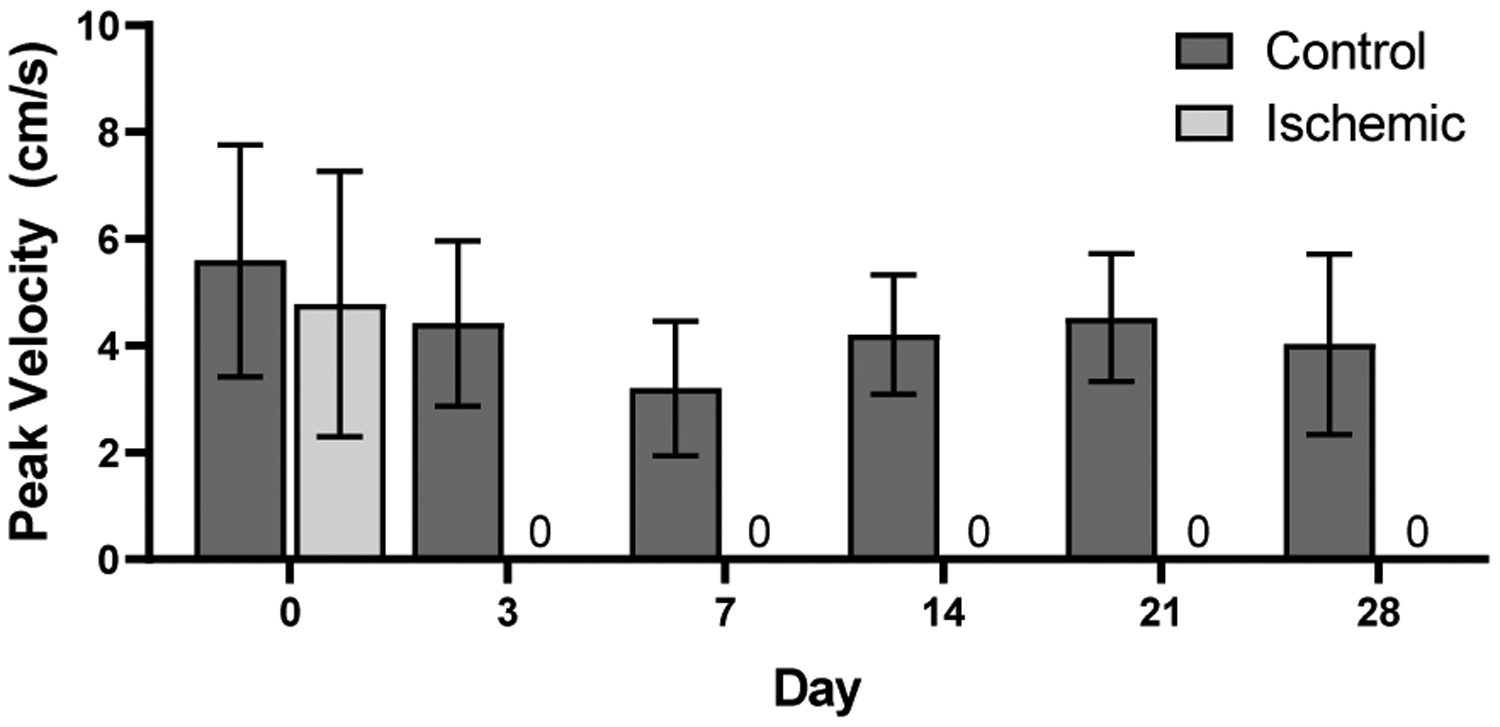
Average peak blood flow velocity of control vs. ischemic limbs acquired from pulsed-wave Doppler ultrasound of femoral arteries (n = 9) where no blood flow was observed at days 3, 7, 14, 21, and 28.
Fig. 10:
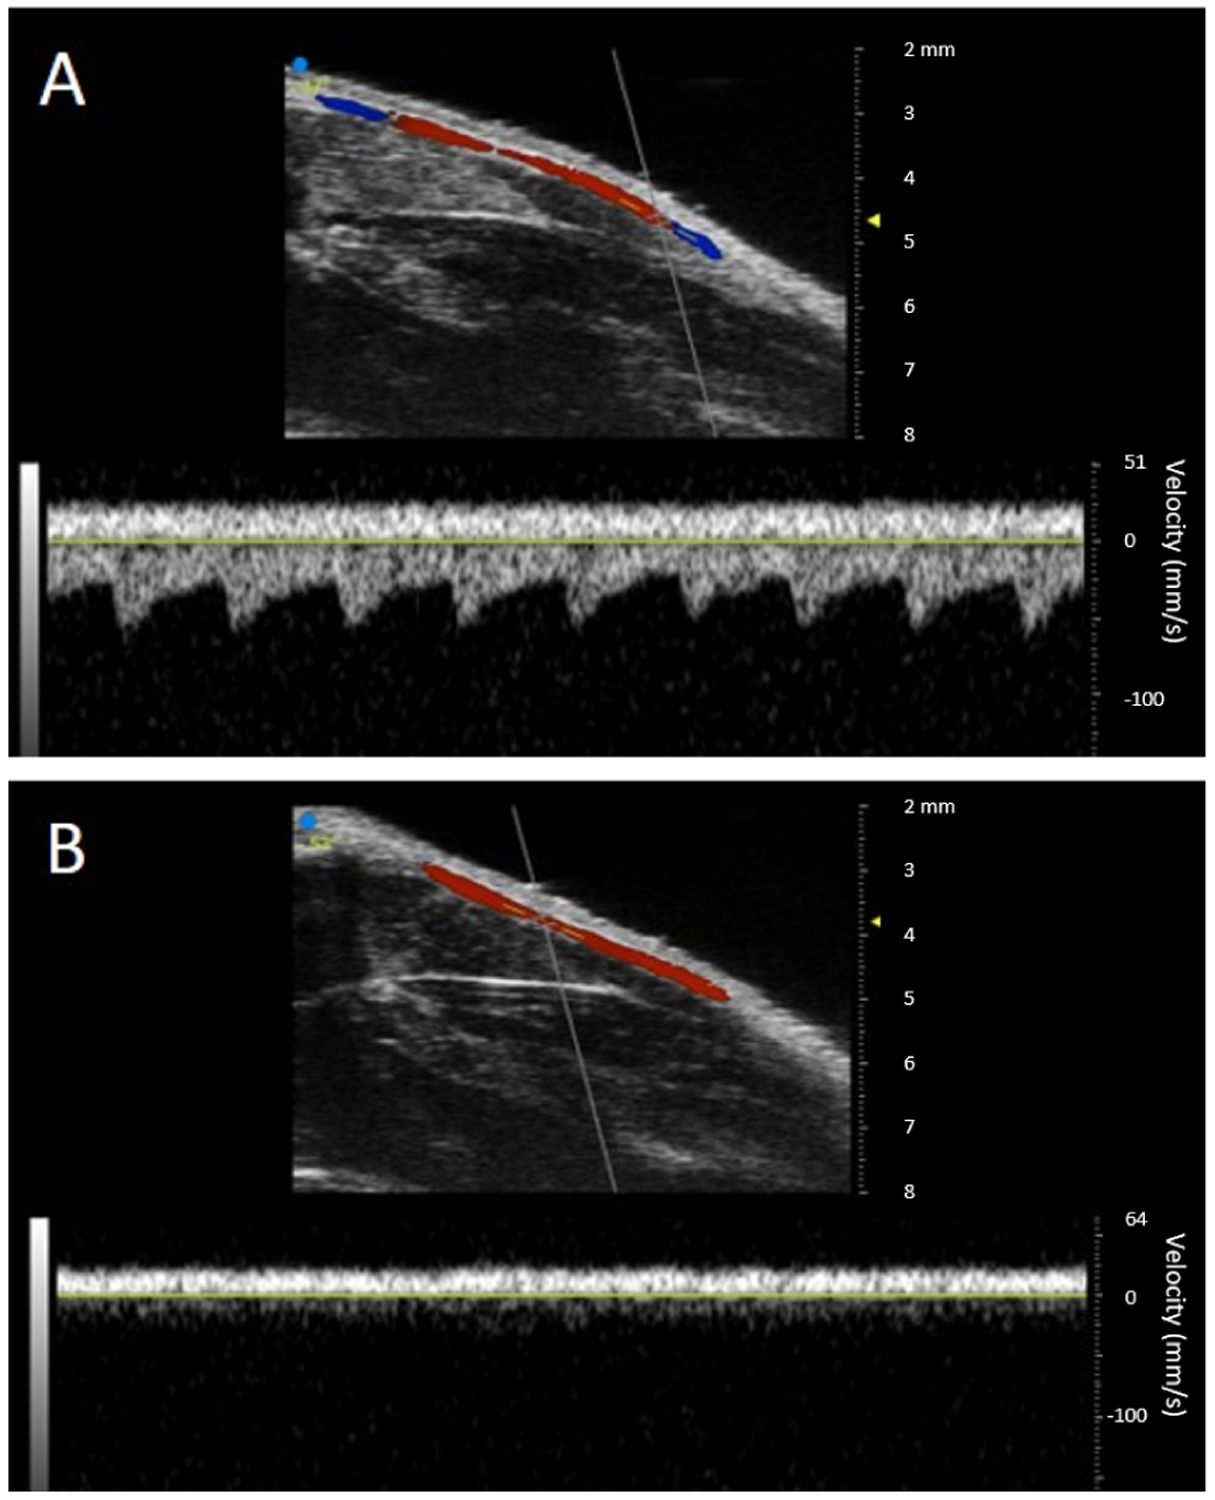
A-B) Ultrasound color and pulsed-wave Doppler images from one of n = 9 mice at day 14 post-ligation. Here, red indicates flow toward transducer and blue indicates flow away from transducer. A) Control limb showing normal blood flow in the femoral artery. B) Ischemic limb showing no blood flow in the femoral artery.
Histology Results
Differences in intimal shape, size, and thickness of the femoral arteries are revealed in the histological images of the ischemic and control limbs. Examining the femoral arteries of the ischemic limbs, we observed intimal thickening (Figure 4B), a potential indicator of intimal hyperplasia. Analyzing lumen area of the femoral arteries in both limbs, we conclude that the lumen area in the control limbs was also significantly greater than that in the ischemic limbs from mice in which the femoral arteries could be identified (n = 3) (Figure 12).
Fig. 12:
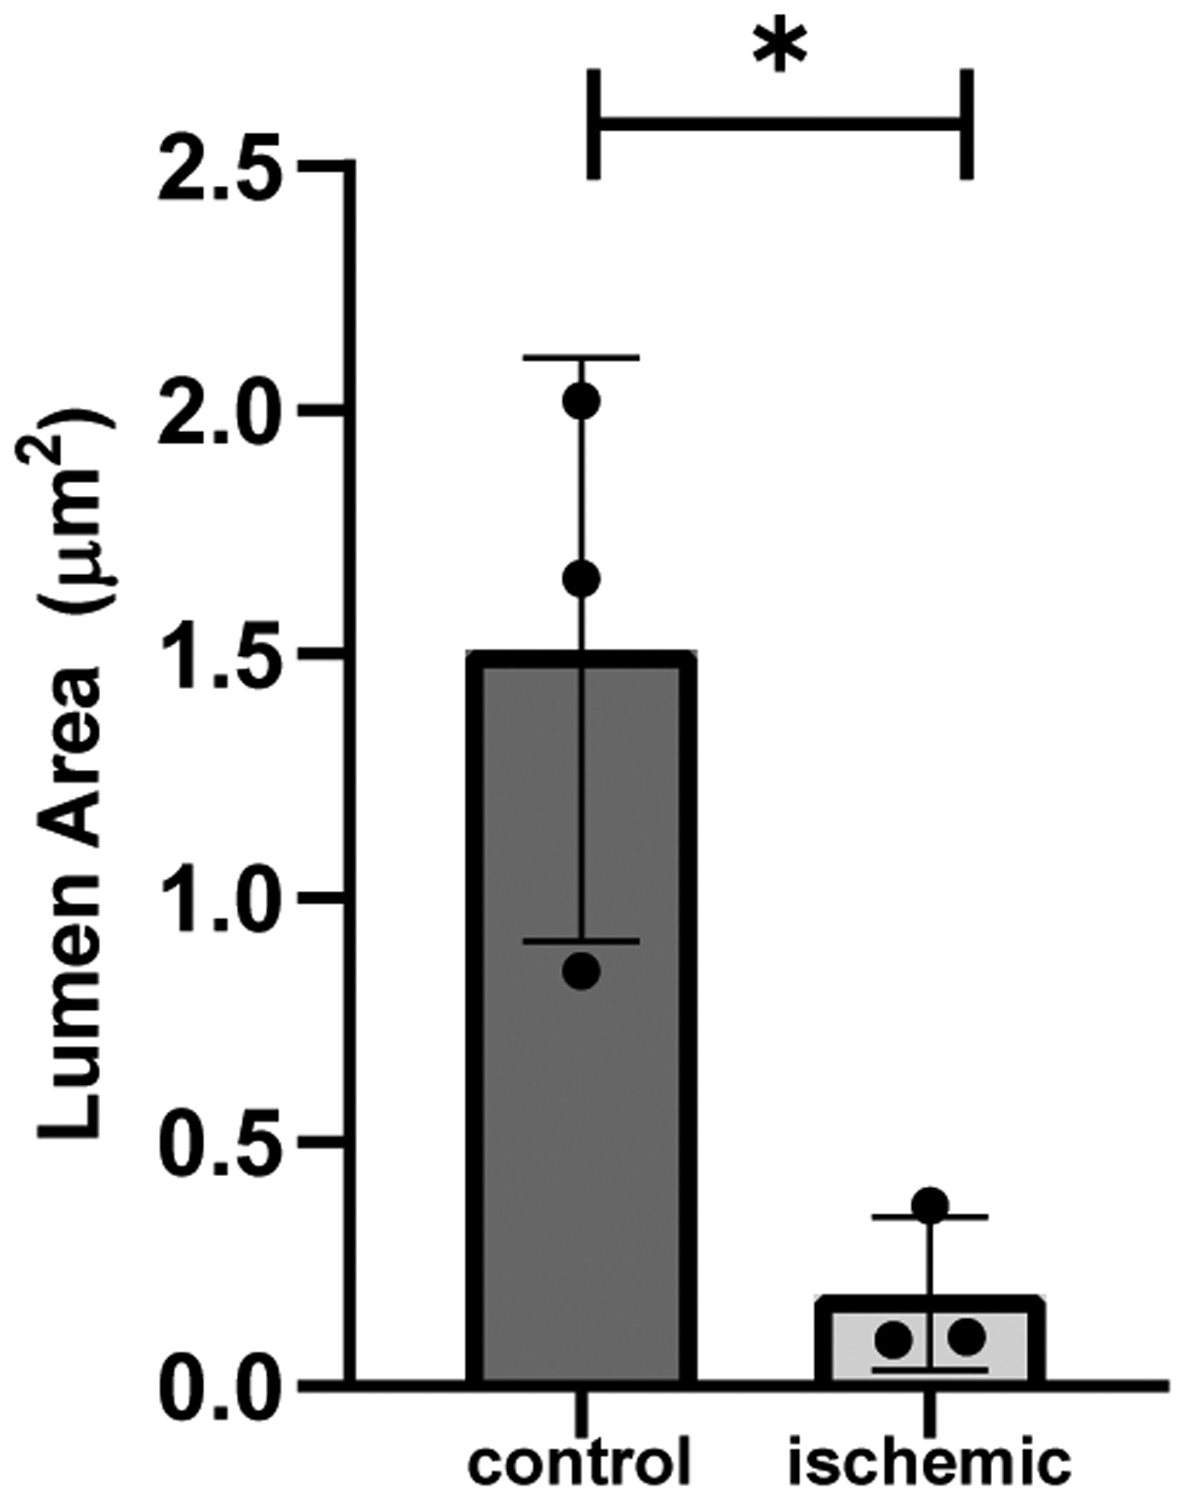
Lumen area mean of control vs. ischemic femoral arteries from n = 3 mice at day 28 (p<0.05).
DISCUSSION
The results of this study demonstrate how SFDI can be used to detect changes in tissue chromophore concentrations and noninvasively quantify hemodynamic parameters in a murine model of hindlimb ischemia longitudinally without requiring a contrast agent or invasive imaging procedure. Furthermore, the rapid drop in HbO, THb, and StO2 at day 1 and increase at day 3 suggests the ability of our SFDI approach to sensitively detect immediate changes in vascular perfusion for both post-ischemic injury and recovery. Thus another benefit of this approach is the ability to detect these changes as mice rapidly adapt to ischemic injury.
Current optical approaches to assess PAD are typically probe-based and do not rely on quantitative measures in which physiological properties can be mapped with submillimeter detail. A diffuse optics strategy utilizing SFDI, in which wide-field measurements are taken, can capture this detail on a pixel-wise basis to reveal underlying tissue characteristics relevant to preclinical and clinical applications [18]. Although we can obtain flow measurements from ultrasound, ultrasound alone is limited in the number of vessels that it can visualize. Therefore, we utilized a multi-modality approach where the perfusion metrics from SFDI can be compared to the arterial hemodynamic metrics of ultrasound in order to characterize changes at both the vessel and tissue level. Here we imaged the vascular beds downstream of the major arteries in the hindlimbs. Although we did not find a significant difference in HbO, Hb, and THb concentrations or ratios across all timepoints, we did observe a significant difference in StO2 ratio between baseline and day 1. The ischemic to control ratio for HbO, however, did decrease by approximately 19% at day 1 compared to baseline (p<0.15), comparable to a study by Scholz et al. in which HbO ischemic to control ratio dropped to 25% immediately after occlusion in a C57Bl/6 group of mice that underwent femoral artery ligation [30]. Furthermore, it is difficult to determine whether StO2 is altered by the supply of arterial blood flow, demand from oxygen consumption, or a combination of both, as StO2 depends on HbO and Hb. Blood flow, best represented by HbO, is a possible source for these changes in StO2. Since StO2 is normalized with respect to HbO and Hb, StO2 may also have a lower variance compared to other hemodynamic parameters which promotes its significant decrease within our heterogeneous data set.
It has also been shown that mouse strain has an impact on ischemic recovery time. Scholz et al. and Helisch et al., for example, found that the recovery rate from ischemic injury in C57Bl/6 mice was faster compared to Balb/C mice [30, 31] and, with the incorporation of Fibroblast Growth Factor 2 to accelerate arteriogenesis, had higher acute collateral flow by 7-fold [30]. Furthermore, the resiliency of mice in response to ischemic injury due to contributions from the microvasculature surrounding the femoral artery are demonstrated in this study, in which these contributions can influence the regulation and perfusion of blood within the ischemic limb. It was also found that tissue oxygen saturation recovered faster compared to flow regardless of mouse strain, which may explain the sudden return and steady maintenance of StO2 at day 3 and beyond [30]. To better understand the interplay between these factors, further studies which involve the use of various mouse strains as well as techniques that rely on a deep tissue sensing technique, such as diffuse correlation spectroscopy [32] that are selective to blood flow changes, will be needed.
Our calibration data with low variation compares well with previous approaches that used phantoms for calibration and can be compared to broadband absorption and reduced scattering coefficients acquired by diffuse optical spectroscopic imaging (DOSI) instrumentation [33]. The absorption and scattering properties of tissue with use of optical imaging may fluctuate due to factors that are difficult to control. Although we were able to evaluate changes in vascular function in a preclinical model throughout this study, there exists a few practical limitations which resulted in greater variability than what was expected within this dataset. Signal changes induced experimentally could have influenced optical scattering, absorption, and hemodynamic metrics irrespective of ROI positioning. Repeated application of depilatory cream on C57BL/6J mice with dark fur along with sutures are just a few examples of these in addition to physiological changes and traits like fur regrowth, scar tissue, and skin pigmentation on the animal hindlimbs. A nude mouse model to reduce issues with fur can be used to combat this issue. Hardware changes in the SFDI system can also be made using optics that can capture the size of ROI that would be needed in smaller animal studies with improved spatial resolution. For example, the SFDI system could be modified with a higher magnification lens in order to better sample the smaller ROI. Even with these limitations and need for future work, the results of this study demonstrate advantages that are suggestive of SFDI’s capabilities in detecting and monitoring vascular disease.
Overall, SFDI is a fast, easy to use imaging technique that can be used to acquire quantitative wide-field imaging that can reveal structural contrast in highly scattered media such as biological tissue [17, 34, 35]. It has been applied to study the effects of renal arterial occlusion in a porcine model that simulates renal ischemic reperfusion injury typically observed in partial nephrectomy procedures [36]. Other clinical studies show SFDI can be used to assess perfusion in the lower extremities of diabetic and nondiabetic patients [22], particularly in wound [37] and burn imaging [38] where SFDI can assess where a loss in tissue oxygenation may lead to poor circulation and thus poor healing, provoking the formation of ulcers that are common among patients with diabetes [37].
More interestingly, the methods presented in our work demonstrate a way in which to take measurements with such an SFDI system for evaluating peripheral ischemia in a preclinical model and how to account for the incongruities encountered throughout this study. The software techniques used to perform ROI selection as well as angle correction are valuable in acquiring data that can easily be quantified and compared longitudinally for applications extending beyond peripheral disease assessment.
CONCLUSION
Peripheral artery disease assessment and monitoring is challenging as a result of methods that are expensive, tedious, and unreliable. Moreover, the limitations provided by these current methods typically require invasive procedures to more accurately assess this condition. We implemented SFDI in this study to extract hemodynamic parameters noninvasively in a preclinical murine model of hindlimb ischemia to track tissue perfusion and oxygen saturation changes long-term as demonstrated by our results. Tissue oxygen saturation was the most sensitive to our SFDI approach from all four hemodynamic parameters measured. Given these results and other prior studies involving SFDI, we believe that our work contributes the following new knowledge: 1) We evaluate SFDI not as a diagnostic tool for PAD, but rather as a technique to study PAD progression and treatment longitudinally for an extended period of up to 4 weeks; 2) SFDI measurements are validated against independent assessments of vascularity and vascular function including histological analysis and ultrasound; and 3) We evaluate the use of SFDI to assess relatively small regions of interest in a small animal model compared to prior work. Together our findings suggest that SFDI could be a powerful tool to elucidate factors that may contribute to PAD progression. As a result, this work shall provide relevant information for further investigation into the development of novel therapeutics for PAD and a better understanding of the long-term effects of this disease when combined with other noninvasive imaging approaches.
ACKNOWLDEGMENTS
This research was supported by the Leslie A. Geddes Endowment at Purdue University. We also acknowledge Dr. Darren Roblyer from Boston University for promoting helpful discussions.
Grant sponsor: American Heart Association Scientist Development Grant to CJG; Grant number: 14SDG18220010; Grant sponsor: Purdue University Leslie A. Geddes Endowment.
REFERENCES
- 1.Fowkes FG, Rudan D, Rudan I, et al. Comparison of global estimates of prevalence and risk factors for peripheral artery disease in 2000 and 2010: a systematic review and analysis. Lancet. 2013;382(9901):1329–1340. [DOI] [PubMed] [Google Scholar]
- 2.Benjamin EJ, Muntner P, Alonso A, et al. Heart disease and stroke statistics—2019 update: a report from the American Heart Association. Circulation. 2019;139:e56–e528. [DOI] [PubMed] [Google Scholar]
- 3.Hirsch AT, Hartman L, Town RJ, Virnig BA. National health care costs of peripheral arterial disease in the Medicare population. Vascular Medicine. 2008;13:209–215. [DOI] [PubMed] [Google Scholar]
- 4.Nusair M, Dieter RS. Office evaluation of peripheral artery disease – history and physical examination strategies. Peripheral Artery Disease. 2017;2:37–53. [Google Scholar]
- 5.Harada M, Matsuzawa R, Aoyama N, et al. Asymptomatic peripheral artery disease and mortality in patients on hemodialysis. Renal Replacement Therapy. 2018;4:1–10. [Google Scholar]
- 6.Scully RE, Arnaoutakis DJ, DeBord Smith A, Semel M, Nguyen LL. Estimated annual health care expenditures in individuals with peripheral arterial disease. Journal of Vascular Surgery. 2018;67:558–567. [DOI] [PubMed] [Google Scholar]
- 7.Potier L, Abi Khalil C, Mohammedi K, Roussel R. Use and utility of ankle brachial index in patients with diabetes. European Journal of Vascular and Endovascular Surgery. 2011;41:110–116. [DOI] [PubMed] [Google Scholar]
- 8.Lin JB, Phillips EH, Riggins TE, et al. Imaging of small animal peripheral artery disease models: recent advancements and translational potential. International Journal of Molecular Sciences. 2015;16:11131–77. [DOI] [PMC free article] [PubMed] [Google Scholar]
- 9.Khalil MA, Kim HK, Kim I, et al. Dynamic diffuse optical tomography imaging of peripheral arterial disease. Biomedical Optics Express. 2012;3(9):2288–2298. [DOI] [PMC free article] [PubMed] [Google Scholar]
- 10.Pollak AW, Norton PT, Kramer CM. Multimodality imaging of lower extremity peripheral arterial disease: current role and future directions. Circulation: Cardiovascular Imaging. 2012;5:797–807. [DOI] [PMC free article] [PubMed] [Google Scholar]
- 11.Ota H, Takase K, Rikimaru H, et al. Quantitative vascular measurements in arterial occlusive disease. Radiographics. 2005;25:1141–1158. [DOI] [PubMed] [Google Scholar]
- 12.Norgren L, Hiatt WR, Dormandy JA, Nehler MR, Harris KA, Fowkes FGR. Inter-society consensus for the management of peripheral arterial disease (TASC II). Journal of Vascular Surgery. 2007;4(1):S5–S67. [DOI] [PubMed] [Google Scholar]
- 13.Murray AK, Herrick AL, King TA. Laser Doppler imaging: a developing technique for application in the rheumatic diseases. Rheumatology. 2004;43(10):1210–1218. [DOI] [PubMed] [Google Scholar]
- 14.Rajan V, Varghese B, van Leeuwen TG, Steenbergen W. Influence of tissue optical properties on laser Doppler perfusion imaging, accounting for photon penetration depth and the laser speckle phenomenon. Journal of Biomedical Optics. 2008;13(2):024001. [DOI] [PubMed] [Google Scholar]
- 15.Rajan V, Varghese B, van Leeuwen TG, Steenbergen W. Review of methodological developments in laser Doppler flowmetry. Lasers in Medical Science. 2009;24:269–283. [DOI] [PubMed] [Google Scholar]
- 16.Karlas A, Kallayer M, Fasoula N, et al. Multispectral optoacoustic tomography of muscle perfusion and oxygenation under arterial and venous occlusion: a human pilot study. Journal of Biophotonics. 2020:1–9. [DOI] [PubMed] [Google Scholar]
- 17.O’Sullivan TD, Cerussi AE, Cuccia DJ, Tromberg BJ. Diffuse optical imaging using spatially and temporally modulated light. Journal of Biomedical Optics. 2012;17:071311-1 –071311-14. [DOI] [PMC free article] [PubMed] [Google Scholar]
- 18.Hayakawa CK, Karrobi K, Pera V, Roblyer D, Venugopalan V. Optical sampling depth in the spatial frequency domain. Journal of Biomedical Optics. 2019;24:071603. [DOI] [PMC free article] [PubMed] [Google Scholar]
- 19.Yafi A, Vetter TS, Scholz T, et al. Postoperative quantitative assessment of reconstructive tissue status in a cutaneous flap model using spatial frequency domain imaging. Plastic and Reconstructive Surgery. 2011;127(1):117–130. [DOI] [PMC free article] [PubMed] [Google Scholar]
- 20.Pharaon MR, Scholz T, Bogdano S, et al. Early Detection of Complete Vascular Occlusion in a Pedicle Flap Model Using Quantitation Spectral Imaging. Plastic and Reconstructive Surgery. 2010;126(6):1924–1935. [DOI] [PMC free article] [PubMed] [Google Scholar]
- 21.Ponticorvo A, Taydas E, Mazhar A, et al. Quantitative assessment of partial vascular occlusions in a swine pedicle flap model using spatial frequency domain imaging. Biomedical Optics Express. 2013;4(2):298–306. [DOI] [PMC free article] [PubMed] [Google Scholar]
- 22.Weinkauf C, Mazhar A, Vaishnav K, Hamadani AA, Cuccia DJ, Armstrong DJ. Near-instant noninvasive optical imaging of tissue perfusion for vascular assessment. Journal of Vascular Surgery. 2019;69(2):555–562. [DOI] [PubMed] [Google Scholar]
- 23.Cuccia DJ, Bevilacqua F, Durkin AJ, Tromberg BJ. Modulated imaging: quantitative analysis and tomography of turbid media in the spatial-frequency domain. Optics Letters. 2005;30:1354–1356. [DOI] [PubMed] [Google Scholar]
- 24.Mazhar A, Dell S, Cuccia DJ, et al. Wavelength optimization for rapid chromophore mapping using spatial frequency domain imaging. Journal of Biomedical Optics. 2010;15:061716. [DOI] [PMC free article] [PubMed] [Google Scholar]
- 25.Miwa M, Ueda Y, Chance B. Development of time-resolved spectroscopy system for quantitative noninvasive tissue measurement. Proc. SPIE 2389. 1995;2389. [Google Scholar]
- 26.Zhao Y, Tabassum S, Piracha S, Nandhu MS, Viapiano M, Roblyer D. Angle correction for small animal tumor imaging with spatial frequency domain imaging (SFDI). Biomedical Optics Express. 2016;7:2373–2384. [DOI] [PMC free article] [PubMed] [Google Scholar]
- 27.Bryant C The blessings and curses of C57BL/6 substrains in mouse genetic studies. Annals of the New York Academy of Sciences. 2011;1245:31–33. [DOI] [PMC free article] [PubMed] [Google Scholar]
- 28.Niiyama H, Huang NF, Rollins MD, Cooke JP. Murine model of hindlimb ischemia. Journal of Visualized Experiments. 2009;23:e1035. [DOI] [PMC free article] [PubMed] [Google Scholar]
- 29.Schindelin J, Arganda-Carreras I, Frise E, et al. Fiji: an open-source platform for biological-image analysis. Nature Methods. 2012;9:676–682. [DOI] [PMC free article] [PubMed] [Google Scholar]
- 30.Scholz D, Ziegelhoeffer T, Helisch A, et al. Contribution of Arteriogenesis and Angiogenesis to Postocclusive Hindlimb Perfusion in Mice. Journal of Molecular and Cellular Cardiology. 2002;34:775–787. [DOI] [PubMed] [Google Scholar]
- 31.Helisch A, Wagner S, Khan N, et al. Impact of Mouse Strain Differences in Innate Hindlimb Collateral Vasculature. Arteriosclerosis, Thrombosis, and Vascular Biology. 2006;26:520–526. [DOI] [PubMed] [Google Scholar]
- 32.Mesquita RC, Durduran T, Yu G, et al. Direct measurement of tissue blood flow and metabolism with diffuse optics. Philosophical Transactions of the Royal Society A. 2011;369:4390–4406. [DOI] [PMC free article] [PubMed] [Google Scholar]
- 33.Leproux A, O’Sullivan TD, Cerussi A, et al. Performance assessment of diffuse optical spectroscopic imaging instruments in a 2-year multicenter breast cancer trial. Journal of Biomedical Optics. 2017;22(12):121604. [DOI] [PMC free article] [PubMed] [Google Scholar]
- 34.Nadeau KP, Durkin AJ, Tromberg BJ. Advanced demodulation technique for the extraction of tissue optical properties and structural orientation contrast in the spatial frequency domain. Journal of Biomedical Optics. 2014;19(5):056013. [DOI] [PMC free article] [PubMed] [Google Scholar]
- 35.Vervandier J, Gioux S. Single snapshot imaging of optical properties. Biomedical Optics Express. 2013;4(12):2938–2944. [DOI] [PMC free article] [PubMed] [Google Scholar]
- 36.Nadeau KP, Ponticorvo A, Lee HJ, Lu D, Durkin AJ, Tromberg BJ. Quantitative assessment of renal arterial occlusion in a porcine model using spatial frequency domain imaging. Optics Letters. 2013;38(18):3566–3569. [DOI] [PMC free article] [PubMed] [Google Scholar]
- 37.Saidian M, Lakey JRT, Ponticorvo A, et al. Characterization of impaired wound healing in a preclinical model of induced diabetes using wide-field imaging and conventional immunohistochemistry assays. International Wound Journal. 2019;16(1):144–152. [DOI] [PMC free article] [PubMed] [Google Scholar]
- 38.Ponticorvo A, Rowland R, Baldado M, et al. Evaluating clinical observation versus spatial frequency domain imaging (SFDI), laser speckle imaging (LSI) and thermal imaging for the assessment of burn depth. Burns. 2019;45(2):450–460. [DOI] [PMC free article] [PubMed] [Google Scholar]