Abstract
Background:
Chemotherapy in combination with thoracic radiotherapy yields significant results in patients with advanced non–small-cell lung cancer (NSCLC) compared with thoracic radiotherapy alone. However, whether concurrent or sequential delivery of chemotherapy combined with thoracic radiotherapy is optimal remains unclear. Herein, we conducted a systematic review and meta-analysis of randomized controlled trials (RCTs) to evaluate the efficacy and safety of concurrent vs sequential chemoradiotherapy in patients with NSCLC.
Methods:
PubMed, EmBase, and Cochrane Library were systematically searched for RCTs focusing on concurrent and sequential chemoradiotherapy for patients with NSCLC. The pooled-effect estimate was calculated using the random-effects model. Sensitivity, subgroup, and publication biases were also evaluated. A total of 14 RCTs (2634 patients with NSCLC) were selected for the final meta-analysis.
Results:
Compared with sequential chemoradiotherapy, concurrent chemoradiotherapy did not increase the 1-year survival rates; however, concurrent chemoradiotherapy significantly increased the 2-, 3-, 4-, and 5-year survival rates. Moreover, although there were no significant differences between concurrent and sequential chemoradiotherapy in terms of distant relapse and locoregional plus distant relapse, concurrent chemoradiotherapy significantly reduced the risk of locoregional relapse. Furthermore, concurrent chemoradiotherapy yielded positive results with respect to overall response rates. Unfortunately, concurrent chemoradiotherapy could result in esophagitis, nausea/vomiting, and reduced leukocyte and platelet counts in patients with NSCLC.
Conclusion:
Compared with sequential chemoradiotherapy, concurrent chemoradiotherapy may be significantly beneficial in terms of long-term survival and locoregional relapse, although it increases the risk of grade 3 (or greater) adverse events.
Keywords: carcinoma, chemoradiotherapy, lung neoplasms, meta-analysis, non–small-cell lung, randomized controlled trial
1. Introduction
Lung cancer is a common malignancy that is associated with high mortality rates. Approximately 75% to 85% of patients with lung cancer are diagnosed with non–small-cell lung cancer (NSCLC), including squamous carcinoma, adenocarcinoma, and large-cell carcinoma.[1] Currently, early- and middle-stage NSCLC are treated with surgical resection, and the postoperative 5-year survival rate is reportedly 77% for stage Ia NSCLC and 23% for stage IIIa NSCLC.[2] Indeed, local recurrence and distant metastasis are important factors with respect to NSCLC prognosis. Currently, ∼1/3rd of patients with lung cancer are diagnosed with stage III locally advanced NSCLC.[3] The combination of chemotherapy and radiotherapy is the standard of care for locally advanced and inoperable NSCLC.[4] Unfortunately, local- and distant relapse rates remain high, and, accordingly, additional treatment strategies are required in order to improve NSCLC prognosis.
Combined modality strategies involving concurrent and sequential chemoradiotherapy have been proven successful in previous studies.[5–8] Indeed, concurrent chemoradiotherapy for advanced NSCLC yields significant benefits with respect to survival rates; however, it increases the risk of hematologic and nonhematologic toxicity.[5–8] Although concurrent and sequential chemoradiotherapy are widely used, inconsistent results have been reported to date with respect to treatment effectiveness. In this study, we conducted a systematic review and meta-analysis of randomized controlled trials (RCTs) to evaluate the efficacy and safety of concurrent vs sequential chemoradiotherapy for advanced NSCLC. Moreover, stratified analysis was conducted to determine the treatment effectiveness of concurrent and sequential chemoradiotherapy.
2. Methods
2.1. Data sources, search strategy, and selection criteria
This meta-analysis was conducted according to the Preferred Reporting Items for Systematic Reviews and Meta-Analysis (PRISMA) Statement issued in 2009.[9] RCTs that examined the efficacy and safety of concurrent vs sequential chemoradiotherapy in patients with advanced NSCLC were included in this meta-analysis; no restrictions were placed on the published status and language if the article. We systematically searched three electronic databases—PubMed, EmBase, and Cochrane Library—for eligible studies using the following search terms: (“Carcinoma, Non-Small-Cell-Lung” [MeSH] or “Non-Small-Cell Lung Cancer” [All fields] or “Non-Small-Cell Lung Neoplasm” [All fields] or “NSCLC” [All fields]) AND (“Combined Modality Therapy” [MeSH] or “Chemo-Radiotherapy” [All fields] or (“Chemotherapy” [All fields] and “Radiotherapy” [All fields])) AND “randomized controlled trials.” Moreover, the US National Library of Medicine's clinical-trial database and the metaRegister of Controlled Trials were used to search for ongoing trials that have been completed but not published. The reference lists of retrieved studies were also manually reviewed to identify any new eligible RCTs.
Two authors independently conducted the literature search and study selection processes. Any disagreements were settled by reviewing and discussing the original article. If any disagreements remained thereafter, an additional author was employed to make the final decision. Previous studies were included if they met the following inclusion criteria:
-
1.
study design: RCT;
-
2.
patients: those with NSCLC;
-
3.
intervention: concurrent chemoradiotherapy;
-
4.
control: sequential chemoradiotherapy;
-
5.
outcomes: 1-, 2-, 3-, 4-, and 5-year survival rates as well as locoregional relapse, distant relapse, locoregional plus distant relapse, overall response rates, and grade 3 (or greater) adverse events. Ethical approval is not applicable in this manuscript.
2.2. Data collection and quality assessment
The following information was collected from the selected trials: first author's surname, publication year, country, inclusion period, sample size, age, male proportion, performance status, weight loss, NSCLC stage, histology, previous treatment, intervention, control, follow-up, and investigated outcomes. The Jadad scale was employed to evaluate the quality of the included studies according to randomization, blinding, allocation concealment, withdrawals, dropouts, and the use of intention-to-treat analysis.[10] The Jadad scale ranges from 0 to 5, with 5 representing optimal quality. Again, two authors independently conducted the data collection and quality assessment, with a third author introduced to settle any disagreements.
2.3. Statistical analysis
The efficacy and safety of concurrent vs sequential chemoradiotherapy for patients with NSCLC were both assigned as data categories; moreover, relative risks (RRs) with 95% confidence intervals (CIs) were used to calculate the pooled-effect estimates for each trial. Pooled analyses were conducted using the random-effects model.[11,12]I-square and Q statistics were used in the heterogeneity tests, with I-square >50% or P < .10 being regarded as significant heterogeneity.[13,14] Sensitivity analyses were conducted to assess the robustness of the pooled results.[15] Subgroup analyses for efficacy outcomes were conducted based on male proportion, performance status, weight loss, NSCLC stage, and study quality, and the differences between the subgroups were identified by calculating the P-value of each outcome using t test.[16] Publication biases for efficacy outcomes were calculated using funnel plots and the test results of Egger and Begg.[17,18] The P-value for all pooled outcomes was two-sided; P < .05 was considered statistically significant. All statistical analyses were conducted using STATA software (Version 10.0; StataCorp, Texas).
3. Results
3.1. Literature search
Figure 1 presents the literature search and study selection process. Overall, we yielded 2469 studies from the databases, and 646 of these studies were excluded due to duplicate topics. An additional 1769 studies were excluded due to irrelevant topics, and the remaining 54 studies were retrieved for further full-text evaluation. Thereafter, 40 studies were excluded due to the following reasons: studies investigated other intervention methods (n = 16), no appropriate control (n = 15), and review or meta-analysis (n = 9). The remaining 14 RCTs were selected for the meta-analysis.[19–32] Unfortunately, a manual search of the reference lists of the selected 14 RCTs did not yield any new articles.
Figure 1.
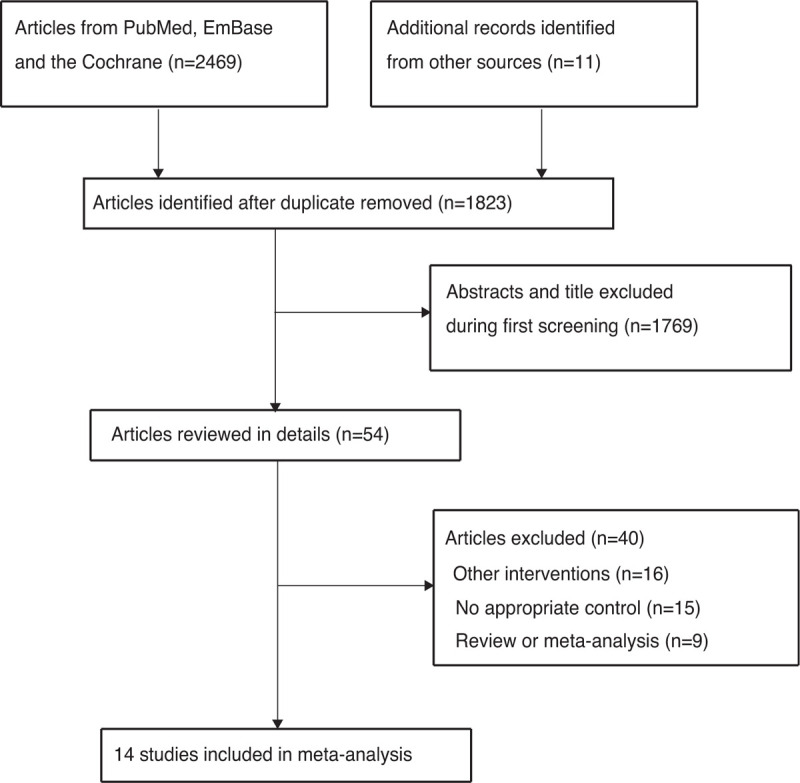
PRISMA Statement flowchart regarding the study selection process.
3.2. Study characteristics
Table 1 summarizes the baseline characteristics of the identified studies and patients. A total of 2634 patients with NSCLC from 14 RCTs were retrieved for analysis. The follow-up duration ranged from 1.3 to 11 years, and 30 to 400 patients were included in each trial. The mean age of the enrolled patients was 56.5–63.5 years, and the male proportion was 30.8% to 96.2%. Overall, 11 RCTs included patients with stage III NSCLC, whereas the remaining 3 studies included both early- and advanced-stage NSCLC. The quality of the included studies was evaluated using the Jadad scale: 7 studies scored 4, 5 studies scored 3, and the remaining 2 scored 2.
Table 1.
The summary characteristics of included studies and participants.
| Study | Country | Inclusion period | Sample size | Age (years) | Male (%) | Performance status | Weight loss | Stage | Histology | Previous treatment | Intervention | Control | Follow-up duration | Study quality |
| Furuse 1999 [19] | Japan | 1992–1998 | 314 | 63.5 | 85.7 | ECOG 0–2 | <10.0% | IIIa, IIIb | SC: 148; Ad: 134; LC: 30; other: 2 | No CT, TRT, and TS | 2 cycles, P 80 mg/m2, d1,29+Vi 3 mg/m2, d1, 8,29,36+M 8 mg/m2, d1, 29; q4wks; 56 Gy/2 Gy/fr (5 fr/wk) began at d2 repeated after 10 ds rest | 2 cycles, P 80 mg/m2, d1,29 + Vi 3 mg/m2, d1,8,29,36 +M 8 mg/m2, d1, 29; q4wks; 56 Gy/2 Gy/fr (5 fr/wk) | 5.0 years | 4 |
| Clamon 1999 [20] | USA | 1991–1997 | 250 | 63.0 | 69.2 | ECOG 0–1 | <5.0% | IIIa, IIIb | NA | No CT and TRT | C 100 mg/m2/wk over 6 wks; induced by (P 100 mg/m2, d1,29 + Vin 5 mg/m2 d1,8,15,22,29); 60 Gy/2 Gy/fr (30 frs in 6wks) | P 100 mg/m2, d1,29 + Vin 5 mg/m2 d1,8,15,22,29; 60 Gy/2 Gy/fr (30 frs in 6 wks) | 3.4 years | 3 |
| Ulutin 2000 [21] | Turkey | 1995–1996 | 30 | 18.0–75.0 | NA | ECOG 0–2 | <10.0% | IIIa, IIIb | NA | No CT, TRT, and TS | P 6 mg/m2/d; 60 Gy (split-course) | 2 cycles, P 40 mg/m2 + (E + I) 200 mg/m2 d1,3,5; q4 wk; 60 Gy (split-course) | 1.3 years | 2 |
| Curran 2003 [22] | USA | 1996–2002 | 400 | >18.0 | NA | KPS>70 | < 5.0% | II∗, IIIa, IIIb | NA | No CT and TRT | P 100 mg/m2, d1,29 + Vin 5 mg/m2/wk∗5; 60 Gy/2 Gy/d began on d1 | P 100 mg/m2, d1,29 + Vin 5 mg/m2/wk∗5; 60 Gy/2 Gy/d began on d50 | 6.0 years | 4 |
| Zatloukal 2004 [23] | Czech | 1997–2001 | 102 | 61.5 | 67.6 | WHO/ECOG 0–2 | NA | IIIa, IIIb | SC: 46; Ad: 27; LC: 7; other: 22 | No CT and TRT | 4 cycles, P 80 mg/m2, d1 + V 25 mg/m2, for 1nd,4nd cycles (12.5 mg/m2 for 2nd/3nd cycles) d1,8,15; q4wks; 60 Gy/2 Gy/fr (30 frs in 6 wk) started at day 4 of cycle 2 | 4 cycles, P 80 mg/m2, d1 + V 25 mg/m2, for 1nd,4nd cycles (12.5 mg/m2 for 2nd/3nd cycles) d1,8,15; q4wks; 60 Gy/2 Gy/fr (30 frs in 6 wk) started within 5th-6th wk | 3.3 years | 3 |
| Fournel 2005 [24] | French | 1996–2000 | 201 | 56.5 | 87.6 | ECOG 0–1 | < 10.0% | IIIa-N2,IIIb | SC: 116; Ad: 53; LC: 32 | Untreated | 2 cycles, P 20 mg/m2/d + E 50 mg/m2/d (d1–5,29–33); consolidated by (P 80 mg/m2, d78,106 + V 30 mg/m2/ wk d78–127); 66 Gy/2 Gy/fr (5 fr/wk) started at d1 | 3 cycles, P 120 mg/m2, d1,29,57 + V 30mg/m2/wk, d1–78; q4wks; 66 Gy/2 Gy/fr (5 fr/wk) | 4.8 years | 4 |
| Belani 2005[25] | USA | 1998–2004 | 183 | >18.0 | 68.3 | KPS>70 | < 10.0% | IIIa, IIIb | SC: 75; Ad: 64; LC: 18; mixed: 3; unknown: 20; other: 3 | No CT, TRT, and TS | T 45 mg/m2/wk (1-hr) + C AUC = 2; consolidated by (2 cycles, T 200mg/m2 + C AUC = 6; q3wks); 63 Gy/1.85 Gy/fr (34 frs in 7 wks) | 2 cycles,T 200 mg/m2 + C AUC = 6; q3wks; 63 Gy/1.85 Gy/fr (34 frs in 7 wks) | 3.3 years | 4 |
| Dasgupta 2006 [26] | India | 2001–2005 | 71 | 57.0 | NA | KPS>60 | NA | IIIa, IIIb | SC: 40; Ad: 23; LC: 6; other: 2 | Untreated | (P 20 mg/m2 + E 75 mg/m2) d1–5,22–26; consolidated by -2 cycles of same CT, q3 wks; 50 Gy/2 Gy/fr | 3cycles, P 80 mg/m2, d1+ E 100 mg/m2, d1–3;q3 wks; 60 Gy/2 Gy/fr | 2.0 years | 3 |
| Scagliotti 2006 [27] | Europe | 1999–2004 | 108 | 59.0 | 78.0 | WHO 0–1 | < 5.0% | IIIa, IIIb | SC: 47; Ad: 36; LC: 7; other: 18 | Untreated | D 20 mg/m2/wk, q6 wks; induced by (2 cycles, D 85 mg/m2, d1 + P 40 mg/m2, d1,2; q3wks); 60 Gy/2 Gy/fr (5 fr/wk) | 2 cycles, D 85 mg/m2, d1 t P 40 mg/m2, d1,2; q3wks; 60 Gy/2 Gy/fr (5 fr/wk) began at d43 | 1.3 years | 4 |
| Huber 2006 [28] | Germany | 1997–2004 | 212 | 61.5 | 84.9 | KPS>70 | NA | IIIa, IIIb | SC: 130; Ad: 41; LC: 16; mixed: 7; not classified: 18 | No CT and TRT | T 60 mg/m2/wk(1-hr) for 6 wks, up to 6 hours before RT; induced by (2 cycles, T 200 mg/m2 + C AUC = 6;q3wks); 60–66 Gy (mediastinum/primary:50 Gy, macroscopic:10–16 Gy) | 2 cycles, T 200 mg/m2 + C AUC = 6; q3wks; 60–66 Gy (mediastinum/ primary:50 Gy, macroscopic:10–16 Gy) | 3.2 years | 4 |
| Belderbos 2007 [29] | UK | 1999-2005 | 158 | 63.0 | 96.2 | WHO 0–1 | < 10.0% | I∗,II∗, IIIa, IIIb | SC: 63; Ad: 44; not classified: 42; mixed: 1; other: 8 | NA | P 6 mg/m2/d; 66 Gy/2.75 Gy/fr (24 frs in 32 days) | 2 cycles, P 75 mg/m2, d2 + G 1250 mg/m2, d1, 8; 66 Gy/2.75 Gy/fr (24 frs in 32 days) | 3.3 years | 3 |
| Crvenkova 2009 [30] | Macedonia | 2005–2008 | 85 | 58.1 | 88.2 | ECOG 0–1 | < 10.0% | I∗,II∗, IIIa, IIIb | SC: 56; Ad: 16; LC: 5; not classified: 8 | Untreated | C (AUC × 6) on d1 and E on d1–3, repeated every 3 wks; 60 Gy in 30 frs of 2 Gy/fr for 5 days | C (AUC × 6) on d1 and E on d1–3, repeated every 3 wks; 60 Gy in 30 frs of 2 Gy/fr for 5 days | 1.4 years | 2 |
| Curran 2011 [31] | USA | 1994–1998 | 390 | 61.5 | 63.5 | KPS>70 | < 5.0% | IIIa, IIIb | SC: 150; Ad: 126; LC: 56; mixed: 4; not classified: 52; other: 2 | No CT, TRT, and TS | C at 100 mg/m2 on d1 and d29 V at 5 mg/m2 per week for 5 wks with 60 Gy TRT beginning on day 50 | C at 100 mg/m2 on d1 and d29 V at 5 mg/m2 per week for 5 wks with 60 Gy TRT once daily beginning on day 1 | 11.0 years | 4 |
| Maguire 2014 [32] | UK | 2005–2010 | 130 | 61.9 | 30.8 | ECOG 0–1 | NA | IIIa, IIIb | SC: 83; Ad: 35; other: 12 | No CT, TRT, and TS | C 20 mg/m2 1–4 and 16–19. V was reduced to 15 mg/m2, and given prior to frs 1, 6, 15 and 20. A further 1 or 2 cycles of C (80 mg/m2 day 1) and V (25 mg/m2 day 1 and 8) were given 4–6 wks; 55 Gy in 2.75 Gy/fr for 4 wks | C 80 mg/m2 IV on day 1 and V 25 mg/m2 IV on day 1 and 8 (q 21) for 3–4 cycles; 55 Gy in 2.75 Gy/fr for 4 wks | 3.0 years | 3 |
Ad = adenocarcinoma, AUC = area under the time concentration curve, C = carboplatin, CT = chemotherapy, d = day, D = docetaxel, E = etoposide, fr = fraction, G = gemcitabine, hr = hour, I = ifosfamide, LC = large cell, M = mitomycin, P = cisplatin, q = every, RT = radiotherapy, SC = squamous cell, T = paclitaxel, TRT = thoracic radiotherapy, TS = thoracic surgery, V = vinorelbine, Vi = vindesine, Vin = vinblastine , wk = week.
3.3. One-year survival rate
Data on 1-year survival rates to evaluate the effect of concurrent vs sequential chemoradiotherapy were available in 10 trials, which included 1724 patients with NSCLC with 1006 survival cases. The summary results did not identify any significant differences between concurrent and sequential chemoradiotherapy for one-year survival rates (RR: 1.04; 95% CI: 0.94–1.15; P = .491; Fig. 2); moreover, potential significant heterogeneity existed across the included trials (I-square: 38.9%; P = .098). Sensitivity analysis indicated that the results were stable; they did not change after excluding individual trials (Supplemental Digital Content 1).
Figure 2.
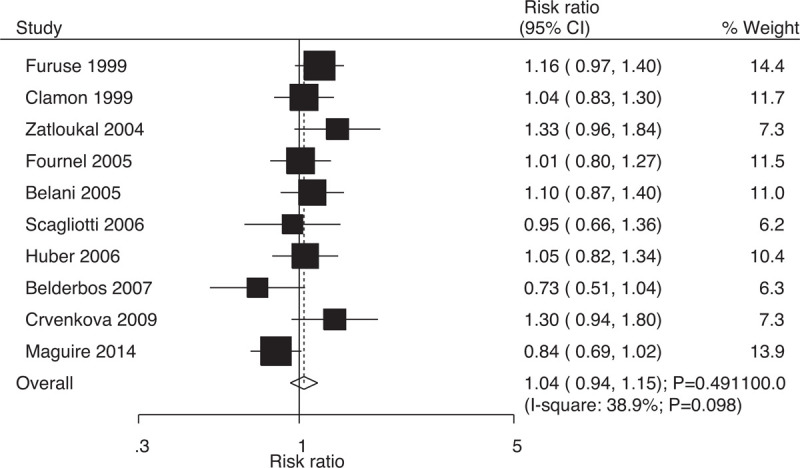
Effect of concurrent vs sequential chemoradiotherapy on 1-year survival rates.
3.4. Two-year survival rate
Data on 2-year survival rates to evaluate the effect of concurrent vs sequential chemoradiotherapy were was available in 10 trials, which included 1697 patients with NSCLC with 541 survival cases. Compared with sequential chemoradiotherapy, concurrent chemoradiotherapy yielded significant benefits with respect to 2-year survival rates (RR: 1.25; 95% CI: 1.07–1.47; P = .004; Fig. 3); moreover, insignificant heterogeneity was evident among the included trials (I-square: 21.9%; P = .242). Sensitivity analysis indicated that the results were stable; they did not change after excluding individual trials (Supplemental Digital Content 1).
Figure 3.
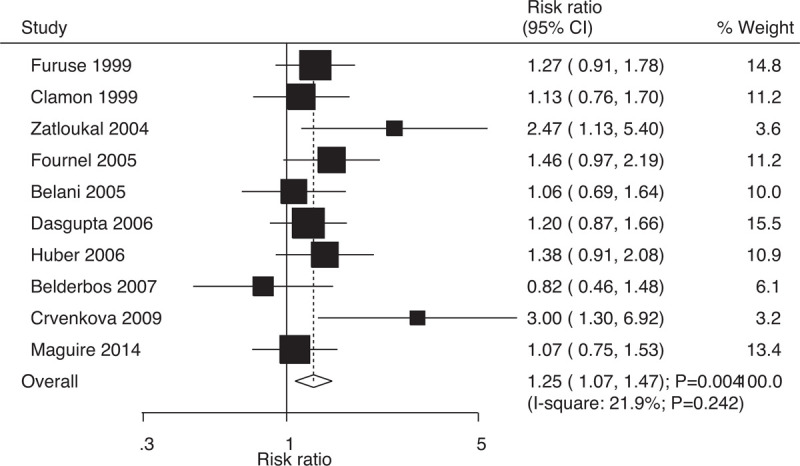
Effect of concurrent vs sequential chemoradiotherapy on 2-year survival rates.
3.5. Three-year survival rate
Data on 3-year survival rates to evaluate the effect of concurrent vs sequential chemoradiotherapy were available in 7 trials, which included 1420 patients with NSCLC with 252 survival cases. Indeed, compared with sequential chemoradiotherapy, concurrent chemoradiotherapy significantly increased the 3-year survival rates (RR: 1.28; 95% CI: 1.02–1.60; P = .035; Fig. 4); moreover, there was no evidence of heterogeneity among the included trials (I-square: 0.0%; P = .545). Sensitivity analysis indicated that the results were not stable and changed after excluding individual trials due to the marginal 95% CI (Supplemental Digital Content 1).
Figure 4.
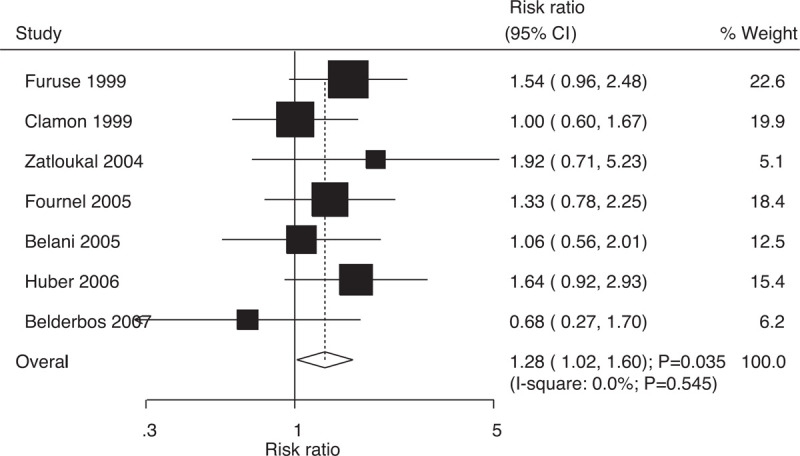
Effect of concurrent vs sequential chemoradiotherapy on 3-year survival rates.
3.6. Four-year survival rate
Data on 4-year survival rates to evaluate the effect of concurrent vs sequential chemoradiotherapy were available in 5 trials, which included 1377 patients with NSCLC with 194 survival cases. The pooled RRs indicated that compared with sequential chemoradiotherapy, concurrent chemoradiotherapy significantly increased the 4-year survival rates (RR: 1.56; 95% CI: 1.20–2.04; P = .001; Fig. 5); moreover, there was no evidence of heterogeneity across the included trials (I-square: 0.0%; P = .960). Sensitivity analysis suggested that the results were robust; they did not alter after excluding specific trials (Supplemental Digital Content 1).
Figure 5.
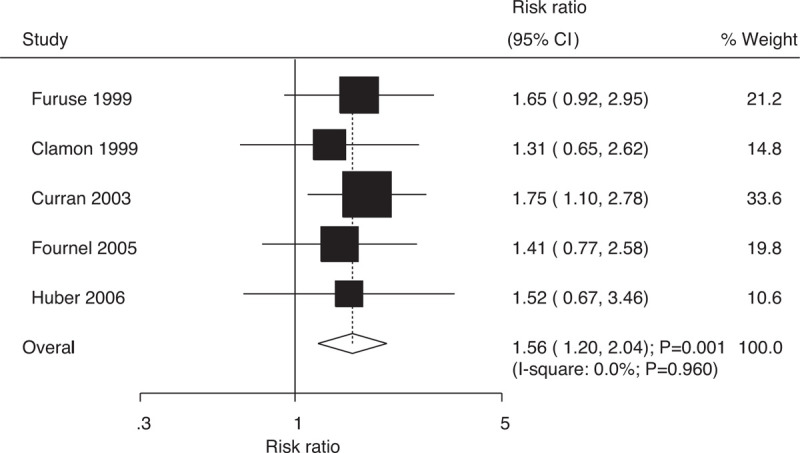
Effect of concurrent vs sequential chemoradiotherapy on 4-year survival rates.
3.7. Five-year survival rate
Data on 5-year survival rates to evaluate the effect of concurrent vs sequential chemoradiotherapy were available in 5 trials, which included 1367 patients with NSCLC with 149 survival cases. Indeed, compared with sequential chemoradiotherapy, concurrent chemoradiotherapy significantly increased the 5-year survival rates (RR: 1.49; 95% CI: 1.09–2.04; P = .012; Fig. 6); moreover, there was no evidence of heterogeneity among the included trials (I-square: 0.0%; P = .550). Sensitivity analysis indicated that the results were not stable and changed after excluding individual trials due to two reasons: marginal 95% CI and a small number of included trials (Supplemental Digital Content 1).
Figure 6.
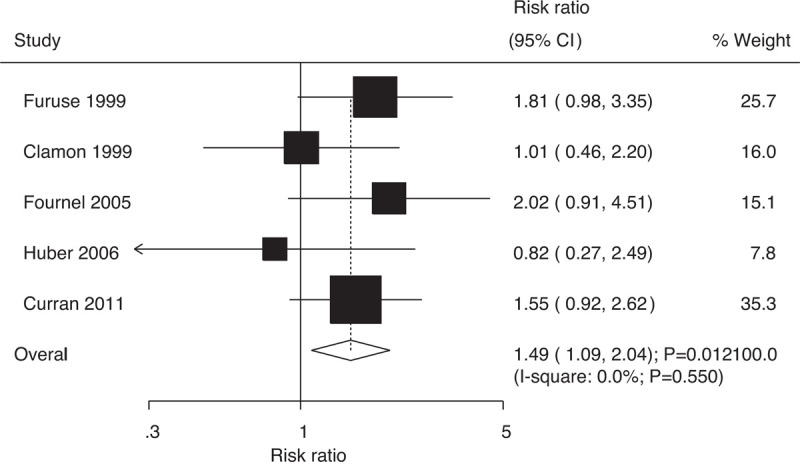
Effect of concurrent vs sequential chemoradiotherapy on 5-year survival rates.
3.8. Locoregional relapse
Data on the risk of locoregional relapse to evaluate the effect of concurrent vs sequential chemoradiotherapy were available in 8 trials, which included 1589 patients with NSCLC with 539 events of locoregional relapse. Overall, compared with sequential chemoradiotherapy, concurrent chemoradiotherapy significantly reduced the risk of locoregional relapse (RR: 0.80; 95% CI: 0.70–0.92; P = .001; Fig. 7); moreover, there was no evidence of heterogeneity (I-square: 0.0%; P = .538). The results were stable and did not change after excluding individual trials (Supplemental Digital Content 1).
Figure 7.
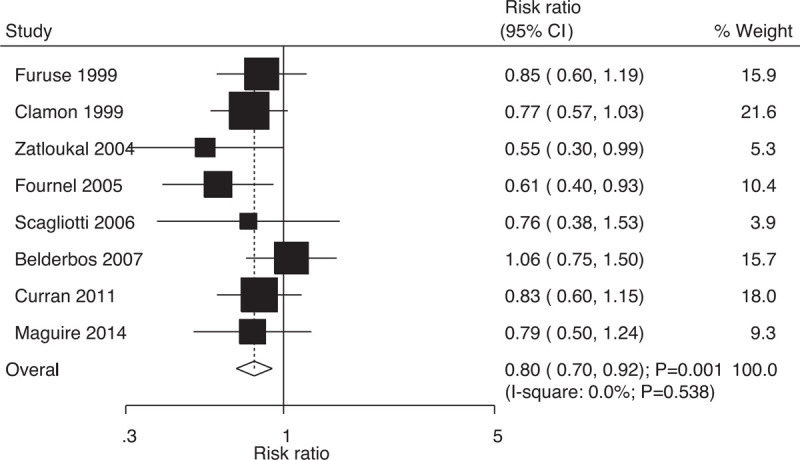
Effect of concurrent vs sequential chemoradiotherapy on the risk of locoregional relapse.
3.9. Distant relapse
Data on the risk of distant relapse to evaluate the effect of concurrent vs sequential chemoradiotherapy were available in 9 trials, which included 1660 patients with NSCLC with 561 events of distant relapse. No significant differences were found between concurrent and sequential chemoradiotherapy (RR: 1.02; 95% CI: 0.89–1.16; P = .811; Fig. 8); moreover, there was no evidence of heterogeneity across the included trials (I-square: 0.0%; P = .646). Sensitivity analysis indicated that the results were stable and did not change after excluding individual trials (Supplemental Digital Content 1).
Figure 8.
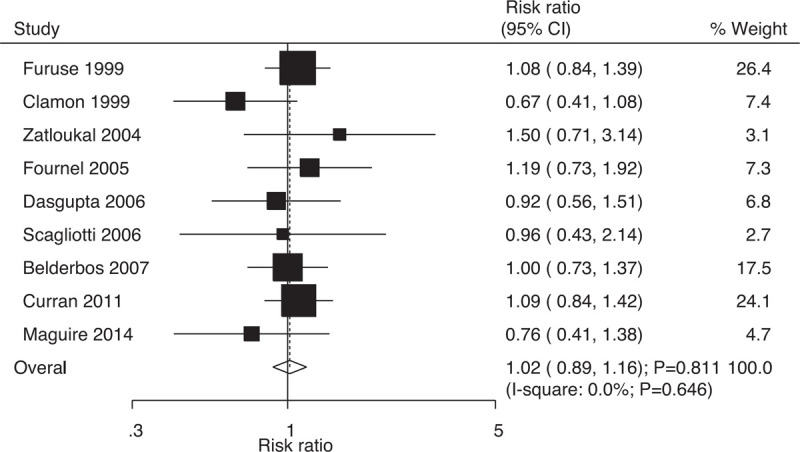
Effect of concurrent vs sequential chemoradiotherapy on the risk of distant relapse.
3.10. Locoregional plus distant relapse
Data on the risk of locoregional plus distant relapse to evaluate the effect of concurrent vs sequential chemoradiotherapy were available in 6 trials, which included 1301 patients with NSCLC with 102 events of locoregional plus distant relapse. No significant differences were found between concurrent and sequential chemoradiotherapy (RR: 0.83; 95% CI: 0.57–1.20; P = .316; Fig. 9); moreover, there was no evidence of heterogeneity across the included trials (I-square: 0.0%; P = .936). Sensitivity analysis indicated that the results were robust and did not change after excluding individual trials (Supplemental Digital Content 1).
Figure 9.
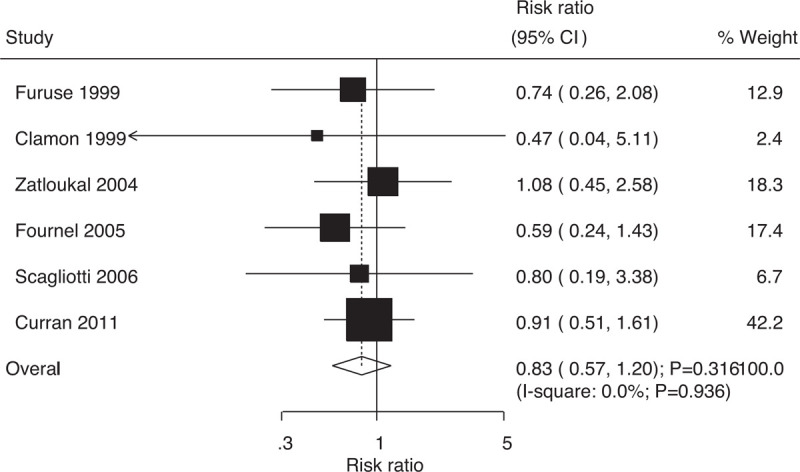
Effect of concurrent vs sequential chemoradiotherapy on the risk of locoregional plus distant relapse.
3.11. Overall response rate
Data on overall response rates to evaluate the effect of concurrent vs sequential chemoradiotherapy were available in 11 trials, which included 1872 patients with NSCLC with 1154 events of overall response. The RRs indicated that compared with sequential chemoradiotherapy, concurrent chemoradiotherapy significantly increased the overall response rates (RR: 1.13; 95% CI: 1.02–1.25; P = .016; Fig. 10); moreover, potential significant heterogeneity was identified among the included trials (I-square: 40.8%; P = .077). Sensitivity analysis indicated that the results were not stable and changed after individual trials were excluded. This was due to the marginal 95% CI (Supplemental Digital Content 1).
Figure 10.
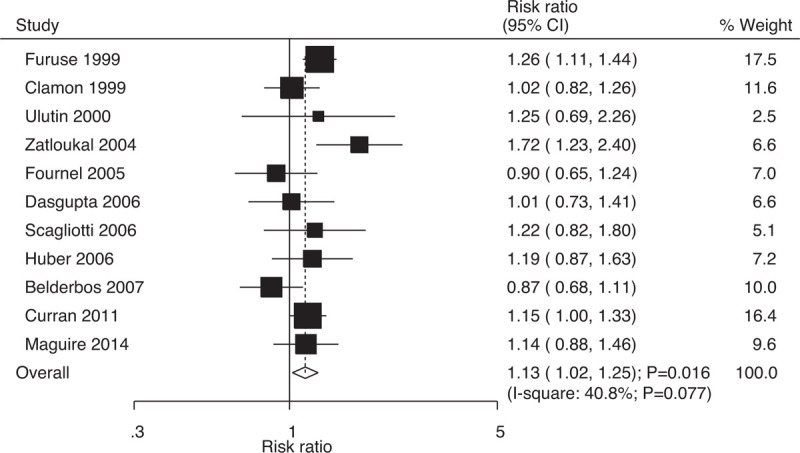
Effect of concurrent vs sequential chemoradiotherapy on the incidence of overall response rate.
3.12. Grade 3 (or greater) adverse events
Table 2 summarizes the pooled results for the risk of grade 3 (or greater) adverse events between concurrent and sequential chemoradiotherapy. The RRs suggested that concurrent chemoradiotherapy reduced leukocyte counts (RR: 2.17; 95% CI: 1.44–3.26; P < .001) and platelet counts (RR: 1.96; 95% CI: 1.24–3.09; P = .004); moreover, it was associated with esophagitis (RR: 3.85; 95% CI: 2.39–6.21; P < .001) and nausea/vomiting (RR: 1.44; 95% CI: 1.05–1.97; P = .024). However, no significant differences were found between concurrent and sequential chemoradiotherapy with respect to the risk of grade 3 (or greater) adverse events in terms of reduced hemoglobin level, reduced platelet count, reduced lymphocyte count, neutropenia, ALT level, serum creatinine level, stomatitis, diarrhea, pulmonary infection, neurotoxicity, anorexia, dyspnea, heart problems, sensory, pain, weight loss, fatigue, allergy, and fever.
Table 2.
The summary results for grade 3 (or greater) adverse events.
| Outcomes | No. of studies | RR and 95%CI | P | Heterogeneity (%) | P value for heterogeneity |
| Hemoglobin | 8 | 1.24 (0.61–2.53) | .551 | 80.1 | <.001 |
| Leukocyte | 7 | 2.17 (1.44–3.26) | <.001 | 90.3 | <.001 |
| Platelet | 7 | 1.96 (1.24–3.09) | .004 | 42.1 | .110 |
| Granulocytes/Bands | 3 | 3.16 (0.59–16.90) | .179 | 91.3 | <.001 |
| Lymphocytes | 3 | 2.47 (0.89–6.88) | .082 | 82.8 | .003 |
| Neutropenia | 4 | 0.96 (0.65–1.43) | .847 | 72.8 | .012 |
| ALT | 2 | 1.63 (0.57–4.67) | .366 | 0.0 | .492 |
| Serum creatinine | 2 | 0.97 (0.10–9.24) | .976 | 0.0 | .320 |
| Esophagitis | 11 | 3.85 (2.39–6.21) | <.001 | 38.8 | .090 |
| Stomatitis | 3 | 2.89 (0.89–9.38) | .077 | 0.0 | .999 |
| Nausea/vomiting | 8 | 1.44 (1.05–1.97) | .024 | 31.7 | .175 |
| Diarrhea | 2 | 0.66 (0.13–3.53) | .632 | 30.8 | .229 |
| Pulmonary | 8 | 0.83 (0.49–1.42) | .501 | 38.0 | .127 |
| Infection | 4 | 1.37 (0.78–2.42) | .269 | 0.0 | .643 |
| Neurotoxicity | 5 | 0.75 (0.23–2.39) | .625 | 49.5 | .095 |
| Anorexia | 2 | 1.01 (0.39–2.58) | .986 | 0.0 | .518 |
| Dyspnea | 2 | 0.72 (0.35–1.47) | .361 | 0.0 | .957 |
| Heart | 7 | 1.06 (0.54–2.11) | .857 | 0.0 | .465 |
| Sensory | 2 | 3.08 (0.32–29.38) | .329 | 0.0 | .927 |
| Pain | 2 | 1.29 (0.58–2.90) | .532 | 0.0 | .823 |
| Weight loss | 3 | 0.98 (0.33–2.95) | .978 | 0.0 | .407 |
| Fatigue | 3 | 1.54 (0.28–8.54) | .620 | 73.4 | .023 |
| Allergy | 2 | 1.56 (0.19–12.50) | .677 | 0.0 | .522 |
| Fever | 2 | 0.61 (0.08–4.90) | .642 | 0.0 | .700 |
3.13. Subgroup analyses
The results of the subgroup analyses for efficacy outcomes are shown in Table 3. There are eight main points to note here.
Table 3.
Subgroup analyses for survival rate, relapse, and overall response rate.
| Outcomes | Factors | Subgroup | RR and 95%CI | P | Heterogeneity (%) | P value for heterogeneity | P value between subgroups |
| 1-year survival rate | Percentage male | ≥70.0% | 1.05 (0.92–1.19) | .511 | 32.2 | .194 | .853 |
| <70.0% | 1.04 (0.86–1.25) | .701 | 59.0 | .062 | |||
| Performance status | 0–1 | 0.96 (0.84–1.11) | .584 | 39.3 | .144 | .052 | |
| 0–2 | 1.20 (1.03–1.41) | .023 | 0.0 | .478 | |||
| Weight loss | <5.0% | 1.01 (0.84–1.22) | .902 | 0.0 | .690 | .637 | |
| <10.0% | 1.07 (0.92–1.24) | .397 | 43.0 | .135 | |||
| Stage | III | 1.04 (0.95–1.15) | .415 | 24.4 | .235 | 1.000 | |
| Both | 0.98 (0.55–1.76) | .950 | 82.9 | .016 | |||
| Study quality | High | 1.08 (0.97–1.20) | .161 | 0.0 | .817 | .252 | |
| Low | 1.01 (0.82–1.25) | .905 | 66.3 | .018 | |||
| 2-year survival rate | Percentage male | ≥70.0% | 1.35 (1.03–1.76) | .028 | 38.7 | .163 | .614 |
| <70.0% | 1.18 (0.91–1.53) | .211 | 25.3 | .260 | |||
| Performance status | 0–1 | 1.24 (0.92–1.66) | .156 | 47.5 | .107 | .668 | |
| 0–2 | 1.61 (0.86–3.01) | .136 | 57.8 | .124 | |||
| Weight loss | <5.0% | 1.13 (0.76–1.70) | .549 | – | – | .954 | |
| <10.0% | 1.28 (0.96–1.70) | .095 | 45.0 | .122 | |||
| Stage | III | 1.24 (1.08–1.43) | .002 | 0.0 | .623 | .959 | |
| Both | 1.51 (0.42–5.40) | .522 | 83.9 | .013 | |||
| Study quality | High | 1.29 (1.06–1.57) | .011 | 0.0 | .749 | .671 | |
| Low | 1.27 (0.96–1.69) | .097 | 50.6 | .072 | |||
| 3-year survival rate | Percentage male | ≥70.0% | 1.38 (1.04–1.84) | .027 | 0.0 | .415 | .370 |
| <70.0% | 1.12 (0.77–1.62) | .563 | 0.0 | .513 | |||
| Performance status | 0–1 | 1.07 (0.76–1.50) | .702 | 0.0 | .440 | .334 | |
| 0–2 | 1.61 (1.04–2.47) | .031 | 0.0 | .695 | |||
| Weight loss | <5.0% | 1.00 (0.60–1.67) | .990 | – | – | .338 | |
| <10.0% | 1.25 (0.93–1.68) | .136 | 0.0 | .433 | |||
| Stage | III | 1.33 (1.05–1.68) | .017 | 0.0 | .689 | .166 | |
| Both | 0.68 (0.27–1.70) | .413 | – | – | |||
| Study quality | High | 1.40 (1.07–1.84) | .015 | 0.0 | .746 | .224 | |
| Low | 1.04 (0.66–1.64) | .862 | 12.4 | .319 | |||
| 4-year survival rate | Percentage male | ≥70.0% | 1.53 (1.05–2.22) | .026 | 0.0 | .939 | .780 |
| <70.0% | 1.31 (0.65–2.62) | .450 | – | – | |||
| Performance status | 0–1 | 1.37 (0.87–2.16) | .178 | 0.0 | .868 | .775 | |
| 0–2 | 1.65 (0.92–2.95) | .093 | – | – | |||
| Weight loss | <5.0% | 1.60 (1.09–2.35) | .017 | 0.0 | .494 | .986 | |
| <10.0% | 1.53 (1.01–2.32) | .047 | 0.0 | .722 | |||
| Stage | III | 1.48 (1.06–2.05) | .020 | 0.0 | .965 | .556 | |
| Both | 1.75 (1.10–2.78) | .018 | – | – | |||
| Study quality | High | 1.61 (1.21–2.15) | .001 | 0.0 | .955 | .587 | |
| Low | 1.31 (0.65–2.62) | .450 | – | – | |||
| 5-year survival rate | Percentage male | ≥70.0% | 1.65 (1.05–2.58) | .029 | 0.0 | .394 | .540 |
| <70.0% | 1.35 (0.88–2.09) | .173 | 0.0 | .369 | |||
| Performance status | 0–1 | 1.42 (0.72–2.80) | .317 | 32.8 | .223 | .773 | |
| 0–2 | 1.81 (0.98–3.35) | .059 | – | – | |||
| Weight loss | <5.0% | 1.35 (0.88–2.09) | .173 | 0.0 | .369 | .334 | |
| <10.0% | 1.88 (1.16–3.07) | .011 | 0.0 | .830 | |||
| Stage | III | 1.49 (1.09–2.04) | .012 | 0.0 | .550 | – | |
| Both | – | – | – | – | |||
| Study quality | High | 1.61 (1.14–2.26) | .006 | 0.0 | .595 | .283 | |
| Low | 1.01 (0.46–2.20) | .986 | – | – | |||
| Locoreginal relapse | Percentage male | ≥70.0% | 0.83 (0.65–1.06) | .135 | 27.7 | .246 | .525 |
| <70.0% | 0.77 (0.64–0.92) | .005 | 0.0 | .691 | |||
| Performance status | 0–1 | 0.80 (0.67–0.97) | .020 | 7.6 | .363 | .920 | |
| 0–2 | 0.73 (0.49–1.09) | .125 | 34.2 | .218 | |||
| Weight loss | <5.0% | 0.79 (0.64–0.98) | .029 | 0.0 | .935 | .638 | |
| <10.0% | 0.83 (0.61–1.13) | .237 | 50.9 | .131 | |||
| Stage | III | 0.76 (0.65–0.88) | <.001 | 0.0 | .817 | .079 | |
| Both | 1.06 (0.75–1.50) | .737 | – | – | |||
| Study quality | High | 0.78 (0.64–0.94) | .011 | 0.0 | .632 | .672 | |
| Low | 0.81 (0.65–1.03) | .082 | 27.1 | .249 | |||
| Distant relapse | Percentage male | ≥70.0% | 1.06 (0.89–1.27) | .514 | 0.0 | .936 | .764 |
| <70.0% | 0.94 (0.69–1.28) | .697 | 40.6 | .168 | |||
| Performance status | 0–1 | 0.92 (0.75–1.14) | .450 | 0.0 | .477 | .481 | |
| 0–2 | 1.12 (0.88–1.42) | .363 | 0.0 | .412 | |||
| Weight loss | <5.0% | 0.92 (0.67–1.28) | .628 | 35.5 | .212 | .768 | |
| <10.0% | 1.07 (0.89–1.28) | .490 | 0.0 | .833 | |||
| Stage | III | 1.02 (0.88–1.18) | .792 | 0.0 | .539 | .922 | |
| Both | 1.00 (0.73–1.37) | 1.000 | – | – | |||
| Study quality | High | 1.09 (0.92–1.29) | .310 | 0.0 | .975 | .189 | |
| Low | 0.91 (0.74–1.12) | .384 | 1.8 | .396 | |||
| Locoreginal plus distant relapse | Percentage male | ≥70.0% | 0.67 (0.37–1.24) | .206 | 0.0 | .916 | .409 |
| <70.0% | 0.93 (0.58–1.49) | .769 | 0.0 | .803 | |||
| Performance status | 0–1 | 0.62 (0.30–1.28) | .200 | 0.0 | .910 | .670 | |
| 0–2 | 0.92 (0.48–1.80) | .816 | 0.0 | .581 | |||
| Weight loss | <5.0% | 0.87 (0.52–1.46) | .590 | 0.0 | .864 | .639 | |
| <10.0% | 0.65 (0.33–1.27) | .209 | 0.0 | .743 | |||
| Stage | III | 0.83 (0.57–1.20) | .316 | 0.0 | .936 | – | |
| Both | – | – | – | – | |||
| Study quality | High | 0.79 (0.52–1.20) | .270 | 0.0 | .881 | .646 | |
| Low | 0.98 (0.43–2.22) | .963 | 0.0 | .518 | |||
| Overall response rate | Percentage male | ≥70.0% | 1.08 (0.90–1.30) | .383 | 58.2 | .048 | .924 |
| <70.0% | 1.19 (1.00–1.40) | .047 | 55.7 | .079 | |||
| Performance status | 0–1 | 1.00 (0.89–1.13) | .948 | 0.0 | .461 | .008 | |
| 0–2 | 1.42 (1.05–1.91) | .022 | 66.1 | .086 | |||
| Weight loss | <5.0% | 1.12 (1.00–1.25) | .059 | 0.0 | .588 | .737 | |
| <10.0% | 1.02 (0.77–1.35) | .904 | 79.2 | .008 | |||
| Stage | III | 1.17 (1.07–1.27) | .001 | 22.2 | .239 | .021 | |
| Both | 0.87 (0.68–1.11) | 0.261 | – | – | |||
| Study quality | High | 1.19 (1.09–1.29) | <.001 | 0.0 | .540 | .184 | |
| Low | 1.10 (0.90–1.34) | .354 | 63.8 | .026 |
-
1.
Although no significant results were identified between concurrent and sequential chemoradiotherapy for 1-year survival rates, concurrent chemoradiotherapy yielded significant benefits if the performance status of patients was 0 to 2.
-
2.
It was evident that concurrent chemoradiotherapy significantly increased the 2-year survival rates in RCTs with male proportion of ≥70%, stage III NSCLC, and trials with high quality.
-
3.
Concurrent chemoradiotherapy was associated with increased 3-year survival rates in RCTs with male proportion of ≥70%, patient performance status of 0 to 2, stage III NSCLC, and trials with high quality.
-
4.
Concurrent chemoradiotherapy was associated with increased 4-year survival rates in RCTs with male proportion of ≥70%, negligible weight loss, any stage of stages, and trials with high quality.
-
5.
Significant differences were evident between concurrent and sequential chemoradiotherapy with respect to 5-year survival rates in RCTs with male proportion of ≥70%, weight loss of <10%, stage III NSCLC, and trials with high quality.
-
6.
Concurrent chemoradiotherapy was associated with a reduced risk of locoregional relapse mainly in RCTs with male proportion of <70%, patient performance status of 0 to 1, weight loss of <5%, stage III NSCLC, and trials with high quality.
-
7.
The subgroup analysis results for distant relapse and locoregional plus distant relapse in all subsets were consistent with the overall analysis.
-
8.
Concurrent chemoradiotherapy significantly increased the overall response rates in RCTs with male proportion of <70%, patient performance status of 0 to 2, stage III NSCLC, and trials with high quality.
3.14. Publication bias
Publication bias for the efficacy outcomes are presented in Supplemental Digital Content 2. Overall, no significant publication biases were evident for 1-year survival rates (P-value for Egger: .881; P-value for Begg: 1), 2-year survival rates (P-value for Egger: .107; P-value for Begg: .371), 3-year survival rates (P-value for Egger: .687; P-value for Begg: .764), 4-year survival rates (P-value for Egger: .182; P-value for Begg: .221), 5-year survival rates (P-value for Egger: .317; P-value for Begg: .806), locoregional relapse (P-value for Egger:.249; P-value for Begg: .711), distant relapse (P-value for Egger: .518; P-value for Begg: .917), locoregional plus distant relapse (P-value for Egger: .305; P-value for Begg: .452), and overall response rates (P-value for Egger: .682; P-value for Begg: .533).
4. Discussion
To the best of our knowledge, this study is the first to compare the efficacy and safety of concurrent and sequential chemoradiotherapy with respect to patients with advanced NSCLC. Overall, 2634 patients with NSCLC from 14 RCTs (with wide-ranging patient characteristics) were evaluated in this study. The findings suggest that concurrent chemoradiotherapy yields significant benefits with respect to NSCLC prognosis, including increased survival rates at 2, 3, 4, and 5 years as well as improved locoregional relapse and overall response rates. However, the risk of grade 3 (or greater) adverse events, such as esophagitis, nausea/vomiting, and reduced leukocyte and platelet counts, significantly increases with concurrent chemoradiotherapy. According to subgroup analysis, the effectiveness of concurrent and sequential chemoradiotherapy with respect to the RCTs in question is dependent on the following elements: male proportion, performance status, weight loss, NSCLC stage, and study quality.
Although the RCTs in question did not conduct a meta-analysis to evaluate the efficacy and safety of concurrent and sequential chemoradiotherapy in patients with advanced NSCLC, qualitative systematic reviews suggested that concurrent chemoradiotherapy yields superior effects in terms of median survival duration, overall response rates, and local relapse control rates. However, the magnitude of pooled-effect estimates for survival outcomes between concurrent and sequential chemoradiotherapy were not addressed in previous study.[33] Therefore, a quantitative meta-analysis was conducted to evaluate the treatment effects of concurrent chemoradiotherapy vs sequential chemoradiotherapy in patients with advanced NSCLC.
The results indicated no significant differences between concurrent and sequential chemoradiotherapy for 1-year survival rates, whereas 2-, 3-, 4-, and 5-year survival rates increased significantly with concurrent chemoradiotherapy. Moreover, no significant differences were noted between concurrent and sequential chemoradiotherapy in terms of 1-year survival rate, mainly in 3 included trials.[27,29,32] This could be due to the combination of various chemotherapy and radiotherapy strategies used therein, which in turn can affect survival outcomes at various follow-up periods. Moreover, subgroup analysis indicated that concurrent chemoradiotherapy is effective in RCTs with male proportion of ≥70%, patient performance status of 0 to 2, stage III NSCLC, and trials with high quality. These results suggest that the superior effects of concurrent chemoradiotherapy are mainly observed in high-risk and poor-prognosis patients.
Indeed, the results suggest that compared with sequential chemoradiotherapy, concurrent chemoradiotherapy significantly reduces the risk of locoregional relapse; moreover, no significant differences were found between the groups with respect to distant relapse and locoregional plus distant relapse. The significantly improved survival rates in patients who receive concurrent chemoradiotherapy can be attributed to the increased locoregional tumor control. Moreover, concurrent chemoradiotherapy can produce a radiotherapy-enhancing effect on tumor volume, which in turn can further improve locoregional tumor control.[34] According to subgroup analysis, the significant differences between concurrent and sequential chemoradiotherapy are mainly found in RCTs with male proportion of <0%, patient performance status of 0 to 1, weight loss of <5%, stage III NSCLC, and trials with high quality. Indeed, the effectiveness of both concurrent and sequential chemoradiotherapy is easily detected in low-risk and positive-prognosis patients. The stratified analysis results could have been affected by the number of trials included in these subsets.
We noted that the difference in concurrent vs sequential chemoradiotherapy was associated with an increase in overall response rates in patients with advanced NSCLC. According to subgroup analysis, this significant difference is mainly detected in RCTs with male proportion of <70%, patient performance status of 0 to 2, stage III NSCLC, and trials with high quality. The differences between the groups with respect to overall response rates can be explained by the treatment strategy and metastasis sites.[35,36] Indeed, the subgroup analysis results suggest that compared with sequential chemoradiotherapy, concurrent chemoradiotherapy yields greater benefits for overall response rates, especially for poor-prognosis and high-risk patients.
Unfortunately, concurrent chemoradiotherapy is associated with grade 3 (or greater) adverse events, such as esophagitis, nausea/vomiting, and reduced leukocyte and platelet counts. These results are significantly correlated with the benefit/risk ratio and quality of life. Moreover, the increased risks of severe hematologic and nonhematologic toxicity are significantly associated with the radiotherapy doses, which in turn can affect the incidences of local tumor and survival rates.[37,38]
Several limitations of this meta-analysis should be acknowledged:
-
1.
potential significant heterogeneity was detected among included trials, which could not be completely explained in subgroup analyses;
-
2.
various chemotherapy and radiotherapy strategies were evident across the included trials, which could affect NSCLC prognosis;
-
3.
subgroup analysis according to histology of NSCLC were not conducted because data stratified by histology of NSCLC were not available in each trial;
-
4.
this study was based on published articles and unpublished data were not evaluated, which inevitable results in a publication bias;
-
5.
this study was based on study-level data, which means that individual data were not available, thus restricting further detailed analysis.
In conclusion, the meta-analysis demonstrated that compared with sequential chemoradiotherapy, concurrent chemoradiotherapy yields significant benefits with respect to survival rates at 2, 3, 4, and 5 years as well as with respect to locoregional relapse and overall response rates; however, concurrent chemoradiotherapy is also associated with an increased risk of grade 3 (or greater) adverse events, such as esophagitis, nausea/vomiting, and reduced leukocyte and platelet counts. Indeed, further studies regarding specific treatment strategies should be conducted using large-scale RCTs.
Author contributions
XXXXX.
Supplementary Material
Supplementary Material
Footnotes
Abbreviations: CI = confidence interval, NSCLC = non–small-cell lung cancer, PRISMA = Systematic Reviews and Meta-Analysis, RCT = randomized controlled trials, RR = relative risk.
How to cite this article: Xiao W, Hong M. Concurrent vs sequential chemoradiotherapy for patients with advanced non–small-cell lung cancer: A meta-analysis of randomized controlled trials. Medicine. 2021;100:11(e21455).
The authors have no conflicts of interest to disclose.
All data generated or analyzed during this study are included in this published article [and its supplementary information files].
Supplemental digital content is available for this article.
References
- [1].Herbst RS, Heymach JV, Lippman SM. Lung cancer. N Engl J Med 2008;359:1367–80. [DOI] [PMC free article] [PubMed] [Google Scholar]
- [2].Chemotherapy in non-small cell lung cancer: a meta-analysis using updated data on individual patients from 52 randomised clinical trials. Non-small Cell Lung Cancer Collaborative Group. BMJ 1995;311:899–909. [PMC free article] [PubMed] [Google Scholar]
- [3].Auperin A, Le Pechoux C, Rolland E, et al. Meta-analysis of concomitant versus sequential radiochemotherapy in locally advanced non-small-cell lung cancer. J Clin Oncol 2010;28:2181–90. [DOI] [PubMed] [Google Scholar]
- [4].Bezjak A, Temin S, Franklin G, et al. Definitive and adjuvant radiotherapy in locally advanced non-small-cell lung cancer: American Society of Clinical Oncology Clinical Practice Guideline Endorsement of the American Society for Radiation Oncology Evidence-Based Clinical Practice Guideline. J Clin Oncol 2015;33:2100–5. [DOI] [PubMed] [Google Scholar]
- [5].Schaake-Koning C, van den Bogaert W, Dalesio O, et al. Effects of concomitant cisplatin and radiotherapy on inoperable non-small-cell lung cancer. N Engl J Med 1992;326:524–30. [DOI] [PubMed] [Google Scholar]
- [6].Jeremic B, Shibamoto Y, Acimovic L, et al. Hyperfractionated radiation therapy with or without concurrent low-dose daily carboplatin/etoposide for stage III non-small-cell lung cancer: a randomized study. J Clin Oncol 1996;14:1065–70. [DOI] [PubMed] [Google Scholar]
- [7].Lee JS, Scott C, Komaki R, et al. Concurrent chemoradiation therapy with oral etoposide and cisplatin for locally advanced inoperable non-small-cell lung cancer: radiation therapy oncology group protocol 91-06. J Clin Oncol 1996;14:1055–64. [DOI] [PubMed] [Google Scholar]
- [8].Byhardt RW, Scott CB, Ettinger DS, et al. Concurrent hyperfractionated irradiation and chemotherapy for unresectable nonsmall cell lung cancer. Results of Radiation Therapy Oncology Group 90-15. Cancer 1995;75:2337–44. [DOI] [PubMed] [Google Scholar]
- [9].Moher D, Liberati A, Tetzlaff J, et al. Preferred reporting items for systematic reviews and meta-analyses: the PRISMA statement. PLoS Med 2009;6:e1000097. [DOI] [PMC free article] [PubMed] [Google Scholar]
- [10].Jadad AR, Moore RA, Carroll D, et al. Assessing the quality of reports of randomized clinical trials: is blinding necessary? Control Clin Trials 1996;17:1–2. [DOI] [PubMed] [Google Scholar]
- [11].DerSimonian R, Laird N. Meta-analysis in clinical trials. Control Clin Trials 1986;7:177–88. [DOI] [PubMed] [Google Scholar]
- [12].Ades AE, Lu G, Higgins JP. The interpretation of random-effects meta-analysis in decision models. Med Decis Making 2005;25:646–54. [DOI] [PubMed] [Google Scholar]
- [13].Deeks JJHJ, Altman DG. Higgins J, GS. Analysing data and undertaking meta-analyses. The Cochrane Collaboration, Cochrane Handbook for Systematic Reviews of Interventions. Oxford: 2008. [Google Scholar]
- [14].Higgins JP, Thompson SG, Deeks JJ, et al. Measuring inconsistency in meta-analyses. BMJ 2003;327:557–60. [DOI] [PMC free article] [PubMed] [Google Scholar]
- [15].Tobias A. Assessing the influence of a single study in the meta-analysis. Stata Tech Bull 1999;47:15–7. [Google Scholar]
- [16].Altman DG, Bland JM. Interaction revisited: the difference between two estimates. BMJ 2003;326:219. [DOI] [PMC free article] [PubMed] [Google Scholar]
- [17].Egger M, Davey Smith G, Schneider M, et al. Bias in meta-analysis detected by a simple, graphical test. BMJ 1997;315:629–34. [DOI] [PMC free article] [PubMed] [Google Scholar]
- [18].Begg CB, Mazumdar M. Operating characteristics of a rank correlation test for publication bias. Biometrics 1994;50:1088–101. [PubMed] [Google Scholar]
- [19].Furuse K, Fukuoka M, Kawahara M, et al. Phase III study of concurrent versus sequential thoracic radiotherapy in combination with mitomycin, vindesine, and cisplatin in unresectable stage III non-small-cell lung cancer. J Clin Oncol 1999;17:2692–9. [DOI] [PubMed] [Google Scholar]
- [20].Clamon G, Herndon J, Cooper R, et al. Radiosensitization with carboplatin for patients with unresectable stage III non-small-cell lung cancer: a phase III trial of the Cancer and Leukemia Group B and the Eastern Cooperative Oncology Group. J Clin Oncol 1999;17:4–11. [DOI] [PubMed] [Google Scholar]
- [21].Ulutin HC, Guden M, Oysul K, et al. Split-course radiotherapy with or without concurrent or sequential chemotherapy in non-small cell lung cancer. Radiat Med 2000;18:93–6. [PubMed] [Google Scholar]
- [22].Curran W, Jr. Long-term benefit is observed in a phase III comparison of sequential vs concurrent chemo-radiation for patients with unresectable stage III NSCLC: RTOG 9410. Proc Am Soc Clin Oncol 2003. [Google Scholar]
- [23].Zatloukal P, Petruzelka L, Zemanova M, et al. Concurrent versus sequential chemoradiotherapy with cisplatin and vinorelbine in locally advanced non-small cell lung cancer: a randomized study. Lung Cancer 2004;46:87–98. [DOI] [PubMed] [Google Scholar]
- [24].Fournel P, Robinet G, Thomas P, et al. Randomized phase III trial of sequential chemoradiotherapy compared with concurrent chemoradiotherapy in locally advanced non-small-cell lung cancer: Groupe Lyon-Saint-Etienne d’Oncologie Thoracique-Groupe Francais de Pneumo-Cancerologie NPC 95-01 Study. J Clin Oncol 2005;23:5910–7. [DOI] [PubMed] [Google Scholar]
- [25].Belani CP, Choy H, Bonomi P, et al. Combined chemoradiotherapy regimens of paclitaxel and carboplatin for locally advanced non-small-cell lung cancer: a randomized phase II locally advanced multi-modality protocol. J Clin Oncol 2005;23:5883–91. [DOI] [PubMed] [Google Scholar]
- [26].Dasgupta A, Dasgupta C, Basu S, et al. A prospective and randomized study of radiotherapy, sequential chemotherapy radiotherapy and concomitant chemotherapy-radiotherapy in unresectable non-small cell carcinoma of the lung. J Cancer Res Ther 2006;2:47–51. [DOI] [PubMed] [Google Scholar]
- [27].Scagliotti GV, Szczesna A, Ramlau R, et al. Docetaxel-based induction therapy prior to radiotherapy with or without docetaxel for non-small-cell lung cancer. Br J Cancer 2006;94:1375–82. [DOI] [PMC free article] [PubMed] [Google Scholar]
- [28].Huber RM, Flentje M, Schmidt M, et al. Simultaneous chemoradiotherapy compared with radiotherapy alone after induction chemotherapy in inoperable stage IIIA or IIIB non-small-cell lung cancer: study CTRT99/97 by the Bronchial Carcinoma Therapy Group. J Clin Oncol 2006;24:4397–404. [DOI] [PubMed] [Google Scholar]
- [29].Belderbos J, Uitterhoeve L, van Zandwijk N, et al. Randomised trial of sequential versus concurrent chemo-radiotherapy in patients with inoperable non-small cell lung cancer (EORTC 08972-22973). Eur J Cancer 2007;43:114–21. [DOI] [PubMed] [Google Scholar]
- [30].Crvenkova S, Krstevska V. Sequential chemoradiotherapy compared with concurrent chemoradiotherapy in locally advanced non-small cell lung cancer: our experience. Prilozi 2009;30:197–207. [PubMed] [Google Scholar]
- [31].Curran WJ, Jr, Paulus R, Langer CJ, et al. Sequential vs. concurrent chemoradiation for stage III non-small cell lung cancer: randomized phase III trial RTOG 9410. J Natl Cancer Inst 2011;103:1452–60. [DOI] [PMC free article] [PubMed] [Google Scholar]
- [32].Maguire J, Khan I, McMenemin R, et al. SOCCAR: A randomised phase II trial comparing sequential versus concurrent chemotherapy and radical hypofractionated radiotherapy in patients with inoperable stage III Non-Small Cell Lung Cancer and good performance status. Eur J Cancer 2014;50:2939–49. [DOI] [PubMed] [Google Scholar]
- [33].Liang HY, Zhou H, Li XL, et al. Chemo-radiotherapy for advanced non-small cell lung cancer: concurrent or sequential? It's no longer the question: a systematic review. Int J Cancer 2010;127:718–28. [DOI] [PubMed] [Google Scholar]
- [34].Vokes EE, Crawford J, Bogart J, et al. Concurrent chemoradiotherapy for unresectable stage III non-small cell lung cancer. Clin Cancer Res 2005;11(13 Pt 2):5045s–50s. [DOI] [PubMed] [Google Scholar]
- [35].Albain KS, Crowley JJ, Turrisi AT, 3rd, et al. Concurrent cisplatin, etoposide, and chest radiotherapy in pathologic stage IIIB non-small-cell lung cancer: a Southwest Oncology Group phase II study, SWOG 9019. J Clin Oncol 2002;20:3454–60. [DOI] [PubMed] [Google Scholar]
- [36].Gandara DR, Chansky K, Albain KS, et al. Consolidation docetaxel after concurrent chemoradiotherapy in stage IIIB non-small-cell lung cancer: phase II Southwest Oncology Group Study S9504. J Clin Oncol 2003;21:2004–10. [DOI] [PubMed] [Google Scholar]
- [37].Socinski MA, Rosenman JG, Halle J, et al. Dose-escalating conformal thoracic radiation therapy with induction and concurrent carboplatin/paclitaxel in unresectable stage IIIA/B nonsmall cell lung carcinoma: a modified phase I/II trial. Cancer 2001;92:1213–23. [DOI] [PubMed] [Google Scholar]
- [38].El-Sharouni SY, Kal HB, Battermann JJ, et al. Sequential versus concurrent chemo-radiotherapy in inoperable stage III non-small cell lung cancer. Anticancer Res 2006;26(1B):495–505. [PubMed] [Google Scholar]
Associated Data
This section collects any data citations, data availability statements, or supplementary materials included in this article.


