

Abstract
Objectives
This study aimed to explore the novel biomarkers for immune checkpoint inhibitor (ICI) responses in non‐small cell lung cancer (NSCLC) by integrating genomic profiling, tumor mutational burden (TMB), and expression of programmed death receptor 1 ligand (PD‐L1).
Materials and Methods
Tumor and blood samples from 637 Chinese patients with NSCLC were collected for targeted panel sequencing. Genomic alterations, including single nucleotide variations, insertions/deletions, copy number variations, and gene rearrangements, were assessed and TMB was computed. TMB‐high (TMB‐H) was defined as ≥10 mutations/Mb. PD‐L1 positivity was defined as ≥1% tumor cells with membranous staining. Genomic data and ICI outcomes of 240 patients with NSCLC were derived from cBioPortal.
Results
EGFR‐sensitizing mutations, ALK, RET, and ROS1 rearrangements were associated with lower TMB and PD‐L1+/TMB‐H proportions, whereas KRAS, ALK, RET, and ROS1 substitutions/indels correlated with higher TMB and PD‐L1+/TMB‐H proportions than wild‐type genotypes. Histone‐lysine N‐methyltransferase 2 (KMT2) family members (KMT2A, KMT2C, and KMT2D) were frequently mutated in NSCLC tumors, and these mutations were associated with higher TMB and PD‐L1 expression, as well as higher PD‐L1+/TMB‐H proportions. Specifically, patients with KMT2C mutations had higher TMB and PD‐L1+/TMB‐H proportions than wild‐type patients. The median progression‐free survival (PFS) was 5.47 months (95% CI 2.5–NA) in patients with KMT2C mutations versus 3.17 months (95% CI 2.6–4.27) in wild‐type patients (p = 0.058). Furthermore, in patients with NSCLC who underwent ICI treatment, patients with TP53/KMT2C co‐mutations had significantly longer PFS and greater durable clinical benefit (HR: 0.48, 95% CI: 0.24–0.94, p = 0.033). TP53 mutation combined with KMT2C or KRAS mutation was a better biomarker with expanded population benefit from ICIs therapy and increased the predictive power (HR: 0.46, 95% CI: 0.26–0.81, p = 0.007).
Conclusion
We found that tumors with different alterations in actionable target genes had variable expression of PD‐L1 and TMB in NSCLC. TP53/KMT2C co‐mutation might serve as a predictive biomarker for ICI responses in NSCLC.
Implications for Practice
Cancer immunotherapies, especially immune checkpoint inhibitors (ICIs), have revolutionized the treatment of non‐small cell lung cancer (NSCLC); however, only a proportion of patients derive durable responses to this treatment. Biomarkers with greater accuracy are highly needed. In total, 637 Chinese patients with NSCLC were analyzed using next‐generation sequencing and IHC to characterize the unique features of genomic alterations and TMB and PD‐L1 expression. Our study demonstrated that KMT2C/TP53 co‐mutation might be an accurate, cost‐effective, and reliable biomarker to predict responses to PD‐1 blockade therapy in NSCLC patients and that adding KRAS to the biomarker combination creates a more robust parameter to identify the best responders to ICI therapy.
Keywords: lysine methyltransferase 2C, non‐small cell lung cancer, programmed cell death 1 ligand 1, tumor mutation burden, tumor protein p53
Cancer immunotherapy, especially immune checkpoint inhibitors (ICIs), is epoch‐making in non‐small cell lung cancer (NSCLC), but only a proportion of patients can derive durable benefits from it, more accurate biomarkers are thus highly needed. Samples of 637 Chinese patients with NSCLC were analyzed through next‐generation sequencing and IHC to characterize the unique features of genomic alterations, TMB, and PD‐L1 expression. The results showed that the alteration subtypes of common driver genes including EGFR G719X, KRAS G12C, MET amplification, and SNVs/INDELs of ALK, RET, and ROS1 in NSCLC are associated with higher PD‐L1 expression or higher TMB value. Furthermore, our study first demonstrated that KMT2C/TP53 co‐mutation might be an accurate, cost‐effective, and reliable biomarker to predict the responses to PD‐1 blockade therapy in NSCLC patients, and that adding KRAS to the biomarker combination creates a more robust parameter to identify the best responders to ICI therapy.

1. INTRODUCTION
Lung cancer is the most commonly diagnosed cancer and the leading cause of cancer‐related deaths in China. 1 Immune checkpoint inhibitors (ICIs), particularly inhibitors of the programmed cell death 1 (PD‐1)/PD‐1 ligand (PD‐L1) axis, have altered the landscape of non‐small cell lung cancer (NSCLC) treatment. 2 Responses to ICIs can be remarkably durable, but they only occur in a minority of patients, 3 causing the determinants of ICI sensitivity to remain elusive. Therefore, it has become an urgent priority to identify the biomarkers of responsiveness to ICIs and develop strategies that could potentially increase the patient response rates or the number of patients who may potentially benefit from ICI treatment.
Several ICI‐responsiveness biomarkers have been proposed, including the tumoral expression of PD‐L1, 4 tumor‐infiltrating lymphocytes (TILs), 5 tumor mutational burden (TMB), 6 , 7 DNA mismatch‐repair deficiency, 8 and gene signatures reflecting preexisting adaptive immunity 9 ; however, each of these biomarkers has limited utility. Although PD‐L1 immunohistochemistry (IHC) is the first Food and Drug Administration‐approved companion diagnostic test for ICI treatment, challenges in defining the positive thresholds during quantification, the lack of consensus regarding the anti‐PD‐L1 antibodies used, and intratumoral heterogeneity limit the clinical application of PD‐L1 detection. 10 TMB is another potential predictive factor of the ICI response. An association between an elevated TMB and the response to or durable clinical benefits (DCBs) of ICIs in patients with NSCLC was identified in several clinical trials 11 and real‐world studies. 6 , 7 However, the use of TMB as a biomarker requires expensive genomic platforms and long turnaround times; moreover, TMB has no validated cutoff value, which limits the use of this biomarker. 12 Importantly, the main limitation of strategies employing biomarkers is linked to the selection of an optimal cutoff for clinical decision making.
Somatic mutations in specific genes may influence the ability of tumor cells to evade immune surveillance. Sensitizing mutations in the epidermal growth factor receptor (EGFR) gene and rearrangements in the anaplastic lymphoma kinase (ALK) gene are predictors of a poor response to ICIs, and patients with these genomic alterations are routinely excluded from most ICI trials. 13 A retrospective analysis has found that only 3.6% of patients with such gene alterations responded to ICIs, while 23.3% of EGFR wild‐type and ALK‐negative patients and patients with an unknown genetic background responded to ICIs. 14 A meta‐analysis of five clinical trials that included 3,025 patients with advanced NSCLC who were treated with a PD‐L1 inhibitor found that, among patients with EGFR mutations, the overall survival (OS) was not improved compared to those treated with docetaxel. 15 EGFR‐mutated or ALK‐rearranged lung cancers exhibit lower PD‐L1 expression levels and lower CD8+ T‐cell infiltration, which may be responsible for the poor response to ICIs. 16 In contrast, genomic alterations in DNA damage response pathways, mainly including homologous recombination repair, mismatch repair (MMR), and DNA polymerase ε (POLE)/DNA polymerase δ (POLD) genes, 17 are associated with an increase in TMB and have been identified as predictors of favorable responses to ICIs. 18 A subset of patients with KRAS proto‐oncogene (KRAS)/tumor protein p53 (TP53) mutant NSCLC were shown to be characterized by increased expression of PD‐L1 in tumor cells, increased TMB, and a higher degree of tumor infiltration by CD8+ T cells, which led to improved clinical outcomes. 19 In contrast, co‐mutations in serine/threonine kinase 11 (STK11) in KRAS‐mutated lung tumors were associated with low expression of PD‐L1 and a decreased response to ICIs, leading to a poor survival. 20 More recently, a subgroup of patients with NSCLC was found to carry TP53 and ataxia telangiectasia‐mutated (ATM) co‐mutations, which were associated with an increased TMB and a better response to ICIs. 21 These findings raise questions regarding whether comprehensive genomic alterations in tumor tissues are related to existing ICI biomarkers, such as PD‐L1 and TMB, and whether other specific genes can predict the therapeutic outcomes.
Epigenetic dysregulation, including DNA methylation, histone modifications, and noncoding RNAs, has been reported to be involved in the pathogenesis of NSCLC and responses to immunotherapy. 22 A prospective, multicenter study has associated a specific epigenetic profile, based on DNA methylation microarrays, with progression‐free survival (PFS) and OS in patients with NSCLC, who were receiving anti‐PD‐1 antibodies. 23 Histone methylation is a particularly important process that regulates the transcription of genes associated with the evasion of immune surveillance by tumors. Histone‐lysine N‐methyltransferase 2 (KMT2) family proteins methylate lysine 4 on the histone H3 tail in important genomic regulatory regions and thereby modulate the chromatin structure and DNA accessibility. 24 Mutations in genes of the KMT2 family are among the most frequent in human cancer and are associated with some of the most common and deadly solid tumors, such as lung 25 and colon 26 carcinomas. The KMT2C protein, also known as MLL3, is part of a transcriptional coactivator complex and a tumor suppressor involved in several cellular processes, including the regulation of homeostasis and hormone receptor signaling. 27 Notably, KMT2C is frequently mutated in cancers, including lung adenocarcinoma, 28 but the association between KMT2C and immunotherapeutic responses remains unclear. Therefore, we hypothesized that the mutational status of KMT2C or KMT2C‐based mutational signatures might be useful as a predictive biomarker in ICI‐treated patients with NSCLC.
In this study, a cohort comprising 637 patients with NSCLC was used to determine the landscape of immune biomarkers in patients with genomic alterations, including those in NSCLC driver genes and other frequently mutated genes, as detected by next‐generation sequencing (NGS). Furthermore, we validated our hypothesis using data of clinical immunotherapeutic patients from the cBioPortal database. We demonstrated that TP53/KMT2C co‐mutations predict a better response to ICI therapies and that the TP53 mutation, in conjunction with either a KRAS or KMT2C mutation, could be used as a potential predictor of the ICI response. These biomarkers could allow a greater number of patients to benefit from ICI treatment.
2. MATERIALS AND METHODS
2.1. Patient selection
In total, 637 patients who received surgery or were biopsied from December 2017 to January 2019, with a final pathological diagnosis of NSCLC, were retrospectively identified in this study. Tumor samples were collected between December 2017 and January 2019. Matched blood samples were collected as normal controls. Tissue samples were formalin‐fixed paraffin‐embedded (FFPE) in accredited clinical hospitals with 10% formalin for 24–72 hours at room temperature. This study was approved by the Institution Review Board of the First Hospital of Kunming Medical University and Guangdong Provincial People's Hospital and conducted according to the Declaration of Helsinki. Informed consent was obtained from all enrolled patients.
To further explore the association between gene mutations and the clinical benefit of ICIs, we included genomic and clinical data derived from the cohort treated with immune checkpoint blockades (ICBs) in cBioPortal (www.cbioportal.org), 29 , 30 which consisted of 240 patients with NSCLC treated with an anti‐PD‐1 therapeutic scheme (Rizvi cohort). 31 Measures of PFS and durable clinical benefit (complete response/partial response or stable disease that lasted >6 months) were based on definitions consistent with those in the abovementioned trial.
2.2. NGS and bioinformatics analysis
All tumor tissues and matched blood samples underwent targeted NGS‐based genomic testing (OrigiMed, Shanghai, China) in a College of American Pathologists (CAP)‐accredited and Clinical Laboratory Improvement Amendments (CLIA)‐certified laboratory. 32 Approximately 50 ng of cancer tissue DNA was extracted from 40 mm FFPE and blood samples using the DNA Extraction Kit (QIAamp DNA FFPE Tissue Kit, Cat no. 60404; Qiagen), according to the manufacturer's instructions. All coding exons and selected introns of targeted genes were captured using a hybridization capture panel and then, sequenced on an Illumina NextSeq‐500 Platform (Illumina Incorporated). For FFPE samples the sequencing depth mean coverage was 900× (minimum 700×), while for matched blood samples the sequencing depth was 300×. Genomic alterations, including single nucleotide variants (SNVs), short and long insertions/deletions (indels), copy number variations (CNVs), and gene rearrangements were subjected to advanced analysis. TMB was defined as somatic mutations including coding base substitutions and indel mutations per megabase (muts/Mb) of genome examined. For our TMB calculation, all indels and non‐synonymous alterations in the coding region were considered while known hotspot mutations in oncogenic drivers and known germline alterations in the single nucleotide polymorphism database (dbSNP) were excluded. 33 High TMB (TMB‐H) and low TMB (TMB‐L) were defined as ≥10 and <10 muts/Mb, respectively. 34 The functionality of KMT2C mutations was assessed by in silico mutation prediction tools, namely PolyPhen‐2 (http://genetics.bwh.harvard.edu/pph2/). Mutational signature analysis was carried out based on R packages “deconstructSigs” (version 1.8.0) and “SomaticSignatures” (version 3.11) using 30 COSMIC signatures. 35 , 36
2.3. PD‐L1 IHC assessment
PD‐L1 IHC staining assay was performed as previously described. 37 The expression of PD‐L1 was assessed by IHC analysis of FFPE tumor samples using anti‐PD‐L1 antibodies (clone 22C3; Cat no. M3653; Dako). The PD‐L1 tumor proportion score (TPS), which is the percentage of tumor cells showing partial or complete membrane staining, was determined and classified as negative, low‐positive, or high‐positive (TPS of <1%, 1%–49%, and ≥50%, respectively).
2.4. Statistical analysis
Statistical analysis was conducted using the R Statistical Software package (version 3.4.3, R Foundation for Statistical Computing). Categorical variables are presented as numbers and percentages; medians and percentiles are reported for continuous variables. In multiple‐group comparisons, Kruskal–Wallis rank sum tests, Chi‐square tests, or Fisher's exact tests (limited sample size [<10] for single category), with Bonferroni post hoc comparisons were used. Kendall's rank correlations were used to correlate the expression levels of PD‐L1 and TMBs. Survival analysis was performed using Kaplan–Meier curves, with p values determined by log‐rank tests. Hazard ratios (HRs) were determined through Cox regression. The threshold for statistical significance was set at p < 0.05.
3. RESULTS
3.1. Correlation between expression of PD‐L1, TMB, and clinicopathologic characteristics
In total, 637 patients with NSCLC were included in the study. Clinical characteristics of patients are shown in Table S1. The majority of patients were male (355/637; 55.7%) and the median age at diagnosis was 60 years (interquartile range [IQR], 53–67 years). Non‐squamous cell carcinoma was the most frequent histological type (N = 553, 86.8%), including adenocarcinoma (N = 537) and other non‐squamous histological subtypes (N = 16).
Expression of PD‐L1 and TMB was assessed in all 637 patients. The distribution of the expression of PD‐L1 and TMB according to demographic characteristics is presented in Table S1. Representative IHC stains of PD‐L1 in NSCLC using 22C3 are shown in Figure S1. Low‐positive (TPS =1–49%) and high‐positive (TPS ≥50%) expression of PD‐L1 was observed in 16.5% and 10% of cases, respectively. We performed univariate analysis of the association of expression of PD‐L1 (evaluated as categorical variables with cut‐off values of 1% and 50%) with clinical features of NSCLC (Table S1). Expression of PD‐L1 was significantly higher in males (p = 0.002) and in squamous cell carcinomas (p < 0.001).
The median TMB for the cohort was 4.6 muts/Mb (IQR, 2.3–10). A TMB ≥10 muts/Mb was seen in 29.4% of tumors. We found a significant increase in age‐associated with higher TMB (p < 0.001). TMB was significantly higher in males (p < 0.001), squamous cell carcinomas (p < 0.001), and current/former smokers. Finally, there was a weak association between the expression of PD‐L1 and TMB (Kendall's coefficient 0.179, p < 0.001). (Figure S2); the median IQR of TMB was 4.25 (2.3–8.5), 6.9 (3.8–13.1), and 9.2 (3.6–13.9) for PD‐L1 TPS <1%, 1–49%, and ≥50%, respectively (p < 0.001).
3.2. Correlation between expression of PD‐L1, TMB, and gene alterations
Overall, the average number of mutations per cancer sample was 7.9. The incidence of genomic alterations and the mutational profile (frequency and composition) are summarized in Figure S3. The frequency and composition of genomic alterations in lung cancer‐related genes were different between squamous and non‐squamous cell carcinomas. Considering the histological subtypes of NSCLC, non‐squamous and squamous lung cancers displayed different patterns. The frequency of the driver gene EGFR alterations was much higher in non‐squamous lung cancers than in squamous lung cancers (57.5% vs. 10.7%, p < 0.001). In contrast, the frequency of KMT2C and CDKN2A was lower in non‐squamous lung cancers (KMT2C: 4.2% vs. 10.7%, p = 0.021; CDKN2A: 10.1% vs. 25%, p < 0.001). Similarly, the frequency of phosphatidylinositol‐4, 5‐bisphosphate 3‐kinase catalytic subunit alpha (PIK3CA) changes was much lower in non‐squamous lung cancers (8% vs. 40.5%, p < 0.001). However, the prevalence of catenin beta 1 (CTNNB1) and cyclin‐dependent kinase 4 (CDK4) only showed alterations in non‐squamous, but not in squamous lung cancers. Of interest, EGFR mutations (51.3%) and ALK fusion/rearrangements (5.8%) were the most frequent actionable genomic alterations in our NSCLC cohort. Additional actionable alterations were: erb‐b2 receptor tyrosine kinase 2 (ERBB2) mutations (4.1%), B‐Raf proto‐oncogene (BRAF) V600E (1.3%), MET proto‐oncogene (MET) amplification (1.6%), MET ex14 skipping (0.8%), Ret proto‐oncogene (RET) fusion/rearrangements (1.4%), and ROS proto‐oncogene 1 (ROS1) fusion/rearrangements (2%). Other frequent genomic alterations were those involving TP53 (55.9%), KRAS (12.6%), PIK3CA (12.2%), LDL receptor‐related protein 1B (LRP1B) (12.1%), CDKN2A (12.1%), RNA‐binding motif protein 10 (RBM10) (12.1%), and telomerase reverse transcriptase (TERT) (11.3%). To gain unique insights into the mutational processes in Chinese patients with NSCLC, we performed the mutational signature analysis of the somatic mutation data from the OrigiMed cohort, and the overall mutational pattern is shown in Figure S4A. Our analysis identified that aging, BRCA1/2 deficiency, MMR, and smoking signatures were four major mutational signatures in the OrigiMed cohort (Figure S4B).
Genomic alterations that were associated with TMB and expression of PD‐L1 at the univariate level are depicted in Figure 1. Among common actionable mutations, MET actionable alterations (MET amplification and exon 14 skipping) were significantly, positively correlated with TMB (p = 0.029), whereas EGFR actionable mutations (L858R, exon 19 deletion, exon 20 insertion, G719X, L861Q, and T790 M), ALK rearrangements, and ROS1 rearrangements were significantly, negatively correlated with TMB (p < 0.001, p = 0.000018, and p = 0.024, respectively) (Figure 1A). Concomitantly, MET amplification/ex14 skipping and ROS1 rearrangements were significantly, positively correlated with the expression of PD‐L1 (p < 0.001 and p < 0.001, respectively), whereas EGFR actionable mutations were significantly, negatively correlated with the expression of PD‐L1 (p < 0.001) (Figure 1B).
FIGURE 1.
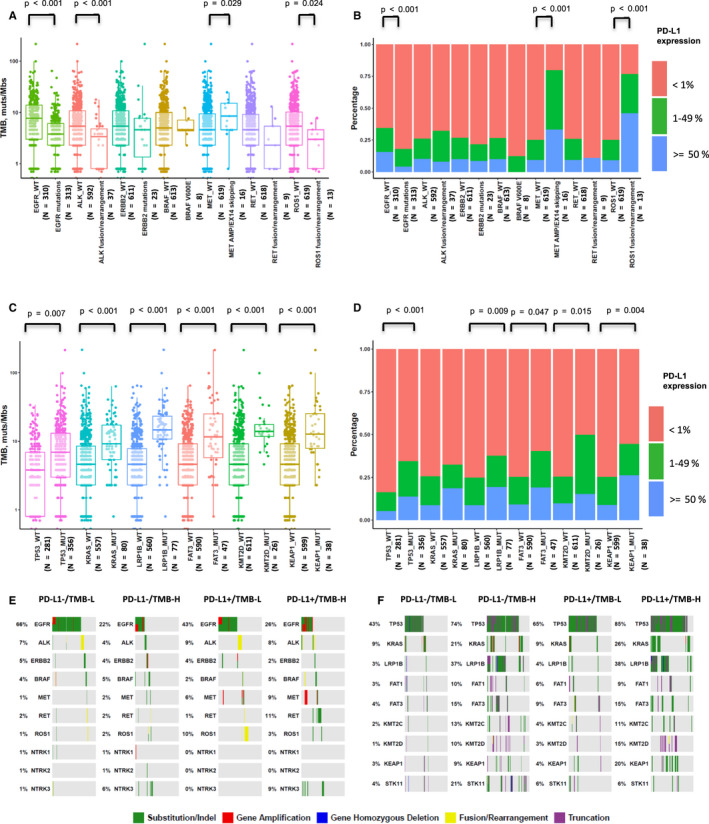
Correlations between expression of PD‐L1, TMB, and gene alterations. (A) Comparison of TMB between actionable‐mutated and wild‐type genes, including EGFR, ALK, ERBB2, BRAF, MET, RET, and ROS1. A box‐and‐whisker plot is used to represent the data. Box plot represents first (lower bound) quartile, median, and third (upper bound) quartile. Whiskers, representing 1.5 times the interquartile range, were used to visualize data for these comparisons. Kruskal–Wallis rank sum tests were used for comparisons of TMB between two groups with or without corresponding genomic alterations. Dots represent individual tumors. (B) Comparison of expression of PD‐L1 between actionable‐mutated and wild‐type genes, including EGFR, ALK, ERBB2, BRAF, MET, RET, and ROS1. Chi‐square tests were used for comparisons of PD‐L1 expression between two groups with or without EGFR genomic alterations. Fisher's exact tests were used for comparisons of PD‐L1 expression between two groups with or without ALK, ERBB2, BRAF, MET, RET, and ROS1 genomic alterations. (C) Comparison of TMB between mutated and wild‐type genes, including TP53, KRAS, LRP1B, FAT3, KMT2D, and KEAP1. (D) Comparison of expression of PD‐L1 between mutated and wild‐type genes, including TP53, KRAS, LRP1B, FAT3, KMT2D, and KEAP1. Chi‐square tests were used for comparisons of PD‐L1 expression between two groups with or without corresponding genomic alterations. (E, F) OncoPrint depicting alterations in preselected genes of interest in groups defined by a composite variable of TMB (stratified above and below 10 muts/Mb) and expression of PD‐L1 (stratified above and below 1% TPS).
In addition, TP53, KRAS, LRP1B, FAT atypical cadherin 3 (FAT3), KMT2D, and kelch like ECH‐associated protein 1 (KEAP1) mutations occurred frequently in patients with NSCLC (Table S3) and were significantly, positively correlated with TMB (p = 0.007, p < 0.001, p < 0.001, p < 0.001, and p < 0.001, respectively), and with the expression of PD‐L1 (p < 0.001, p = 0.009, p = 0.047, p = 0.015, and p = 0.004, respectively) (Figure 1C and 1D).
To further determine whether molecular alterations were associated with the expression of PD‐L1 and TMB, we classified our patients into four categories, based on expression of PD‐L1 (≥1%) and TMB value (≥10 muts/Mb). We investigated the distribution of gene alterations in each category, including that of common actionable mutations and several frequent mutations in NSCLC (Figure 1E and 1F, Tables S2 and S3). Noted, TP53 mutations were enriched in the PD‐L1+/TMB‐H group (Figure 1F), whereas EGFR mutations were enriched in the PD‐L1−/TMB‐L group (Figure 1E). Moreover, ROS1 rearrangements were enriched in the PD‐L1+/TMB‐L group (Figure 1E), whereas STK11 mutations were enriched in the PD‐L1−/TMB‐H group (Figure 1F).
3.3. Correlation between expression oF PD‐L1, TMB, and mutational status of KMT2 family genes
We also evaluated whether mutations in individual altered genes were associated with TMB (stratified as ≥10 muts/Mb vs. <10 muts/Mb) and expression of PD‐L1 (stratified as ≥1% vs. <1%). As shown in Figure S5, LRP1B and TP53 were the most enriched genes in the TMB‐H or PD‐L1+ cohort. Furthermore, KMT2 family genes, such as KMT2A, KMT2C, and KMT2D, were frequently mutated in TMB‐H or PD‐L1+ tumor samples (Figure S5A and S5B). The mutational profile (frequency and composition) of KMT2 family genes (KMT2A [1.3%], KMT2C [5%], and KMT2D [4%]) is shown in Figure S5C. Tumors with KMT2 family gene mutations (KMT2A, KMT2C, and KMT2D) had significantly higher TMB (13.1 vs. 4.6 muts/Mb, p < 0.001), PD‐L1+ proportions (43.3% vs. 24.8%, p = 0.008), and PD‐L1+/TMB‐H proportions (37.7% vs. 8%, p < 0.001) than those without KMT2 family gene mutations (Figure 2A–C). We further tested the association of KMT2 family gene mutations with the clinical outcomes of ICI treatment in the Rizvi cohort. 31 This cohort included 240 patients with NSCLC treated with anti‐PD‐L1 alone or in combination with anti‐cytotoxic T‐cell lymphocyte‐4 (anti‐CTLA‐4) therapeutic scheme. The PFS of 48 patients classified as KMT2 family gene‐MUT was superior to that of the wild‐type KMT2 family gene patients (median, 4.2 [95% CI: 2.57–13] vs. 3.1 [95% CI: 2.57–4.33] months, p = 0.046) (Figure 2D). However, there was no significant difference in the rate of DCB in patients with or without KMT2 family gene mutations (39% vs. 28%, p = 0.2) (Figure 2E).
FIGURE 2.
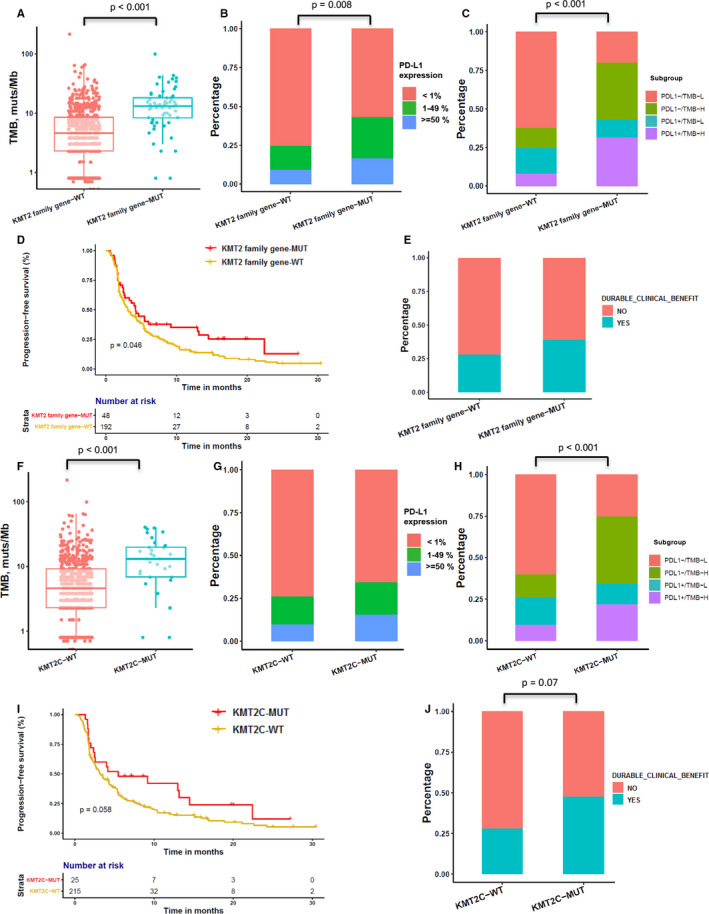
Correlation between KMT2 family gene mutations and PD‐L1, TMB, and clinical response to ICIs. (A) Comparison of TMB among groups classified by KMT2 family gene (KMT2A, KMT2C, and KMT2D) mutational status. A box‐and‐whisker plot is used to represent the data. Box plot represents first (lower bound) quartile, median, and third (upper bound) quartile. Whiskers, representing 1.5 times the interquartile range, were used to visualize data for these comparisons. Kruskal–Wallis rank sum tests were used for comparisons of TMB between two groups with or without KMT2 family gene genomic alterations. Dots represent individual tumors. (B) Comparison of expression of PD‐L1 among groups classified by KMT2 family gene (KMT2A, KMT2C, and KMT2D) mutational status. Chi‐square tests were used for comparisons of PD‐L1 expression between two groups with or without KMT2 family gene genomic alterations. (C) Comparison of distribution of PD‐L1−/TMB‐L, PD‐L1−/TMB‐H, PD‐L1+/TMB‐L, and PD‐L1+/TMB‐H groups among groups classified by KMT2 family gene (KMT2A, KMT2C, and KMT2D) mutational status. Fisher's exact tests were used for comparisons of distribution of four subgroups between two groups with or without KMT2 family gene genomic alterations. (D) Kaplan–Meier survival curves of PFS comparing patients with KMT2 family gene mutations with wild‐type patients, both treated with ICIs. Log‐rank tests were used for comparisons of PFS between two groups with or without KMT2 family gene genomic alterations. (E) Histogram depicting the DCB proportions among patients in groups defined by KMT2 family gene mutation status. Chi‐square tests were used for comparisons of DCB rate between two groups with or without KMT2 family gene genomic alterations. (F) Comparison of TMB among groups classified by KMT2C gene mutational status. (G) Comparison of expression of PD‐L1 among groups classified by KMT2C gene mutational status. Fisher's exact tests were used for comparisons of PD‐L1 expression between two groups with or without KMT2C genomic alterations. (H) Comparison of distribution of PD‐L1−/TMB‐L, PD‐L1−/TMB‐H, PD‐L1+/TMB‐L, and PD‐L1+/TMB‐H groups among those classified by KMT2C gene mutational status. Fisher's exact tests were used for comparisons of distribution of four subgroups between two groups with or without KMT2C genomic alterations. (I) Kaplan–Meier survival curves of PFS comparing patients with KMT2C gene mutations with wild‐type patients, both treated with ICIs. (J) Histogram depicting the DCB proportions among patients in groups defined by KMT2C gene mutation status. Chi‐square tests were used for comparisons of DCB rate between two groups with or without KMT2C genomic alterations.
Tumors with KMT2C mutations had significantly higher TMB and PD‐L1+/TMB‐L proportions compare to KMT2C wild‐type tumors (Figure 2F and 2H), but there was no significant difference in the expression of PD‐L1 between the two groups (Figure 2G). In the Rizvi cohort, the PFS of 25 patients classified as KMT2C‐MUT was superior to that of the KMT2C‐WT patients (median, 5.47 vs. 3.17 months, p = 0.058) (Figure 2I). Due to the small patient number in the KMT2C‐MUT subgroup, the study only showed a trend toward a higher rate of DCB relative to the KMT2C‐WT subgroup (48% vs. 28%, respectively; p = 0.07) (Figure 2J). Although KMT2A and KMT2D mutations correlated with higher TMB and PD‐L1+/TMB‐L proportions (Figure S6A‐F), patients with these mutations did not exhibit improved PFS over wild‐type KMT2A or KMT2D patients (Figure S6G‐H). KMT2C mutations found in patients with NSCLC and in silico mutation prediction analyses performed for the OrigiMed and cBioportal data sets using PolyPhen‐2 are summarized in Tables S4 and S5.
3.4. Relevance of KMT2C/TP53 co‐mutation status to expression of PD‐L1 and TMB as a predictive biomarker
As TP53 was frequently mutated in patients with KMT2C mutations in the OrigiMed (75%) and Rizvi (72%) cohorts, we further confirmed the synergetic effect of epigenetic‐related genes and tumor suppressor gene mutations as predictive biomarkers for cancer immunotherapies. Tumors with KMT2C mutations had significantly higher TMB and PD‐L1+/TMB‐H proportions than KMT2C wild‐type tumors, irrespective of TP53 aberrances (Figure 3A and 3C), but there was no significant difference in the expression levels of PD‐L1 between the four subgroups (Figure 3B). We further tested the association of KMT2C/TP53 co‐mutation status with the clinical outcomes of ICI therapy in the Rizvi cohort. 31
FIGURE 3.
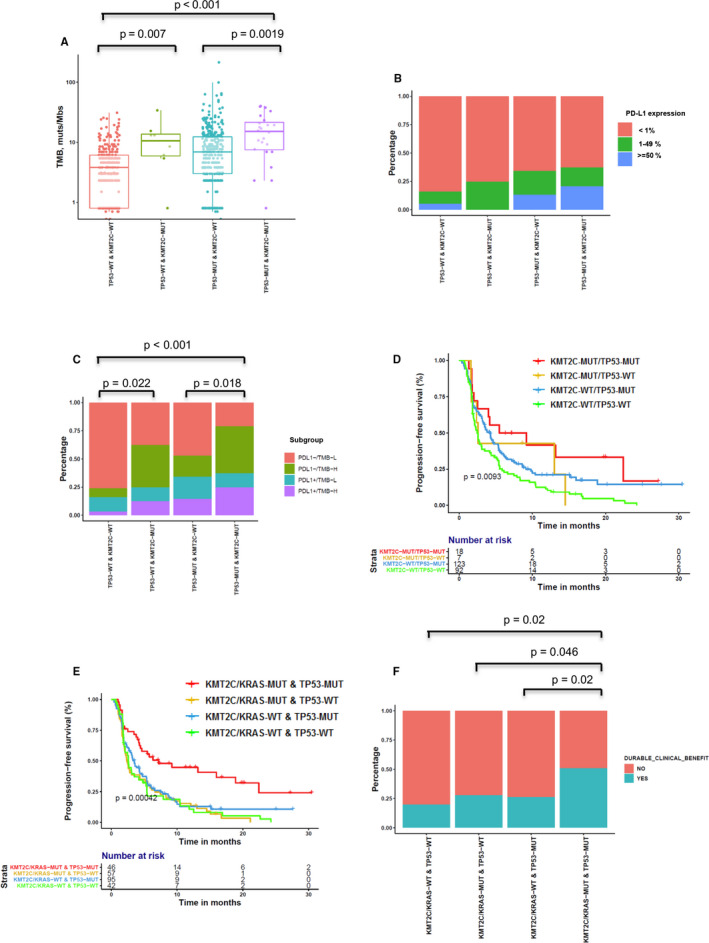
Correlation between KMT2C/TP53 mutation and PD‐L1, TMB, and clinical response to ICIs. (A) Comparison of TMB among groups classified by KMT2C and TP53 mutational status. A box‐and‐whisker plot is used to represent the data. Box plot represents first (lower bound) quartile, median, and third (upper bound) quartile. Whiskers, representing 1.5 times the interquartile range, were used to visualize data for these comparisons. Kruskal–Wallis rank sum tests were used for comparisons of TMB across four groups. Dots represent individual tumors. (B) Comparison of expression of PD‐L1 among groups classified by KMT2C and TP53 mutational status. Fisher's exact tests were used for comparisons of PD‐L1 expression between four groups classified by KMT2C and TP53 mutational status. (C) Comparison of distribution of PD‐L1−/TMB‐L, PD‐L1−/TMB‐H, PD‐L1+/TMB‐L, and PD‐L1+/TMB‐H groups among those classified by KMT2C and TP53 mutational status. Fisher's exact tests were used for comparisons of PD‐L1 expression across four groups. (D) Kaplan–Meier survival curves of PFS comparing patients with TP53 or KMT2C mutations with wild‐type patients, both treated with ICIs. Log‐rank tests were used for comparisons of PFS across four groups. (E) Kaplan–Meier survival curves of PFS comparing patients with TP53/KMT2C/KRAS mutations with wild‐type patients, both treated with ICIs. (F) Histogram depicting the DCB proportions among patients in groups defined by KMT2C, KRAS, and TP53 mutation status. Fisher's exact tests were used for comparisons of DCB rate between four groups classified by KMT2C and TP53 mutational status.
Briefly, 18, 7, 123, and 92 patients were classified as KMT2C/TP53 co‐MUT, TP53‐WT & KMT2C‐MUT, TP53‐MUT & KMT2C‐WT, and KMT2C/TP53 co‐WT subgroups, respectively. Additionally, the corresponding median PFS (95% CI) was 7.33 months (2.5–NA), 2.57 months (1.63–NA), 4.2 months (3.23–5.37), and 2.47 months (2.03–3.5) (KMT2C/TP53 co‐MUT vs. KMT2C/TP53 co‐WT, adjusted HR: 0.48, 95% CI: 0.24–0.94, p = 0.0327; TP53‐MUT & KMT2C‐WT vs. KMT2C/TP53 co‐WT, HR: 0.72, 95% CI: 0.53–0.99, p = 0.049), respectively (Figure 3D and Table 1). Moreover, the KMT2C/TP53 co‐MUT subgroup tended to show a higher rate of DCB relative to the TP53‐WT & KMT2C‐MUT, TP53‐MUT & KMT2C‐WT, and KMT2C/TP53 co‐WT subgroups (50%, 42.8%, 32.1%, and 23.3%, respectively; p = 0.06) (Figure S7A).
TABLE 1.
Univariate and multivariate analyses of clinical parameters and co‐mutation status of KMT2C and TP53 on progression‐free survival.
| Unadjusted HR (95% CI) | p value | Adjusted HR (95% CI) | p value | |
|---|---|---|---|---|
| Gender | ||||
| Female | Reference | Reference | ||
| Male | 1.09 (0.83–1.44) | 0.5420 | 1.13 (0.85–1.51) | 0.4051 |
| Age | 1.00 (0.99–1.01) | 0.9270 | 0.99 (0.98–1.01) | 0.4144 |
| Smoking status | ||||
| Ever | Reference | Reference | ||
| Never | 1.45 (1.03–2.03) | 0.0321 | 1.41 (0.96–2.06) | 0.0795 |
| Treatment type | ||||
| Combination | Reference | Reference | ||
| Monotherapy | 1.87 (1.21–2.87) | 0.0045 | 2.03 (1.30–3.18) | 0.0018 |
| TMB group | ||||
| <10 muts/Mb | Reference | Reference | ||
| >=10 muts/Mb | 0.73 (0.54–0.99) | 0.0454 | 0.98 (0.69–1.40) | 0.9142 |
| Histological type | ||||
| Non‐Squamous | Reference | Reference | ||
| Squamous | 1.02 (0.68–1.53) | 0.9240 | 0.96 (0.63–1.45) | 0.8319 |
| Co‐mutation | ||||
| KMT2C‐WT/TP53‐WT | Reference | Reference | ||
| KMT2C‐MUT/TP53‐WT | 0.72 (0.31–1.65) | 0.4389 | 0.83 (0.36–1.92) | 0.6595 |
| KMT2C‐WT/TP53‐MUT | 0.68 (0.51–0.91) | 0.0092 | 0.72 (0.53–0.99) | 0.0490 |
| KMT2C‐MUT/TP53‐MUT | 0.44 (0.24–0.80) | 0.0076 | 0.48 (0.24–0.94) | 0.0327 |
As we have used PolyPhen‐2 to predict the functional impact of the KMT2C mutation in the OrigiMed and cBioportal data sets (Table S4–S5), We further reassessed the genomic and survival analysis with only potentially damaging KMT2C mutations, the results showed that predicted loss‐of‐function KMT2C mutations were associated with higher TMB but not correlated with PD‐L1 expression (Figure S8A‐S8B) and patients with potentially damaging KMT2C mutations had a trend for better PFS than those KMT2C wild‐type patients (median, 4.08 vs. 3.17 months, p = 0.25), which was consistent with data in Figure 2 (Figure S8C). We further reassessed the association of KMT2C (potentially damaging mutations)/TP53 co‐mutation status with the clinical outcomes of ICI therapy in the Rizvi cohort. Briefly, 15, 5, 123, and 92 patients were classified as KMT2C/TP53 co‐MUT, TP53‐WT & KMT2C‐MUT, TP53‐MUT & KMT2C‐WT, and KMT2C/TP53 co‐WT subgroups, respectively. Additionally, the corresponding median PFS (95% CI) was 4.17 months (2–NA), 2.57 months (2.37–NA), 4.2 months (3.23–5.37), and 2.47 months (2.03–3.5), respectively (Figure S8E). Moreover, the KMT2C/TP53 co‐MUT subgroup tended to show an equal or higher rate of DCB relative to the TP53‐WT & KMT2C‐MUT, TP53‐MUT & KMT2C‐WT, and KMT2C/TP53 co‐WT subgroups (40%, 40%, 32.1%, and 23.3%, respectively; p = 0.3) (Figure S8F).
It is well‐known that the TP53/KRAS co‐mutation could serve as a potential predictive marker in guiding anti‐PD‐1/PD‐L1 immunotherapy in NSCLC. 19 We validated the predictive effect of TP53/KRAS co‐mutation in the Rizvi cohort and found that the PFS of patients with TP53/KRAS co‐mutation was superior to that of TP53‐MUT/KRAS‐WT, TP53‐WT/KRAS‐MUT, and TP53/KRAS co‐WT patients (median PFS: 5.77, 3.6, 2.33, and 2.6 months, respectively, p = 0.006, Figure S7B). Furthermore, we found that TP53/KRAS co‐MUT and TP53/KMT2C co‐MUT patients were two distinct subgroups with little overlap, both in our study and in the Rizvi cohort (Figure S7C). Therefore, we next validated whether TP53 mutation combined with KRAS or KMT2C mutations was a better predictive factor. The median PFS (95% CI) was 7.17 months (4.27–NA), 2.37 months (1.93–4.37), 3.5 months (2.7–4.73), and 2.57 months (1.93–5.27) in the KMT2C/KRAS‐MUT & TP53‐MUT, KMT2C/KRAS‐MUT & TP53‐WT, KMT2C/KRAS‐WT & TP53‐MUT, and KMT2C/KRAS‐WT & TP53‐WT patients, respectively, (KMT2C/KRAS‐MUT & TP53‐MUT vs. KMT2C/KRAS‐WT & TP53‐WT, adjusted HR: 0.46, 95% CI: 0.26–0.81, p = 0.0073) (Figure 3E and Table 2). Furthermore, the KMT2C/KRAS‐MUT & TP53‐MUT subgroup showed a significantly higher DCB than the KMT2C/KRAS‐MUT & TP53‐WT, KMT2C/KRAS‐WT & TP53‐MUT, and KMT2C/KRAS‐WT & TP53‐WT subgroups (51.2%, 28.1%, 26.4%, and 20%, respectively; p = 0.0089) (Figure 3F).
TABLE 2.
Univariate and multivariate analyses of clinical parameters and co‐mutation status of TP53 with KMT2C or KRAS on progression‐free survival
| Unadjusted HR (95% CI) | p value | Adjusted HR (95% CI) | p value | |
|---|---|---|---|---|
| Gender | ||||
| Female | Reference | Reference | ||
| Male | 1.09 (0.83–1.44) | 0.5420 | 1.09 (0.81–1.47) | 0.5495 |
| Age | 1.00 (0.99–1.01) | 0.9270 | 0.99 (0.98–1.01) | 0.3535 |
| Smoking status | ||||
| Ever | Reference | Reference | ||
| Never | 1.45 (1.03–2.03) | 0.0321 | 1.30 (0.86–1.96) | 0.2069 |
| Treatment type | ||||
| Combination | ||||
| Monotherapy | 1.87 (1.21–2.87) | 0.0045 | 1.96 (1.26–3.08) | 0.0031 |
| TMB group | ||||
| <10 muts/Mb | Reference | Reference | ||
| >=10 muts/Mb | 0.73 (0.54–0.99) | 0.0454 | 0.93 (0.66–1.32) | 0.6961 |
| Histological type | ||||
| Non‐Squamous | Reference | Reference | ||
| Squamous | 1.02 (0.68–1.53) | 0.9240 | 0.88 (0.57–1.35) | 0.5494 |
| Co‐mutation status | ||||
| KMT2C/KRAS‐WT & TP53‐WT | Reference | Reference | ||
| KMT2C/KRAS‐MUT & TP53‐WT | 1.03 (0.98–1.54) | 0.9148 | 1.02 (0.64–1.63) | 0.9219 |
| KMT2C/KRAS‐WT & TP53‐MUT | 0.85 (0.58–1.24) | 0.3926 | 0.88 (0.57–1.36) | 0.5655 |
| KMT2C/KRAS‐MUT & TP53‐MUT | 0.41 (0.25–0.67) | 0.0004 | 0.46 (0.26–0.81) | 0.0073 |
4. DISCUSSION
In this study, we systematically integrated comprehensive genomic profiling with the expression of PD‐L1 and TMB to explore the association between gene alterations and biomarkers for ICIs. Our results demonstrated that the status of genomic alterations of several oncogenic driver genes, such as EGFR, ALK, and ROS1, as well as several frequently mutated genes in NSCLC (e.g., TP53), correlated with the expression of PD‐L1 and TMB. In addition, our results indicated that co‐mutations of TP53 and KMT2C associated with higher TMB and could function as potential predictive biomarkers for ICBs. Furthermore, our data demonstrated that co‐mutation of TP53 with KMT2C or KRAS might identify a larger patient population that might benefit from ICBs.
At present, expression of PD‐L1 determined by IHC remains the only validated biomarker that has demonstrated strong correlation with ICI response. However, there is variability in marker staining among the five approved PD‐L1‐detecting antibodies (22C3, 28–8, SP142, SP263, and 73–10). 38 It was also reported that the rate of positive PD‐L1 expression (≥ 50%) in Chinese patients with NSCLC might be different from those in patients of Western countries. 39 In our study, the proportions of patients with PD‐L1 < 1%, 1–49%, and ≥50% were 76.7%, 14.8%, and 8.5%, respectively, similar to a report from a Chinese population study, where patients with PD‐L1 < 1% accounted for 79% and patients with PD‐L1 ≥ 50% accounted for only 7.6% of lung adenocarcinoma patients. 40 In addition, previous reports of the relationship between PD‐L1 and TMB have been conflicting, with some studies reporting no correlation, 31 , 41 but several recent studies reporting a small but positive association between PD‐L1 and TMB in NSCLC and other cancer types. 42 , 43 , 44 Yarchoan M et al. examined 9887 individual specimens and found that there was a small but positive association between PD‐L1 expression and TMB (Pearson's coefficient 0.084, p < 10–16). 42 Rizvi et al. also reported that across 1023 NSCLC specimens examined by MSK‐IMPACT and PD‐L1 testing, there was a minor correlation between PD‐L1 and TMB (Spearman rho =0.195). 44 In addition, Lamberti et al. suggested that across 421 NSCLC specimens with PD‐L1 TPS ≥90% (N = 133) or <1% (N = 288), examined using NGS, high PD‐L1 expression in NSCLC was associated with high TMB (p < 0.001). 45 In our study, there was a minor but positive association between PD‐L1 expression and TMB (Kendall's coefficient 0.179, p < 0.001). In conclusion, consistent with previous studies, TMB and PD‐L1 expression are weakly but significantly correlated (p < 0.05); therefore, TMB‐H and PD‐L1‐High can be considered independent populations in NSCLC. There are several reasons that may explain the discrepancies between the study results: 1. Studies reporting no correlation between PD‐L1 and TMB included patients treated in clinical trials, which had limited sample sizes and representativeness, while studies reporting a small but positive association between PD‐L1 and TMB had larger sample sizes. 2. Different anti‐PD‐L1 monoclonal antibodies including 22C3, 28–8, E1L3 N, and others were used across these studies, which might contribute to the discrepancy. 3. Different TMB assessment methods were applied across these studies including whole‐exome sequencing (WES), MSK‐IMPACT, and FoundationOne, which also might contribute to the discrepancy.
Noted, EGFR is the most common oncogenic driver gene among Chinese patients with NSCLC and its mutation frequency in Chinese patients (~50%) is significantly higher than that in Western patients. 40 Both EGFR mutations and ALK rearrangements have been suggested to be associated with lower expression of PD‐L1, 16 lower TMB, and lower overall response rate to ICIs. 40 Consistent with previous reports, our study data showed that EGFR actionable mutations were negatively associated with TMB, expression of PD‐L1 (Figure 1A and 1B), and clinical outcomes to ICI therapy (Figure S7D); ALK rearrangements were significantly correlated with lower TMB, but had no significant relationship with the expression of PD‐L1 and clinical ICI outcomes due to the small sample size (data not shown). Therefore, patients with EGFR mutations and ALK rearrangements were excluded in most immunotherapy trials. However, the results of the ATLANTIC study (n = 444) demonstrated that high PD‐L1‐expressing (≥ 25%) and EGFR/ALK mutation‐positive advanced NSCLC patients might have greater benefit from ICI treatment with durable efficacy and a promising effect on OS than patients with PD‐L1 expression <25% and EGFR/ALK mutation (median OS: 13.3 vs. 9.9 months). 46 Recently, Mazieres J et al. reported that the anti‐tumor activity of ICIs in advanced NSCLC with oncogenic driver alteration was lower in the patients with an EGFR/ALK alteration than those with a KRAS alteration. The objective response rate to ICIs was 12% in patients with EGFR alterations and 0% in patients with ALK rearrangements. In addition, PFS was significantly different across EGFR mutational subtypes with a T790 M, exon 19, exon 21, and other mutational subtypes having PFS of 1.4, 1.8, 2.5, and 2.8 months, respectively (p < 0.001). 47 Consistently, data from the Rizvi cohort showed that patients with uncommon EGFR mutations had worse PFS than patients with wild‐type and EGFR‐sensitizing mutations (Figure S7E). These findings suggested that some subtypes of driver genes are correlated with ICI treatment outcomes.
Besides driver genes, epigenetic alterations (involving DNA methylation and histone modifications) play pivotal roles in tumor initiation, progression, metastasis, and immune evasion in lung cancers, making them also viable targets for therapy. 48 Aberrant promoter methylation of genes, such as CDKN2A, mutL homolog 1 (MLH1), mutS homolog 2 (MSH2), APC regulator of Wnt signaling pathway (APC), retinoic acid receptor beta (RARB), and O‐6‐methylguanine‐DNA methyltransferase (MGMT) has been described in lung cancer. 49 Furthermore, different chromatin modifications can be used as prognostic markers. For example, globally elevated H3 and H4 methylation was shown to be associated with poor prognosis, whereas high dimethyl H3 K4 levels appeared to confer a better prognosis. 50 Histone methylation marks are deposited by KMTs, which can be divided into non‐SET and SET domain‐containing KMTs (e.g., KMT2A‐D, SET1A/B, and SET7/9). For instance, KMT2C (also known as MLL3) belongs to the mixed‐lineage leukemia (MLL) family of histone methyltransferases, which mono‐methylate H3 K4 at enhancers as part of the complex proteins associated with the Set1 (COMPASS) complex. 51 Accordingly, KMT2C has been reported as a tumor repressor frequently altered in several types of cancers, including myeloid leukemia, colorectal cancer, medulloblastoma, pancreatic ductal adenocarcinoma, glioblastoma, and lung adenocarcinoma. 28 Furthermore, a recent study demonstrated that downregulation of KMT2C compromised the homologous recombination‐mediated double‐strand break DNA repair function in several cancer types, including NSCLC. This induced substantially higher genomic instability which was linked to higher TMB and sensitizing cancer cells to ICIs. 27 , 52 These findings suggested that aberrant genomic alterations of KMT2C could pose as a potential target for lung cancer therapy. In this study, we found that patients with KMT2C mutations exhibited a higher TMB and longer PFS with ICI treatments than did those with wild‐type KMT2C (Figure 2F and 2I). Additionally, we ran an in silico mutation prediction analyses using PolyPhen‐2 to predict the functional impact of KMT2C mutations and listed the functional information of KMT2C mutations from the OrigiMed and cBioportal data sets in Tables S4 and S5. Then, we reassessed the survival and genomic analysis with only potentially damaging KMT2C mutations and the results showed that the predicted loss‐of‐function KMT2C mutations were associated with higher TMB but not correlated with PD‐L1 expression; patients with potentially damaging KMT2C mutations had a trend for better PFS than those with KMT2C‐WT (median, 4.08 vs. 3.17 months, p = 0.25), which is consistent with the data in Figure 2 (Figure S8).
A previous report indicated that oncogenic driver genes can modulate tumor immune microenvironment, especially in NSCLC. 53 Nevertheless, single gene alterations, such as TP53, might be positively associated with PD‐L1 expression and immune‐related genes expression, but single gene alteration alone was not able to distinguish responders from receiving ICI treatments in NSCLC; however, patients with TP53/KRAS co‐mutations were reported to be sensitive to ICI treatments, suggesting the necessity for implementation of a model combining multiple genes. 19 Recently, a STK11/LKB1 co‐mutation in KRAS‐mutant NSCLC was reported as a new predictive marker for tumor resistance to ICI therapy. A KRAS/STK11 co‐alteration was correlated with significantly shorter PFS after ICI treatments compared with KRAS alteration alone (PFS HR, 1.98; p < 0.001) or a KRAS/TP53 co‐alteration (PFS HR, 1.77; p = 0.0072). 54 Another study reported that a KRAS/KEAP1 co‐alteration is an independent prognostic factor, predicting inferior survival (HR, 1.96; 95% CI, 1.33–2.92; p < 0.001), duration of response to initial platinum‐based chemotherapy (HR, 1.64; 95% CI, 1.04–2.59; p = 0.03), and OS from the start of immunotherapy (HR, 3.54; 95% CI, 1.55–8.11; p = 0.003). 55 In our study, KMT2C and TP53 co‐mutation could serve as a better biomarker for predicting the PFS and DCB of ICI therapy than KMT2C mutations alone, whereas KMT2A or KMT2D with TP53 co‐mutations might not distinguish patients potentially benefiting from ICI treatments (Figure S6I and S6J). Similarly, another study reported increased sensitivity to PD‐1 blockade in patients with TP53 and KRAS mutations. However, not all patients with TP53‐ or KRAS‐mutated tumors or both responded to this treatment. Furthermore, our data showed that KMT2C‐MUT/TP53‐MUT and KRAS‐MUT/TP53‐MUT patients comprised two distinct populations with little overlap (Figure S7C). Therefore, KRAS was recruited into our biomarker combination and patients with co‐occurring mutations of TP53 and KMT2C or KRAS showed remarkable clinical benefit from ICI treatments (Figure 3E‐F and Table 2).
It is a well‐accepted tendency that a combination of biomarkers for each process could provide complementary information affording greater accuracy in the prediction of immunotherapeutic benefit. Recent work has demonstrated that combination of TMB with GEP, a T‐cell–inflamed gene expression profile, can jointly predict clinical responses to pembrolizumab in pan‐tumor types and identify patterns of underlying, targetable biology related to these groups. 56 Accordingly, we discovered that KMT2C/TP53 co‐mutation and PD‐L1 could function as independent predictors (Figure 3B) demonstrating low correlation, and as expected, they might exhibit joint predictive power in stratifying responders from non‐responders. Since PD‐L1 protein expression assay has been developed for clinical use, apart from being rational, implementation of our model in clinical utility is feasible and also quite promising, as it only includes a small panel of two genes.
The main limitation of our study is that these findings originated from a retrospective profiling analysis and were not able to be validated in Chinese NSCLC ICI‐treated cohorts. Although our findings were validated by the Rizvi cohort derived from cBioPortal, the sample size of this cohort was relatively small (patients with KMT2C and TP53 co‐mutation were even fewer) and it lacked information about important confounding factors such as performance status and presence of distant metastases in the viscera, brain, or bones. Based on this preliminary evidence, a future prospective, multicenter study for ICI response with larger sample sizes of KMT2C/TP53 mutations, TMB, PD‐L1 expression, and TILs is warranted. Second, as ICI therapies together with chemotherapy are currently the first‐line standard treatment schemes for most patients, we regret that we do not have access to clinical outcome parameters of patients treated with chemo‐immuno‐therapies. As such, the predictive effect of KMT2C/TP53 co‐mutation for chemo‐immuno‐therapies could not be validated in our study and we hope to investigate this in the future.
In conclusion, to the best of our knowledge, this is the largest analysis of Chinese NSCLC genomic profiling that integrates the expression of PD‐L1 and TMB. Our findings provide insight into the immune modulation controlled by certain driver genes, tumor suppressor genes, and epigenetic genes in NSCLC. Ultimately, our study demonstrated that KMT2C/TP53 co‐mutation might be a potential biomarker to predict responses to PD‐1 blockade therapy in patients with NSCLC, and that adding KRAS to the biomarker combination might create a more robust parameter to identify the best responders to ICI therapy. Our study might increase knowledge toward further individualization of therapeutic decisions based on genetic biomarker information and is simple to implement in the real‐world setting. Ongoing intense work is attempting to further validate our model in large cohorts, and prospective clinical trials, especially in regard to chemo‐immunotherapy treatments.
5. COMPETING INTERESTS
The authors declare that they have no competing interests.
ETHICS APPROVAL
This study was approved by the Institution Review Board of the First Hospital of Kunming Medical University and Guangdong Provincial People's Hospital, according to the Declaration of Helsinki. Informed consent was obtained from all enrolled patients.
CONSENT FOR PUBLICATION
Not applicable.
Supporting information
Fig S1‐S8
Table S1‐S5
ACKNOWLEDGMENTS
The authors thank Honglin Guo and Shaohua Yuan for the help with data and statistical analysis.
Yunfei Shi and Youming Lei contributed equally to this work.
Funding information
The study was supported by the National Key R&D Program of China (Grant No.2016YFC1303800), Doctoral Research Fund of the first affiliated Hospital of Kunming Medical University (Grant No. 2017BS029), and the Scientific Research Projects of Institutions of Medical and Health Institutions in Yunnan Province (Grant No. 2016NS017).
DATA AVAILABILITY STATEMENT
The datasets used and/or analyzed during the current study are available from the corresponding author on reasonable request.
REFERENCES
- 1. Chen W, Zheng R, Baade PD, et al. Cancer statistics in China, 2015. CA Cancer J Clin. 2016;66(2):115‐132. [DOI] [PubMed] [Google Scholar]
- 2. Anagnostou VK, Brahmer JR. Cancer immunotherapy: a future paradigm shift in the treatment of non‐small cell lung cancer. Clin Cancer Res. 2015;21(5):976‐984. [DOI] [PubMed] [Google Scholar]
- 3. Mok TSK, Yi‐Long W, Kudaba I, et al. Pembrolizumab versus chemotherapy for previously untreated, PD‐L1‐expressing, locally advanced or metastatic non‐small‐cell lung cancer (KEYNOTE‐042): a randomised, open‐label, controlled, phase 3 trial. Lancet. 2019;393:1819‐1830. [DOI] [PubMed] [Google Scholar]
- 4. Shukuya T, Carbone DP. Predictive markers for the efficacy of anti‐PD‐1/PD‐L1 antibodies in lung cancer. J Thorac Oncol. 2016;11(7):976‐988. [DOI] [PMC free article] [PubMed] [Google Scholar]
- 5. Rosenbaum M, Khosrowjerdi S, Kamesan V, Digumarthy S. The utility of PD‐L1/CD8 dual immunohistochemistry for prediction of response to immunotherapy in non‐small cell lung cancer (NSCLC). J Thorac Oncol. 2018;13(10): S533. [Google Scholar]
- 6. Samstein RM,Lee C‐H, Shoushtari AN, et al. Tumor mutational load predicts survival after immunotherapy across multiple cancer types. Nat Genet. 2019;51:202‐206. [DOI] [PMC free article] [PubMed] [Google Scholar]
- 7. Singal G, Miller PG, Agarwala V, et al. Association of patient characteristics and tumor genomics with clinical outcomes among patients with non–small cell lung cancer using a clinicogenomic database. JAMA. 2019;321(14):1391‐1399. [DOI] [PMC free article] [PubMed] [Google Scholar]
- 8. Vanderwalde A, Spetzler D, Xiao N, et al. Microsatellite instability status determined by next‐generation sequencing and compared with PD‐L1 and tumor mutational burden in 11,348 patients. Cancer Med. 2018;7(3):746‐756. [DOI] [PMC free article] [PubMed] [Google Scholar]
- 9. Cristescu R, Mogg R, Ayers M, et al. Pan‐tumor genomic biomarkers for PD‐1 checkpoint blockade–based immunotherapy. Science. 2018;362(6411):eaar3593. [DOI] [PMC free article] [PubMed] [Google Scholar]
- 10. Grigg C, Rizvi NA. PD‐L1 biomarker testing for non‐small cell lung cancer: truth or fiction? J Immunother Cancer. 2016;4:48. [DOI] [PMC free article] [PubMed] [Google Scholar]
- 11. Sullivan K, Preeshagul I, Budman D, et al. Immune checkpoint inhibitors in lung cancer: an update. Future Oncol. 2017;13(11):955‐959. [DOI] [PubMed] [Google Scholar]
- 12. Gibney GT, Weiner LM, Atkins MB. Predictive biomarkers for checkpoint inhibitor‐based immunotherapy. Lancet Oncol. 2016;17(12):e542‐e551. [DOI] [PMC free article] [PubMed] [Google Scholar]
- 13. Miura Y, Sunaga N. Role of immunotherapy for oncogene‐driven non‐small cell lung cancer. Cancers (Basel). 2018;10(8):245. [DOI] [PMC free article] [PubMed] [Google Scholar]
- 14. Gainor JF, Shaw AT, Sequist LV, et al. EGFR mutations and ALK rearrangements are associated with low response rates to PD‐1 pathway blockade in non‐small cell lung cancer: a retrospective analysis. Clin Cancer Res. 2016;22(18):4585‐4593. [DOI] [PMC free article] [PubMed] [Google Scholar]
- 15. Lee CK, Man J, Lord S, et al. Clinical and molecular characteristics associated with survival among patients treated with checkpoint inhibitors for advanced non–small cell lung carcinoma: a systematic review and meta‐analysis. JAMA oncol. 2018;4(2):210‐216. [DOI] [PMC free article] [PubMed] [Google Scholar]
- 16. Liu S‐Y, Dong Z‐Y, Wu S‐P, et al. Clinical relevance of PD‐L1 expression and CD8+ T cells infiltration in patients with EGFR‐mutated and ALK‐rearranged lung cancer. Lung Cancer. 2018;125:86‐92. [DOI] [PubMed] [Google Scholar]
- 17. Wang Z, Zhao J, Wang G, et al. Comutations in DNA damage response pathways serve as potential biomarkers for immune checkpoint blockade. Can Res. 2018;78(22):6486‐6496. [DOI] [PubMed] [Google Scholar]
- 18. Mouw KW, Goldberg MS, Konstantinopoulos PA, et al. DNA damage and repair biomarkers of immunotherapy response. Cancer Discov. 2017;7(7):675‐693. [DOI] [PMC free article] [PubMed] [Google Scholar]
- 19. Dong Z‐Y, Zhong W‐Z, Zhang X‐C, et al. Potential predictive value of TP53 and KRAS mutation status for response to PD‐1 blockade immunotherapy in lung adenocarcinoma. Clin Cancer Res. 2017;23(12):3012‐3024. [DOI] [PubMed] [Google Scholar]
- 20. Skoulidis F, Goldberg ME, Greenawalt DM, et al. STK11/LKB1 mutations and PD‐1 inhibitor resistance in KRAS‐mutant lung adenocarcinoma. Cancer Discov. 2018;8(7):822‐835. [DOI] [PMC free article] [PubMed] [Google Scholar]
- 21. Chen YU, Chen G, Li J, et al. Association of tumor protein p53 and ataxia‐telangiectasia mutated comutation with response to immune checkpoint inhibitors and mortality in patients with non‐small cell lung cancer. JAMA Netw Open. 2019;2(9):e1911895. [DOI] [PMC free article] [PubMed] [Google Scholar]
- 22. Chiappinelli KB, Zahnow CA, Ahuja N, et al. Combining epigenetic and immunotherapy to combat cancer. Can Res. 2016;76(7):1683‐1689. [DOI] [PMC free article] [PubMed] [Google Scholar]
- 23. Duruisseaux M, Martínez‐Cardús A, Calleja‐Cervantes ME, et al. Epigenetic prediction of response to anti‐PD‐1 treatment in non‐small‐cell lung cancer: a multicentre, retrospective analysis. Lancet Respir Med. 2018;6(10):771‐781. [DOI] [PubMed] [Google Scholar]
- 24. Rao RC, Dou Y. Hijacked in cancer: the KMT2 (MLL) family of methyltransferases. Nat Rev Cancer. 2015;15(6):334‐346. [DOI] [PMC free article] [PubMed] [Google Scholar]
- 25. Ding LI, Getz G, Wheeler DA, et al. Somatic mutations affect key pathways in lung adenocarcinoma. Nature. 2008;455(7216):1069‐1075. [DOI] [PMC free article] [PubMed] [Google Scholar]
- 26. Cancer Genome Atlas Network . Comprehensive molecular characterization of human colon and rectal cancer. Nature. 2012;487(7407):330‐337. [DOI] [PMC free article] [PubMed] [Google Scholar]
- 27. Rampias T, Karagiannis D, Avgeris M, et al. The lysine‐specific methyltransferase KMT2C/MLL3 regulates DNA repair components in cancer. EMBO Rep. 2019;20(3):e46821. [DOI] [PMC free article] [PubMed] [Google Scholar]
- 28. Yang BO, Li J, Li F, et al. Comprehensive analysis of age‐related somatic mutation profiles in Chinese young lung adenocarcinoma patients. Cancer Med. 2019;8(4):1350‐1358. [DOI] [PMC free article] [PubMed] [Google Scholar]
- 29. Gao J, Aksoy BA, Dogrusoz U, et al. Integrative analysis of complex cancer genomics and clinical profiles using the cBioPortal. Sci Signal. 2013;6(269):pl1. [DOI] [PMC free article] [PubMed] [Google Scholar]
- 30. Cerami E,Gao J, Dogrusoz U, et al. The cBio cancer genomics portal: an open platform for exploring multidimensional cancer genomics data. Cancer Discov. 2012;2(5):401‐404. [DOI] [PMC free article] [PubMed] [Google Scholar]
- 31. Rizvi H, Sanchez‐Vega F, La K, et al. Molecular determinants of response to anti‐programmed cell death (PD)‐1 and anti‐programmed death‐ligand 1 (PD‐L1) blockade in patients with non‐small‐cell lung cancer profiled with targeted next‐generation sequencing. J Clin Oncol. 2018;36(7):633‐641. [DOI] [PMC free article] [PubMed] [Google Scholar]
- 32. Cao J, Chen L, Li H, et al. An accurate and comprehensive clinical sequencing assay for cancer targeted and immunotherapies. Oncologist. 2019;24(12):e1294‐e1302. [DOI] [PMC free article] [PubMed] [Google Scholar]
- 33. Tang B, Yan X, Sheng X, et al. Safety and clinical activity with an anti‐PD‐1 antibody JS001 in advanced melanoma or urologic cancer patients. J Hematol Oncol. 2019;12(1):7. [DOI] [PMC free article] [PubMed] [Google Scholar]
- 34. Hellmann MD, Ciuleanu T‐E, Pluzanski A, et al. Nivolumab plus ipilimumab in lung cancer with a high tumor mutational burden. N Engl J Med. 2018;378(22):2093‐2104. [DOI] [PMC free article] [PubMed] [Google Scholar]
- 35. Gehring JS, Fischer B, Lawrence M, Huber W. SomaticSignatures: inferring mutational signatures from single‐nucleotide variants. Bioinformatics. 2015;31(22):3673‐3675. [DOI] [PMC free article] [PubMed] [Google Scholar]
- 36. Rosenthal R, McGranahan N, Herrero J, et al. deconstructSigs: delineating mutational processes in single tumors distinguishes DNA repair deficiencies and patterns of carcinoma evolution. Genome Biol. 2016;17(1):1‐11. [DOI] [PMC free article] [PubMed] [Google Scholar]
- 37. Xu X, Yang Y, Liu X, et al. NFE2L2/KEAP1 mutations correlate with higher tumor mutational burden value/PD‐L1 expression and potentiate improved clinical outcome with immunotherapy. Oncologist. 2020;25(6):e955‐e963. [DOI] [PMC free article] [PubMed] [Google Scholar]
- 38. Tsao MS, Kerr KM, Kockx M, et al. PD‐L1 Immunohistochemistry comparability study in real‐life clinical samples: results of blueprint phase 2 project. J Thorac Oncol. 2018;13(9):1302‐1311. [DOI] [PMC free article] [PubMed] [Google Scholar]
- 39. Aggarwal C, Abreu DR, Felip E, et al. Prevalence of PD‐L1 expression in patients with non‐small cell lung cancer screened for enrollment in, KEYNOTE‐001,‐010. Ann Oncol. 2016;27(6):359‐378.26658890 [Google Scholar]
- 40. Lu S, Yu Y, Yang Y. Retrospect and prospect for lung cancer in China: clinical advances of immune checkpoint inhibitors. Oncologist. 2019;24(Suppl 1):S21‐S30. [DOI] [PMC free article] [PubMed] [Google Scholar]
- 41. Hellmann MD, Nathanson T, Rizvi H, et al. Genomic features of response to combination immunotherapy in patients with advanced non‐small‐cell lung cancer. Cancer Cell. 2018;33(5):843‐852 e4. [DOI] [PMC free article] [PubMed] [Google Scholar]
- 42. Yarchoan M, Albacker LA , Hopkins AC, et al. PD‐L1 expression and tumor mutational burden are independent biomarkers in most cancers. JCI insight. 2019;4(6):e126908. [DOI] [PMC free article] [PubMed] [Google Scholar]
- 43. Lamberti G, Li Y, Spurr L, et al. P2. 04–32 Comparison of Clinicopathological and Genomic Characteristics Between NSCLCs with a PD‐L1 Tumor Proportion Score of≥90% vs<1%. J Thorac Oncol. 2019;14(10):S720‐S721. [Google Scholar]
- 44. Rizvi H,Bandlamudi C, Schoenfeld AJ, et al. Molecular correlates of PD‐L1 expression in patients with non‐small cell lung cancer. Am Society of Clin Oncol; 2019. [Google Scholar]
- 45. Lamberti G, Spurr LF, Li Y, et al. Clinicopathological and genomic correlates of programmed cell death ligand 1 (PD‐L1) expression in nonsquamous non‐small‐cell lung cancer. Ann Oncol. 2020;31:807–814. [DOI] [PubMed] [Google Scholar]
- 46. Garassino MC, Cho B‐C, Kim J‐H, et al. Durvalumab as third‐line or later treatment for advanced non‐small‐cell lung cancer (ATLANTIC): an open‐label, single‐arm, phase 2 study. Lancet Oncol. 2018;19(4):521‐536. [DOI] [PMC free article] [PubMed] [Google Scholar]
- 47. Mazieres J, Drilon A, Lusque A, et al. Immune checkpoint inhibitors for patients with advanced lung cancer and oncogenic driver alterations: results from the IMMUNOTARGET registry. Ann Oncol. 2019;30(8):1321‐1328. [DOI] [PMC free article] [PubMed] [Google Scholar]
- 48. Ahmad A. Epigenetics in personalized management of lung cancer. Lung Cancer and Personalized Medicine: Novel Therapies and Clinical Management. Springer; 2016:111‐122. [DOI] [PubMed] [Google Scholar]
- 49. Schiffmann I, Greve G, Jung M, Lübbert M. Epigenetic therapy approaches in non‐small cell lung cancer: update and perspectives. Epigenetics. 2016;11(12):858‐870. [DOI] [PMC free article] [PubMed] [Google Scholar]
- 50. Barlési F, Giaccone G, Gallegos‐Ruiz MI, et al. Global histone modifications predict prognosis of resected non small‐cell lung cancer. J Clin Oncol. 2007;25(28):4358‐4364. [DOI] [PubMed] [Google Scholar]
- 51. Ford DJ, Dingwall AK. The cancer COMPASS: navigating the functions of MLL complexes in cancer. Cancer Genet. 2015;208(5):178‐191. [DOI] [PubMed] [Google Scholar]
- 52. Chae YK, Anker JF, Oh MS, et al. Mutations in DNA repair genes are associated with increased neoantigen burden and a distinct immunophenotype in lung squamous cell carcinoma. Sci Rep. 2019;9(1):3235. [DOI] [PMC free article] [PubMed] [Google Scholar]
- 53. Akbay EA, Koyama S, Carretero J, et al. Activation of the PD‐1 pathway contributes to immune escape in EGFR‐driven lung tumors. Cancer Discov. 2013;3(12):1355‐1363. [DOI] [PMC free article] [PubMed] [Google Scholar]
- 54. Skoulidis F, et al. STK11/LKB1 mutations and PD‐1 inhibitor resistance in KRAS‐mutant lung adenocarcinoma. Cancer Discov. 2018;8(7):822‐835. [DOI] [PMC free article] [PubMed] [Google Scholar]
- 55. Papillon‐Cavanagh S, et al. STK11 and KEAP1 mutations as prognostic biomarkers in an observational real‐world lung adenocarcinoma cohort. ESMO open. 2020;5(2):e000706. [DOI] [PMC free article] [PubMed] [Google Scholar]
- 56. Ott PA, Bang Y‐J, Piha‐Paul SA, et al. T‐cell‐inflamed gene‐expression profile, programmed death ligand 1 expression, and tumor mutational burden predict efficacy in patients treated with pembrolizumab across 20 cancers: KEYNOTE‐028. J Clin Oncol. 2019;37(4):318‐327. [DOI] [PubMed] [Google Scholar]
Associated Data
This section collects any data citations, data availability statements, or supplementary materials included in this article.
Supplementary Materials
Fig S1‐S8
Table S1‐S5
Data Availability Statement
The datasets used and/or analyzed during the current study are available from the corresponding author on reasonable request.