Abstract
On 30 October 2020, a strong normal-faulting earthquake struck Samos Island in Greece and İzmir Province in Turkey, both in the eastern Aegean Sea. The earthquake generated a tsunami that hit the coasts of Samos Island, Greece and İzmir, Turkey. National teams performed two post-tsunami field surveys on 31 October to 1 November 2020, and 4–6 November 2020, along the Turkish coastline; while the former was a quick survey on the days following the tsunami, the latter involved more detailed measurement and investigation focusing on a ~ 110-km-long coastline extending from Alaçatı (Çeşme District of İzmir) to Gümüldür (Menderes District of İzmir). The survey teams measured runup and tsunami heights, flow depths, and inundation distances at more than 120 points at eight different localities. The largest tsunami runup among the surveyed locations was measured as 3.8 m in Akarca at a distance of 91 m from the shoreline. The maximum tsunami height of 2.3 m (with a flow depth of 1.4 m) was observed at Kaleiçi region in Sığacık, where the most severe tsunami damage was observed. There, the maximum runup height was measured as 1.9 m at the northeastern side of the bay. The survey team also investigated tsunami damage to coastal structures, noticing a gradual decrease in the impact from Gümüldür to further southeast. The findings of this field survey provide insights into the coastal impact of local tsunamis in the Aegean Sea.
Keywords: Tsunami, post-tsunami survey, runup, tsunami height, flow depth, inundation, coastal damage, Samos, Sığacık, Seferihisar, Aegean Sea
Introduction
Mediterranean communities tend to settle in low-lying coastal zones, prone to marine hazards, including tsunamis. This rapid demographic growth, often accompanied by extensive economic activities, drastically increases the coastal community’s exposure to tsunamis. In the Aegean Sea, the densely populated coastal areas have been exposed to several tsunamis in the past, some being devastating (Altınok and Ersoy 2000; Altınok et al. 2011; Ambraseys 1962; Ambraseys and Synolakis 2010; Dominey-Howes 2002; Galanopoulos 1960; Kuran and Yalciner 1993; Minoura et al. 2000; Papadopoulos and Chalkis 1984; Papadopoulos et al. 2014; Tinti et al. 2001). The most well-known tsunami in the region is the 1956 Amorgos event (Mw 7.8) that caused runup heights up to 25 m (Beisel et al. 2009; Okal et al. 2009; Papadopoulos and Pavlides 1992; Papazachos et al. 1985; Yalciner et al. 1995). More recently, the eastern Aegean Sea was the place of two tsunamis that followed Mw 6.3 and 6.6 magnitude earthquakes in June and July 2017, respectively. Both the 12 June 2017 Lesvos and the 21 July 2017 Bodrum–Kos events brought to the fore the tsunami threat from moderate magnitude earthquakes in the region, serving as reminders to the coastal communities. The latter event caused a significant impact on the southern coast of Bodrum Peninsula in Turkey and Kos Port in Kos Island in Greece (Dogan et al. 2019).
İzmir Metropolitan City, located at the western extremity of Turkey, has a ~ 629-km-long coastline in the eastern Aegean Sea and is the third largest city in the country in terms of population, industrial density, capacity, and contribution to the national economy, following İstanbul and Ankara. Here, tsunamis were documented in the past after the earthquakes of 20 March 1389 in Chios, Greece, 10 July 1688 in İzmir Bay, Turkey, and 12 May and 8 September 1852 in İzmir (Altınok and Ersoy 2000; Altınok et al. 2011). Specifically, the 3 April 1881 Chios earthquake (Mw 6.5) generated a tsunami affecting the Çeşme coast with a Medvedev–Sponheuer–Karnik (MSK) (Sponheuer and Karnik 1964) intensity Io = 9 in some residential areas (Altınok et al. 2005).
On 30 October 2020, a strong normal-faulting earthquake (Mw 6.6, AFAD 2020) struck Samos Island in Greece and İzmir Province in Turkey in the eastern Aegean. The tsunami that followed the earthquake caused significant damage in Çeşme and Seferihisar Districts of İzmir and Samos Island coasts, and resulted in one casualty and several injured people from the tsunami on the Turkish side (Anadolu Agency 2020). Kandilli Observatory and Earthquake Research Institute (KOERI), Turkey’s national tsunami warning center and tsunami service provider for the North-Eastern Atlantic, the Mediterranean and Connected Seas Tsunami Warning System (NEAMTWS), issued a tsunami warning 11 min after the main event.
We present the results from the two field surveys conducted by national teams along the Aegean coast of Turkey to collect the tsunami data following the 30 October 2020 Samos–İzmir event. Our results include flow depth, runup and inundation measurements, arrival time, and coastal damage observations. Furthermore, we discuss the survey findings to better understand the tsunami behavior and its effects on the nearby coastal areas.
Seismotectonics
The eastern Aegean Sea region is characterized predominantly by dip-slip extensional tectonics (Aktar et al. 2007; Jackson 1994; Taymaz et al. 1991). It includes E–W trending faults by the areas extending in N–S direction and exhibits dextral (right-lateral) or sinistral (left-lateral) components (Dewey and Şengör 1979; Jackson and McKenzie 1988; Taymaz et al. 1991; Papazachos et al. 1998; Bozkurt 2003; Emre et al. 2011; Tan et al. 2014; Tepe and Sözbilir 2017). Therefore, the tsunami threat in the study area is mainly associated with dominant normal faults that reveal a high potential risk for coastal areas.
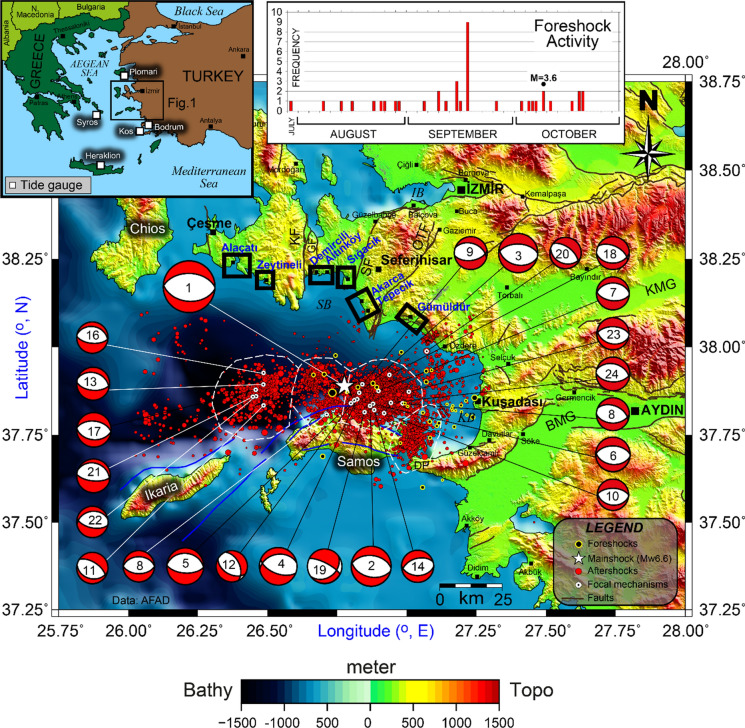
On 30 October 2020, 12:51 UTC (14:51 local time), a submarine earthquake (Mw 6.6) occurred at the north of Samos Island, Greece, and offshore Seferihisar-İzmir, Turkey, with an epicenter of (37.88° N, 26.70° E) at a depth of ~ 15 km (AFAD 2020). A total of 39 foreshocks occurred in the epicenter’s vicinity within the last 3 months before the event. Magnitudes of these earthquakes were not significant except the one with a magnitude of Mw 3.6 that occurred approximately at a 7 km depth on 9 October 2020, about 5 km west of the mainshock (Fig. 1).
Fig. 1.
Seismotectonic map of Samos Island and its surroundings. The star shows the mainshock of 30 October 2020 Samos Island–İzmir earthquake (Mw 6.6). The beach balls present the focal mechanisms of the mainshock and the aftershocks given in Appendix 1, Table 1. The black and red circles indicate 3-month foreshocks and 2-month aftershocks, respectively, as of Ministry of Interior Disaster and Emergency Management of Presidency (AFAD 2020) data. Marine and terrestrial faults are compiled from Chatzipetros et al. (2013), Emre et al. (2013), Evelpidou et al. (2019), and Ring et al. (2017). The kinematic parameters of the focal mechanism solutions are given in Appendix 1, Table 1. (BMG Büyük Menderes Graben, DP Dilek Peninsula, GF Gülbahçe Fault, İB İzmir Bay, KF Karaburun Fault, KMG Küçük Menderes Graben, KB Kuşadası Bay, OTF Orhanlı-Tuzla Fault, SF Seferihisar Fault, SB Sığacık Bay). Black rectangles denote the post-tsunami survey localities. White rectangles represent tide gauges in the inset map. Bathymetric and topographic data are from EMODnet Digital Terrain Model (https://www.emodnet-bathymetry.eu)
More than 4600 aftershocks have occurred by the end of November 2020, 50 having magnitudes Mw ≥ 4.0. The largest one with a magnitude of Mw 5.1 occurred at 16:14 (UTC), about 4 h after the earthquake, approximately 10 km southeast of the epicenter at a depth of about 7 km. From the conjugate-type aftershocks distribution between Dilek Peninsula (DP) in Turkey and north of Ikaria Island of Greece, approximately 80–100 km rupture length in E–W direction is evident in four segments with visible seismic gaps. Three segments are located in the northern part of the Samos, while the eastern swarm is aligned on the NNE–SSW direction, which is parallel with the alignment of Büyük Menderes Graben (BMG) (Fig. 1). North of Kuşadası Bay (KB) and the western part of the Samos reveals diffuse-type seismic activity. Nevertheless, a clear local cluster is prominent near Orhanlı-Tuzla Fault (OTF) between Gümüldür and Özdere Districts (Fig. 1). The present state of the aftershock distributions points to conjugate faulting as suggested by Aktar et al. (2007) for the earthquake swarm (Mw 5.9) on 17–21 October 2005 in Sığacık Bay (SB).
The fault plane solution of the mainshock shows a normal fault rupture on an E–W aligned plane dipping ~ 40° to the north, according to the preliminary results of AFAD. All other focal mechanism solutions obtained from aftershocks also indicate dip-slip (dominant normal) faults with dip angles ranging from 33° to 74° towards the N or NE (Appendix 1 Table 1).
Table 1.
Focal parameters of the 30 October 2020 (12:51 UTC) Samos Island–İzmir earthquake and its aftershocks for M ≥ 4.0
| Date (D.M.Y) | UTC (h:min) | Mw | Depth (km) | Latitude (° N) | Longitude (° E) | Az. (°) | Dip (°) | Rake (°) | Ref |
|---|---|---|---|---|---|---|---|---|---|
| 30.10.2020 | 12:51 | 6.6 | 16.5 | 37.8881 | 26.7770 | 95 | 43 | −87 | 1 |
| 30.10.2020 | 12:53 | 4.7a | 7.1 | 37.8406 | 26.7995 | 93 | 60 | −91 | 1 |
| 30.10.2020 | 12:58 | 4.2a | 7.0 | 37.8751 | 26.8986 | 96 | 53 | −86 | 1 |
| 30.10.2020 | 13:01 | 4.0a | 6.8 | 37.8118 | 26.9185 | 97 | 34 | −85 | 1 |
| 30.10.2020 | 13:29 | 4.2 | 7.3 | 37.9880 | 27.0716 | 82 | 53 | −107 | 1 |
| 30.10.2020 | 14:00 | 4.8 | 3.4 | 37.8520 | 26.8216 | 111 | 58 | −72 | 1 |
| 30.10.2020 | 14:06 | 4.2 | 7.1 | 37.8393 | 26.9850 | 90 | 45 | −106 | 1 |
| 30.10.2020 | 15:46 | 4.0 | 11.0 | 37.8088 | 26.7125 | 91 | 51 | −89 | 2 |
| 30.10.2020 | 16:14 | 5.1 | 7.7 | 37.8331 | 26.8690 | 103 | 45 | −85 | 1 |
| 30.10.2020 | 16:19 | 4.4 | 7.0 | 37.8388 | 26.8780 | 97 | 41 | −85 | 1 |
| 30.10.2020 | 21:35 | 4.0 | 13.0 | 37.8339 | 26.4862 | 303 | 60 | −80 | 2 |
| 31.10.2020 | 00:05 | 4.0 | 8.0 | 37.8490 | 26.8119 | 119 | 47 | −116 | 2 |
| 31.10.2020 | 02:40 | 4.2 | 16.0 | 37.8936 | 26.4855 | 95 | 57 | −97 | 2 |
| 31.10.2020 | 03:10 | 4.1 | 8.0 | 37.8211 | 26.8831 | 91 | 42 | −77 | 2 |
| 31.10.2020 | 06:31 | 5.0 | 7.3 | 37.8701 | 26.8303 | 271 | 52 | −98 | 1 |
| 31.10.2020 | 09:47 | 4.0 | 13.0 | 37.9264 | 26.4860 | 95 | 60 | −93 | 2 |
| 31.10.2020 | 05:42 | 4.4 | 12.0 | 37.8785 | 26.4579 | 95 | 42 | −91 | 2 |
| 01.11.2020 | 08:05 | 4.2 | 12.0 | 37.9203 | 26.9379 | 89 | 39 | −111 | 2 |
| 01.11.2020 | 08:33 | 4.4 | 11.0 | 37.8146 | 26.8477 | 297 | 74 | −61 | 2 |
| 02.11.2020 | 12:58 | 4.0 | 11.0 | 37.8934 | 26.8408 | 109 | 33 | −105 | 2 |
| 02.11.2020 | 21:16 | 4.3 | 13.0 | 37.8585 | 26.4478 | 95 | 65 | −97 | 2 |
| 03.11.2020 | 21:35 | 4.0 | 13.0 | 37.8602 | 26.4594 | 260 | 33 | −109 | 2 |
| 09.11.2020 | 21:30 | 4.1 | 10.0 | 37.8729 | 27.0078 | 271 | 54 | −97 | 2 |
| 11.11.2020 | 07:49 | 4.3 | 12.0 | 37.8418 | 26.9433 | 92 | 51 | −98 | 2 |
aLocal magnitude (ML), Ref-1: AFAD (2020)—http://deprem.afad.gov.tr, Ref-2: NOA (2020)—http://bbnet.gein.noa.gr
Sea-Level Recordings
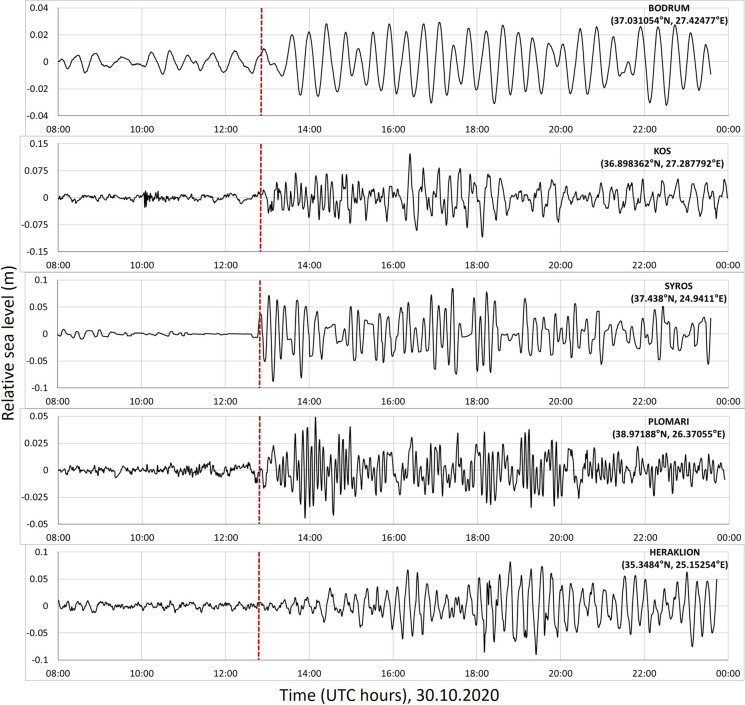
The 30 October 2020 tsunami was recorded by the tide gauge network of the Aegean Sea (Fig. 1). However, as the sea level sensors are located outside the area majorly affected by the tsunami, none of the stations recorded sizable waves (Fig. 1). We present the detided measurements from five tide gauges (Fig. 2). The mareogram data recorded at 1 min sampling intervals have been downloaded (http://www.ioc-sealevelmonitoring.org/station.php?code=stationcode), and the detiding process is carried out by using a fast Fourier transform (FFT) band-pass filter to remove the astronomical tide. There is a clear indication of the tsunami at all five stations. However, the measured amplitudes, ranging between 3 cm measured at Bodrum and 12 cm measured at Kos station, are much smaller than the near-field observations, as can be expected from the gauge locations.
Fig. 2.
Detided tide-gauge measurements of five stations in the Aegean Sea for the 30 October 2020 tsunami. The red dashed lines show the earthquake time, 12:51 UTC
Post-tsunami Field Measurements
The main objectives of the post-tsunami field survey were (1) to document the tsunami effects along the coast, (2) to obtain any available data on the observed coastal amplitudes and inundation extent, (3) to perform audiovisual recording before cleanup, (4) to interview the eyewitnesses, and (5) to understand and explain the event in detail. The first survey took place 2 days after the earthquake (31 October to 1 November 2020) to acquire data before any cleanup. The second survey was carried out on 4–6 November 2020, for a more detailed investigation, including flow depth, runup and inundation measurements, eyewitness accounts, and identification of damages to coastal structures. The tsunami characteristics were measured using the conventional methods described in the UNESCO-IOC ITST Post-Tsunami Survey Field Guide 2nd Edition (UNESCO-ITST 2014).
The survey covered the ~ 110-km-long coastline and mainly focused on three regions (Fig. 1): (1) Alaçatı and Zeytineli on the northwestern coast, (2) Demircili, Altınköy, Sığacık, Akarca, and Tepecik in the Seferihisar District on the northern coast, and (3) Gümüldür on the northeastern coast with respect to the earthquake epicenter. The teams collected field data on tsunami penetration evidence such as deposited debris, watermarks left on structures, and damage to vegetation and objects. We conducted eyewitness interviews and gathered available video recordings to obtain more information on the tsunami behavior at the time of the event. Laser ruler instruments and two GPS stations (ProMark 700) were used to perform flow depth, runup, and inundation measurements. All measurements were then referenced to the sea level at the time of the event, which was at low tide, 0.2 m, with respect to the mean lower low water (MLLW) (http://tides4fishing.com/as/turkey/izmir). This level was determined according to the long-term water level marks at the quay walls of Port Alaçatı and Sığacık Marinas, also confirmed by the managers of these marinas (assuming no significant variations in the sea level inside the marinas). The results of the survey are summarized in Appendix 2, Table 1.
Observations in the North-Western Coast
Alaçatı Locality
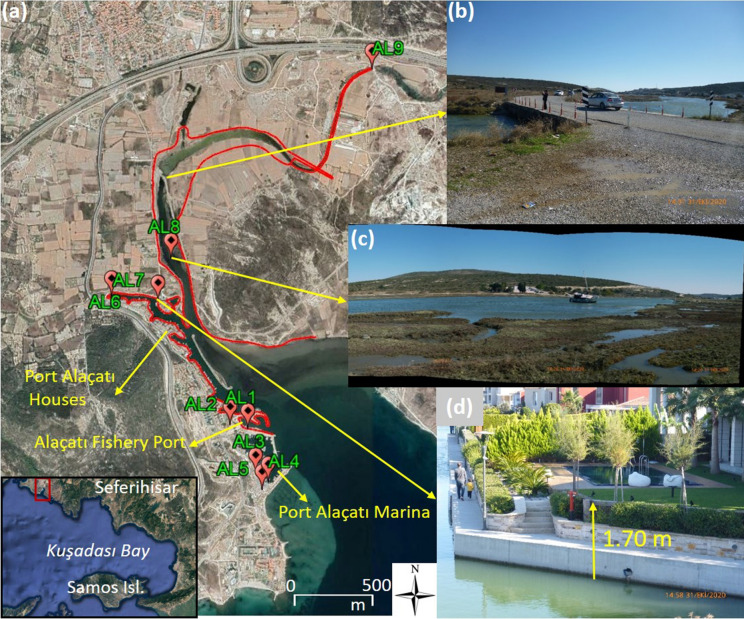
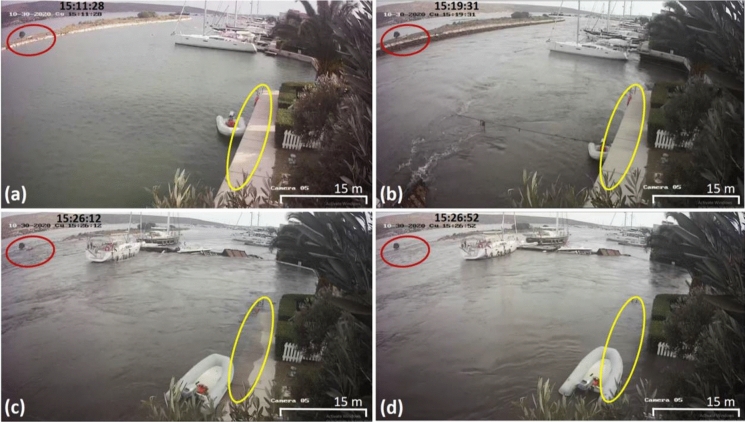
In Alaçatı, there is a stream—azmak in Turkish—called Alaçatı Azmak where maximum tsunami penetration was ~ 2490 m (Fig. 3a, Table 2-AL9). The tsunami inundation mainly followed the azmak streambed and the flat coastal topography (Fig. 3a). A boat was dragged ~ 1160 m along the stream (Fig. 3a–c, Table 2-AL8) from its location in the fishery port. In the fishery port and Port Alaçatı Marina, the maximum inundation distances were ~ 73 m with runup heights of around 1.0 m (Fig. 3, Table 2-AL2 and AL5). According to house owners and video recordings, Port Alaçatı houses were also affected by the tsunami, where the water level rose by 1.7 m (Fig. 3d, Table 2-AL6 and AL7). According to the Port Alaçatı houses manager, before the first positive wave arrived, the sea receded to a depth of 1.5 m, 28 min after the earthquake, confirmed by security video recordings (Appendix 3, Fig. 21).
Fig. 3.
a Map showing the surveyed locations in Alaçatı locality (image is
taken from Google Earth) The red line shows the tsunami penetration/inundation zone. b Tsunami traces visible on Alaçatı Azmak bridge (at ~ 30 cm above the bottom of the bridge wall) located 1.0 km away from the coastline (38.2706° N, 26.3768° E), c Fisher boat dragged 1160 m away from the fishery port along Alaçatı Azmak, d Water level increase at the garden wall of Alaçatı Port houses according to the house owner
Table 2.
Summary of the field survey measurements
| Locality | Point ID | Latitude (° N) | Longitude (° E) | Measurement (m) | Type | Inundation distance (m) | Notes |
|---|---|---|---|---|---|---|---|
| Alaçatı | AL1 | 38.2556 | 26.3833 | 1.0 | T | – | |
| AL2 | 38.2559 | 26.3820 | 1.0 | R | 73 | Alaçatı Fishery Port, inundation limit | |
| AL3 | 38.2530 | 26.3839 | 1.0 | T | – | ||
| AL4 | 38.2525 | 26.3849 | 1.2 | T | – | ||
| AL5 | 38.2520 | 26.3844 | 0.9 | R | 73 | Port Alaçatı, inundation limit | |
| AL6 | 38.2635 | 26.3730 | 1.7 | other | – | Water level increase in the manmade channel-like port, Port Alaçatı houses | |
| AL7 | 38.2632 | 26.3765 | 1.7 | other | – | Water level increase in the manmade channel-like port, Port Alaçatı houses | |
| AL8 | 38.2657 | 26.3775 | – | – | 1160 | A boat was dragged up to this point | |
| AL9 | 38.2769 | 26.3927 | – | – | 2490 | Maximum tsunami penetration among all surveyed locations at Alaçatı Azmak stream | |
| Zeytineli | Z1 | 38.1973 | 26.4930 | 0.6 | R | 270 | Inundation limit |
| Z2 | 38.1964 | 26.4924 | 1.1 | T | |||
| Z3 | 38.1959 | 26.4901 | 1.9 | T | |||
| Z4 | 38.1959 | 26.4903 | 1.5 | F | |||
| Z5 | 38.1960 | 26.4886 | 1.9 | F | |||
| Z6 | 38.1951 | 26.4919 | 2.4 | T | |||
| Z7 | 38.1948 | 26.4920 | 2.3 | T | |||
| Z8 | 38.1974 | 26.4899 | 0.7 | Other | Zeytineli Azmak bridge, water overflowed the bridge at that elevation | ||
| Z9 | 38.2009 | 26.4933 | 0.6 | R | 710 | ||
| Z10 | 38.2014 | 26.4936 | 0.5 | R | 760 | Inundation limit | |
| Demircili | D1 | 38.2116 | 26.6769 | – | – | 45 | Beachside, only small inundation |
| D2 | 38.2075 | 26.6864 | 1.0 | Other | ~ 1.00 water level increase inside the harbor, the sea receded to 1.80 m depth | ||
| D3 | 38.2104 | 26.6944 | 0.7 | R | 15 | ||
| Altınköy | ALT1 | 38.2135 | 26.7220 | – | – | 230 | Inundation limit at the beachside |
| ALT2 | 38.2155 | 26.7214 | 0.2 | F | 600 | Tsunami penetration along the streambed | |
| Sığacık | S1 | 38.1912 | 26.7832 | 2.1 | T | ||
| S2 | 38.1912 | 26.7844 | 1.5 | T | |||
| S3 | 38.1911 | 26.7845 | 1.6 | T | |||
| S4 | 38.1914 | 26.7851 | 1.5 | T | |||
| S5 | 38.1928 | 26.7853 | 1.5 | T | |||
| S6 | 38.1924 | 26.7862 | 1.0 | T | |||
| S7 | 38.1941 | 26.7841 | 2.1 | T | |||
| S8 | 38.1951 | 26.7853 | 2.2 | T | |||
| S9 | 38.1955 | 26.7871 | 1.8 | T | |||
| S10 | 38.1952 | 26.7872 | 0.7 | T | |||
| S11 | 38.1961 | 26.7877 | 2.0 | T | |||
| S12 | 38.1959 | 26.7885 | – | – | 140 | A boat was dragged to this point from the shore | |
| S13 | 38.1958 | 26.7884 | 2.0 | T | |||
| S14 | 38.1958 | 26.7901 | 1.6 | R | |||
| S15 | 38.1984 | 26.7907 | 2.0 | T | |||
| S16 | 38.1981 | 26.7909 | 1.8 | T | |||
| S17 | 38.1983 | 26.7918 | 2.0 | T | |||
| S18 | 38.1986 | 26.7930 | 1.4 | R | 360 | ||
| S19 | 38.1992 | 26.7929 | 1.4 | R | 410 | Maximum inundation in Sığacık | |
| S20 | 38.2012 | 26.7857 | 1.9 | T | |||
| S21 | 38.2015 | 26.7856 | 1.9 | R | |||
| S22 | 38.1915 | 26.7850 | 0.9 | T | |||
| S23 | 38.1907 | 26.7830 | 1.2 | T | |||
| S24 | 38.1912 | 26.7847 | 1.4 | T | |||
| S25 | 38.1912 | 26.7849 | 1.6 | T | |||
| S26 | 38.1912 | 26.7857 | 1.0 | T | |||
| S27 | 38.1918 | 26.7863 | 1.3 | T | |||
| S28 | 38.1919 | 26.7867 | 1.3 | R | |||
| S29 | 38.1926 | 26.7864 | 1.4 | R | |||
| S30 | 38.1910 | 26.7873 | 1.8 | R | |||
| S31 | 38.1935 | 26.7861 | 1.3 | T | |||
| S32 | 38.1940 | 26.7856 | 1.3 | T | |||
| S33 | 38.1941 | 26.7853 | 1.4 | T | |||
| S34 | 38.1942 | 26.7848 | 1.3 | T | |||
| S35 | 38.1943 | 26.7847 | 1.4 | T | |||
| S36 | 38.1951 | 26.7854 | 2.3 | T | Maximum tsunami height among all surveyed locations | ||
| S37 | 38.1954 | 26.7856 | 1.8 | T | |||
| S38 | 38.1952 | 26.7862 | 1.9 | T | |||
| S39 | 38.1956 | 26.7876 | 1.7 | T | |||
| S40 | 38.1956 | 26.7881 | 1.2 | T | |||
| S41 | 38.2039 | 26.7802 | 1.5 | R | |||
| S42 | 38.1916 | 26.7845 | 0.8 | F | |||
| S43 | 38.1918 | 26.7838 | 0.6 | F | |||
| S44 | 38.1956 | 26.7874 | 0.9 | F | |||
| S45 | 38.1956 | 26.7884 | 0.6 | F | |||
| S46 | 38.1950 | 26.7866 | 0.4 | F | |||
| S47 | 38.1949 | 26.7861 | 0.4 | F | |||
| S48 | 38.2013 | 26.7860 | 1.5 | F | |||
| Akarca | A1 | 38.1645 | 26.8148 | 1.9 | Other |
Splash height Ground elevation 0.89 m |
|
| A2 | 38.1644 | 26.8150 | 2.5 | T | |||
| A3 | 38.1645 | 26.8152 | – | – | 55 | A car was dragged to this point from the shore | |
| A4 | 38.1645 | 26.8154 | 2.4 | T | |||
| A5 | 38.1651 | 26.8156 | 3.8 | R | 91 | Maximum runup among all surveyed locations, inundation limit | |
| A6 | 38.1659 | 26.8148 | – | – | 90 | A boat was dragged to this point from the shore | |
| A7 | 38.1682 | 26.8135 | 1.1 | T | |||
| A8 | 38.1683 | 26.8135 | 1.0 | R | 290 | Inundation limit | |
| A9 | 38.1667 | 26.8122 | 1.5 | T | |||
| A10 | 38.1668 | 26.8118 | 1.1 | T | |||
| A11 | 38.1665 | 26.8112 | 2.0 | T | |||
| A12 | 38.1665 | 26.8107 | 2.1 | T | |||
| A13 | 38.1680 | 26.8079 | 1.2 | R | 80 | ||
| A14 | 38.1681 | 26.8112 | 0.9 | R | 250 | Inundation limit | |
| A15 | 38.1641 | 26.8149 | 0.5 | F | 40 | ||
| A16 | 38.1675 | 26.8092 | 1.5 | T | |||
| A17 | 38.16693 | 26.8092 | 1.6 | T | |||
| A18 | 38.1663 | 26.8092 | 2.0 | T | |||
| A19 | 38.1666 | 26.8092 | 1.8 | T | |||
| A20 | 38.1671 | 26.8091 | 1.9 | T | |||
| A21 | 38.1672 | 26.8093 | 2.3 | T | |||
| A22 | 38.1681 | 26.8092 | 1.2 | R | |||
| A23 | 38.1656 | 26.8138 | 2.4 | T | |||
| A24 | 38.1657 | 26.8137 | 2.9 | T | |||
| A25 | 38.1667 | 26.8149 | 1.8 | T | |||
| A26 | 38.1669 | 26.8151 | 1.8 | T | |||
| A27 | 38.1673 | 26.8153 | 1.5 | R | |||
| A28 | 38.1673 | 26.8154 | 1.6 | R | |||
| A29 | 38.1671 | 26.8151 | 1.8 | T | |||
| A30 | 38.1711 | 26.8038 | – | – | 20 | Inundation limit | |
| A31 | 38.1647 | 26.8146 | 1.3 | F | |||
| A32 | 38.1559 | 26.8251 | 0.8 | F | |||
| A33 | 38.1665 | 26.8110 | 0.6 | F | |||
| A34 | 38.1664 | 26.8120 | 0.8 | F | |||
| A35 | 38.1681 | 26.8113 | 0.1 | F | 250 | Inundation limit | |
| A36 | 38.1615 | 26.8213 | 0.2 | F | |||
| A37 | 38.1618 | 26.8212 | – | – | 100 | ||
| A38 | 38.1622 | 26.8215 | – | – | 150 | Inundation limit | |
| A39 | 38.1615 | 26.8204 | – | – | 45 | ||
| A40 | 38.1629 | 26.8190 | – | – | 80 | Inundation limit | |
| Tepecik | T1 | 38.1458 | 26.8201 | – | – | 12 | Inundation limit, only sweeps |
| T2 | 38.1390 | 26.8306 | – | – | 20 | Inundation limit on the beach, only sweeps | |
| T3 | 38.1395 | 26.8314 | – | – | 120 | Tsunami penetration along a small stream, Orsal Bay | |
| T4 | 38.1356 | 26.8331 | 1.5 | F | – | ||
| T5 | 38.1114 | 26.8443 | – | – | 18 | Inundation limit, eyewitness: 25 m sea recession | |
| Gümüldür | G1 | 38.0757 | 26.9493 | 23 | Inundation limit in front of Rafael Boutique Hotel | ||
| G2 | 38.0757 | 26.950 | 15 | Inundation limit, only sweeps | |||
| G3 | 38.0677 | 26.9953 | Minor damage on boats in harbor, no trace of water on objects | ||||
| G4 | 38.0652 | 26.9988 | 0.5 | F | |||
| G5 | 38.0652 | 26.9992 | 25 | Inundation limit, sweeps on a walking road | |||
| G6 | 38.0577 | 27.0117 | 25 | Inundation limit |
R runup, T tsunami height, F flow depth, Other see the notes
Fig. 21.
Security video frames showing different stages of the tsunami motion in the Port Alaçatı houses, Alaçatı, Fig. 3a (38.2592° N, 26.3797° E). Timestamps are in local time (GMT + 03:00), and the earthquake time is 14:51:23 (AFAD 2020). a No water motion 10 min after the earthquake, b maximum water withdrawal (~ 1.50 m), the white boat started to move from its original location, c start of inundation, the white and adjacent boats, and the small berthing structures were moved and damaged, and d maximum water level increase (~ 1.70 m) and inundation in the region. Red and yellow ellipses show water level changes at specific locations, around the small tree over the middle breakwater and quay floor, respectively
Zeytineli Locality
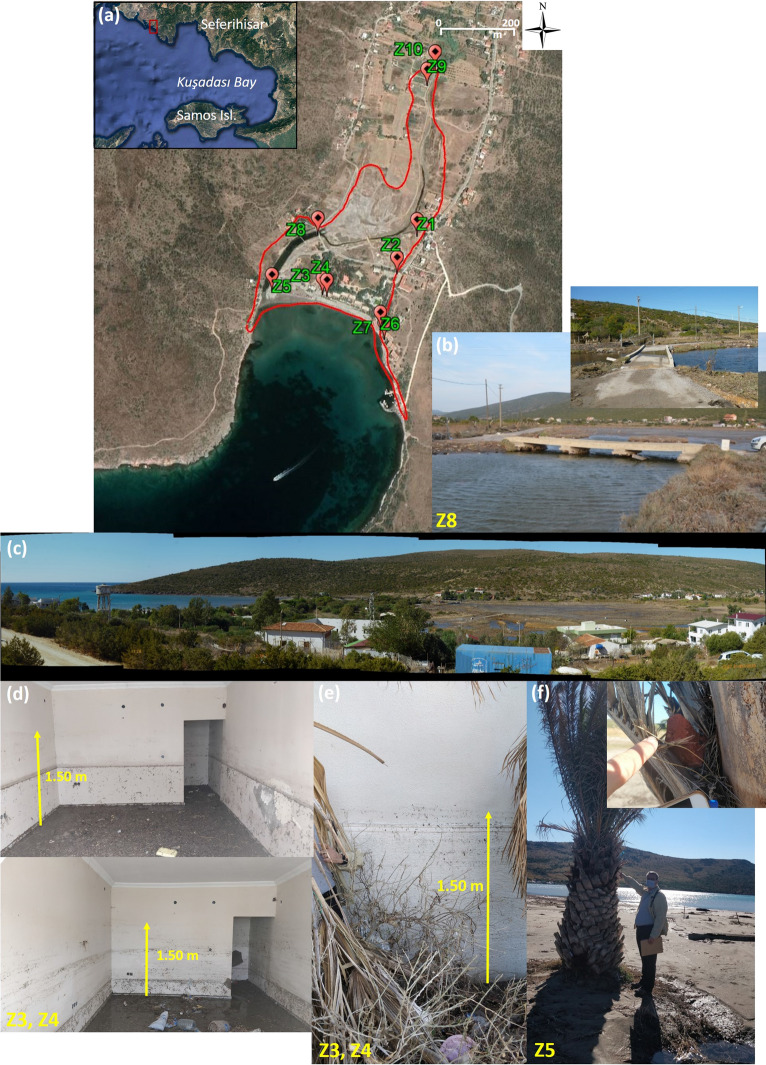
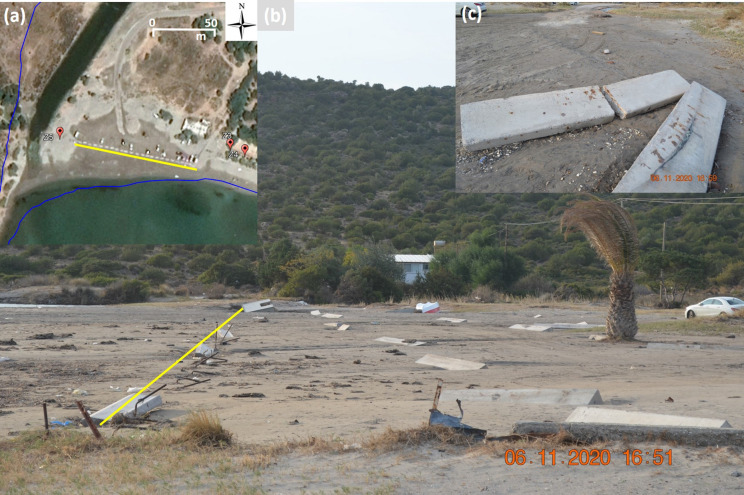
Zeytineli was the area most impacted by the tsunami on the northwestern coastline (to the epicenter), where a significant tsunami penetration was observed along the stream, Zeytineli Azmak. The tsunami inundation zone mainly followed the streambed and the surrounding low-lying flat topography, as there are steep slopes on both sides (mountainside) (Fig. 4a–c). The abandoned summerhouses along the shore were severely damaged, and debris accumulated on both outer walls and inside (Fig. 4d–e, Table 2-Z3 and Z4). The maximum inundation distance was ~ 760 m along the NNE–SSW direction from the sea coast. The flow depth was 1.9 m on the palm trees, 50 m away from the coastline (Fig. 4f, Table 2-Z5). Additionally, concrete blocks (30 × 50 × 300 cm), weighing approximately 1 ton, were found dragged 20–25 m inland direction and scattered from their original locations by the tsunami (Fig. 5).
Fig. 4.
a Map showing the surveyed locations and the tsunami inundation zone (red line) in Zeytineli (image is
taken from Google Earth). The corresponding survey location IDs are indicated at the lower left corner of each figure. b Damaged bridge on Zeytineli Azmak due to tsunami. c Panoramic view of tsunami inundation in Zeytineli. Debris accumulated d inside and at e outer wall of a house (flow depth 1.5 m). f Wave traces on palm tree near the coastline (flow depth 1.9 m)
Fig. 5.
a Original layout of the concrete blocks in Zeytineli (image is
taken from Google Earth). b Concrete blocks drifted and scattered by the tsunami. c Closer view of drifted and damaged concrete blocks. Yellow lines indicate the original location of the blocks before the tsunami
Observations in the Northern Coast
Demircili and Altınköy Localities
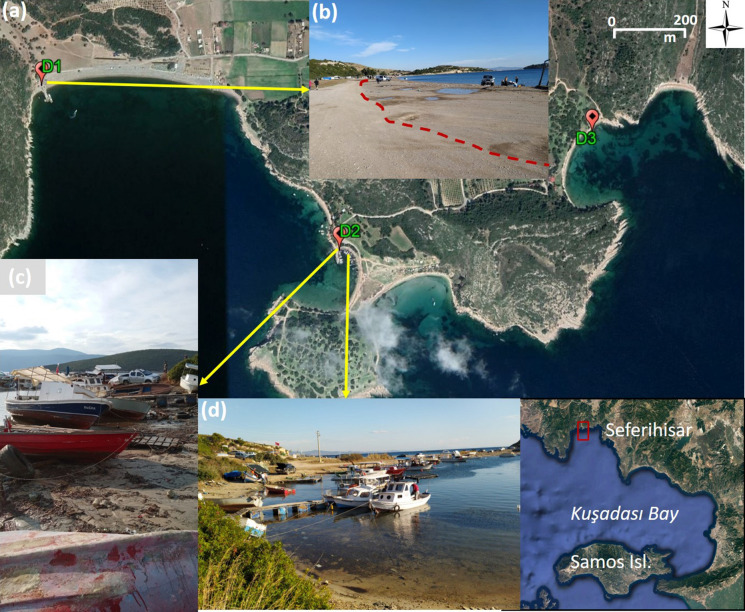
The tsunami impact was quite different in the northwestern and southeastern parts of the coastline in Demircili. Only a small inundation of ~ 45 m was measured on the northwestern side of the coast (Fig. 6, Table 2-D1). On the other hand, considerable damage was observed by the local people and fishers on a narrow beach on the southeastern side of the bay (Fig. 6, Table 2-D2). According to eyewitnesses, the sea receded almost 20 min after the earthquake and returned in 3–4 min. They observed this receding–inundation for almost 5 h. Boats moored at a depth of 1.8 m were grounded when the sea receded. Here, the water level rose by more than 1 m inside the small fishery shelter. Further east, the runup was 0.7 m on Denizyıldızı beach (Fig. 6, Table 2-D3), and the inundation distance was about 15 m at this location, as inferred from seaweed deposits.
Fig. 6.
a Map showing the surveyed locations in Demircili (image is
taken from Google Earth). b Small tsunami inundation (red line) in Demircili Beach on the northwestern side of the bay c, d Damaged boats observed in the small fishery structure on the southeastern bay of Demircili
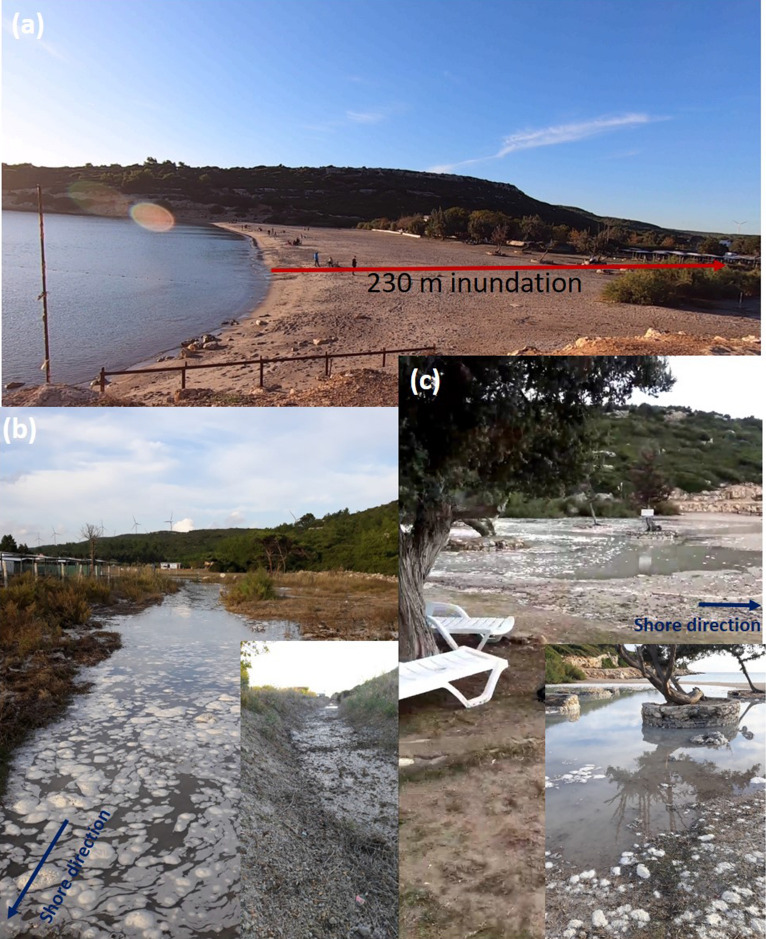
In Altınköy, the tsunami inundated the beach up to ~ 230 m (Fig. 7a, Table 2-ALT1). The tsunami penetration along the streambed reached ~ 600 m with a flow depth of 0.2 m (Fig. 7b, Table 2-ALT2).
Fig. 7.
a Tsunami inundation area in Altınköy locality a on the beach, b along the streambed, and c on the beach in closer view (photos in insets (b, c) were provided by eyewitnesses)
Sığacık Locality
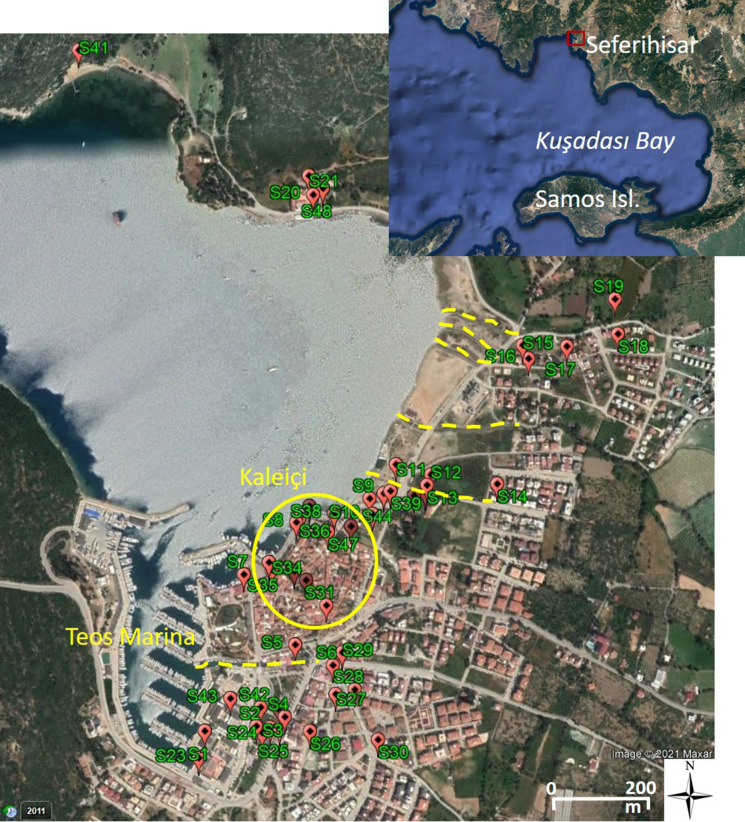
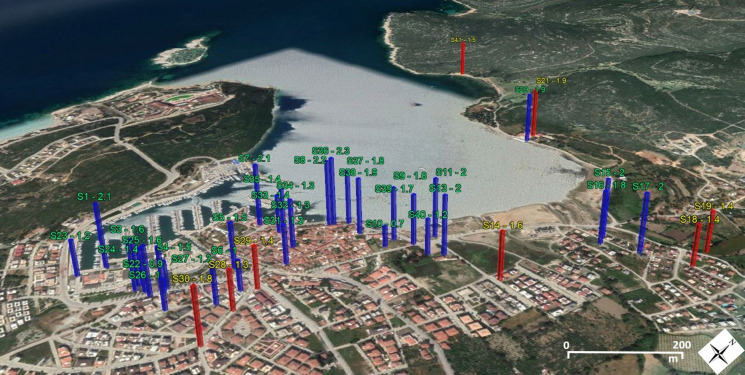
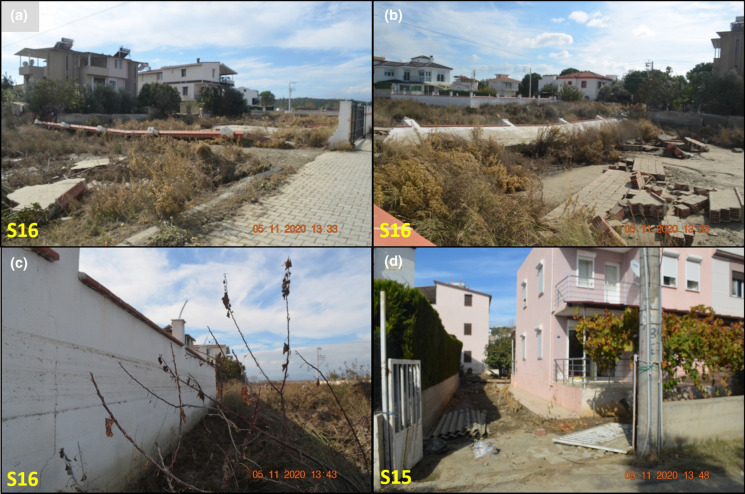
Sığacık, a low-lying bay-shaped area with several local streambeds, was the most impacted area of the tsunami-affected coastline (Fig. 8). The tsunami height measurements at surveyed locations in Sığacık range from 0.9 to 2.3 m (Fig. 9). We measured the maximum runup as 1.9 m (Table 2-S21). Further tsunami inundation and impact were observed in the low-lying areas surrounding the local streams of the bay (Figs. 8, 9). We observed significant inundation in the most low-lying area (Fig. 8). Here, we measured the inundation distance as ~ 410 m (Table 2-S19). The tsunami also caused significant damage to properties and houses at that location, leaving injured locals who barely survived the tsunami (Fig. 10a–d).
Fig. 8.
General view of the surveyed locations in Sığacık. Dashed yellow lines show the local river/riverbeds where the tsunami penetrated. Teos Marina and Kaleiçi regions experienced heavy damage. There was significant inundation in the most low-lying area (~ 410 m) due to an incoming wave through the bay (Table 2-S19) as well as through Teos Marina (Table 2-S30) (image is
taken from Google Earth)
Fig. 9.
Distribution of the measured tsunami and runup heights along the surveyed coastline in Sığacık due to the 30 October 2020 tsunami. The blue bars represent the tsunami height, and the red ones represent the runup. The labels are given as survey point ID–measured value (m)
Fig. 10.
Observed damage on garden walls and summerhouse garden entrances at low-lying maximum inundation area in Sığacık locality a–c at point S16, d at point S15
In Teos Ancient City, which was one of the 12 Ionian city-states established on the coast of the Aegean Sea in Western Anatolia, two ports were serving the city, the southern port with an entrance 8 km south of Sığacık and the northern port located near Sığacık, at the location of the current Teos Marina. We found inland tsunami traces at a distance of ~ 550 m from the shore, penetrated along the low-lying old streambed area, which was connecting the ancient city to the sea. The tsunami completely inundated the southern port facilities (storage buildings, service structures, and berthing places) of Teos Ancient City.
We observed significant damage in Teos Marina, one of the significant coastal facilities (for more information, see Sect. 5). The flow depth was measured as 0.9 m on the garden fence of the port near the pedestrian entrance, corresponding to a tsunami height of 2.1 m (Fig. 11a, Table 2-S1). The tsunami penetrated ~ 210 m through a local stream connected to the sea inside the marina and flooded the surrounding area with a flow depth of 0.5 m (1.5 m in the streambed) (Fig. 11b, Table 2-S5). At another local stream, further northeast from Teos Marina, the tsunami penetration caused a 1.5 m water level rise from the streambed ground overflowing the small bridge at the upstream, according to eyewitnesses (Table 2-S11). Figure 11c shows damaged boats and seafront facilities on the Sığacık coastline.
Fig. 11.
a Tsunami traces on the garden fence of Teos Marina (S1) corresponding to a flow depth of 0.9 m. b Tsunami flood traces on the iron fences of a local river, connected to the sea inside Teos Marina, found at ~ 210 m inland with a flow depth of 0.5 m (1.5 m in the riverbed). c Damaged boats and seafront facilities on Sığacık coastline
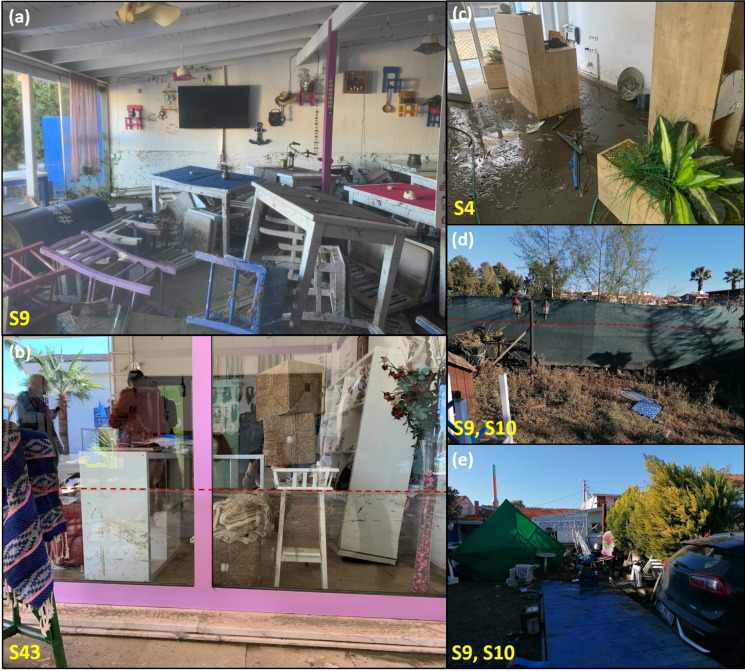
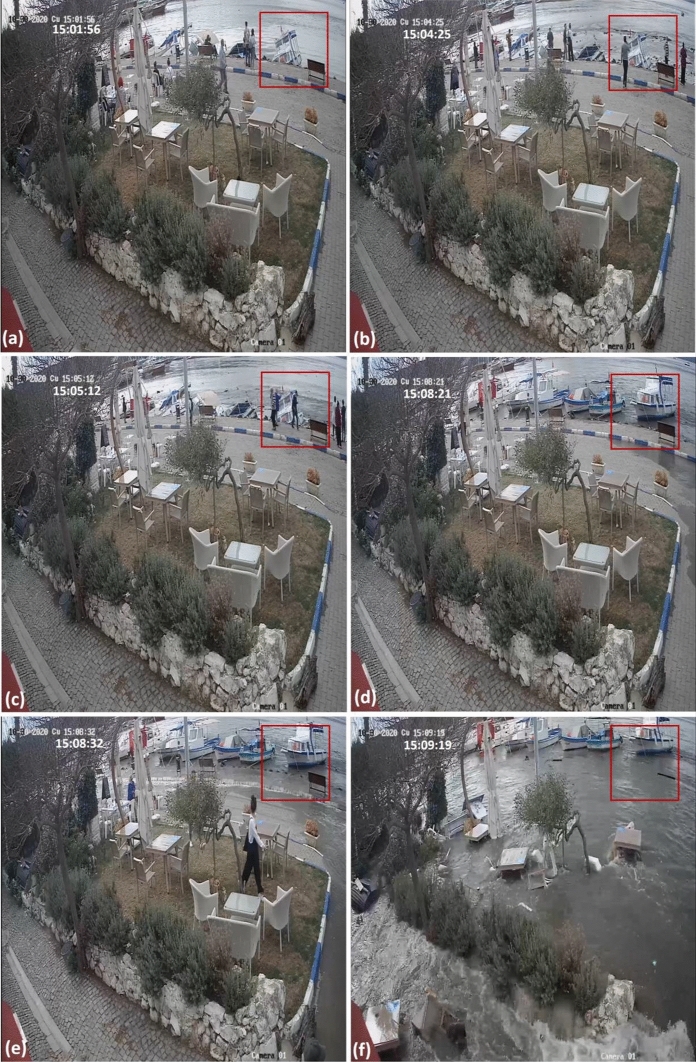
Kaleiçi region, located along the coastline with many cafes and shops, was heavily damaged (Fig. 12a–e). We examined the incoming tsunami dynamics in Kaleiçi from a security video recording (Appendix 3 Fig. 22). According to our inferences, the maximum sea withdrawal occurred ~ 13 min after the earthquake, while the first positive wave arrived at ~ 18 min.
Fig. 12.
Heavily damaged cafes and shops in Kaleiçi region in Sığacık locality at points a S9, b S43, c S4, d, and e S9–S10
Fig. 22.
Security video frames showing different stages of tsunami motion in the Kaleiçi region of Sığacık (38.1953° N, 26.7856° E). Timestamps are in local time (GMT + 03:00), and the earthquake time is 14:51:23 (AFAD 2020). a Start of water motion, b maximum sea withdrawal, c start of the incoming wave, d start of inundation, e significant inundation, and f maximum inundation in the pedestrian road. The red rectangles show (i) the boat movement in all frames due to water level change, (ii) the emerging seabed material due to sea withdrawal in the frame (b), and (iii) the disappeared sidewalk and bench in frames (e, f) due to inundation
Akarca Locality
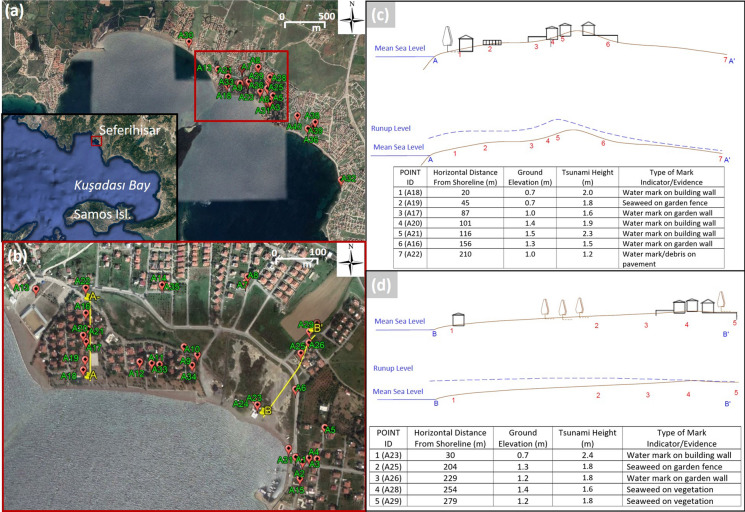
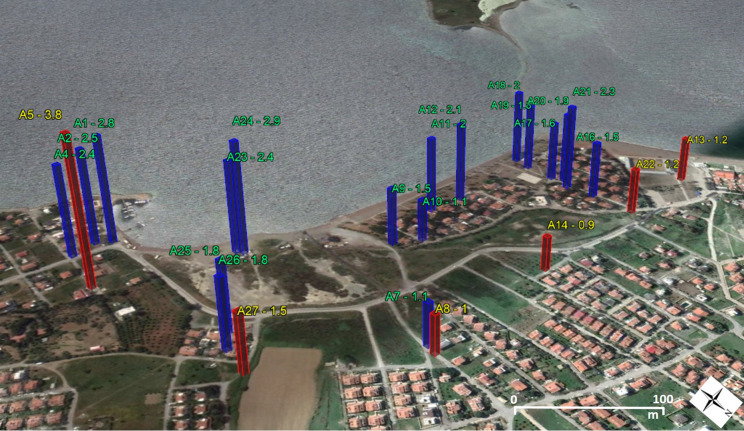
The Akarca coast has three bays, with a highly localized tsunami impact in the central one and a significant reduction in the northwest and southeast directions (Fig. 13a, Table 2-A30, A32, A36–A40). We collected a significant number of measurements in the central part of Akarca and gathered information from eyewitnesses. The maximum inundation distance in Akarca was measured as ~ 290 m (Fig. 13b, Table 2-A8). We present two different cross-sectional profiles of tsunami height measurements in Fig. 13c–d. The tsunami height and runup distributions along the surveyed coastline are also given in Fig. 14. The maximum runup among all surveyed locations was measured as 3.8 m (Fig. 15a, Table 2-A5) and observed at a distance of 91 m from the shore.
Fig. 13.
a General and b closer view of the surveyed locations in Akarca. The red rectangle shows the central bay of Akarca, where the tsunami impact was highly localized. c, d Cross profiles of measured tsunami inundation heights in Akarca at A–A′ and B–B′, respectively (image is
taken from Google Earth)
Fig. 14.
Distribution of the measured tsunami and runup heights along the surveyed coastline in Akarca. The blue bars represent the tsunami height, and the red ones represent the runup. The labels are given in a point ID–measured value format
Fig. 15.
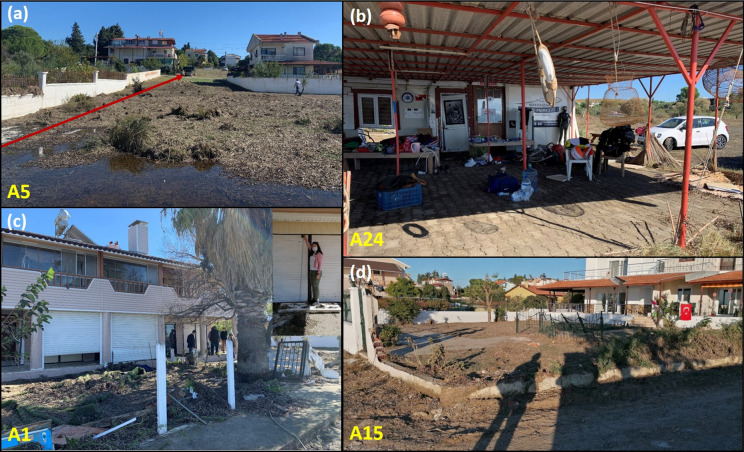
Observed destruction on properties and tsunami debris at summerhouse gardens in Akarca a tsunami deposits observed at maximum runup (3.8 m) (A5), b destruction in Seferihisar Diving Center where 2.2 m flow depth was measured (A24), c destroyed concrete garden walls of a summerhouse (A1) (1.9 m splash height measurement is shown on the upper-right inset), d destroyed iron garden fences of a summerhouse (A15)
Seferihisar Diving Center, located in the central part of Akarca, was severely damaged by the tsunami with a flow depth of 2.2 m (Fig. 15b, Table 2-A24). Here, the sea receded ~ 180 m to a depth of ~ 4 m. The diving center owner stated that he was drifted by the incoming wave to 200–250 m inland on a sofa and barely survived the tsunami. The inundation distance here reached 280 m. He described the first wave’s arrival time as 10–12 min after the earthquake, observing four to five waves with 8–10 min between successive waves.
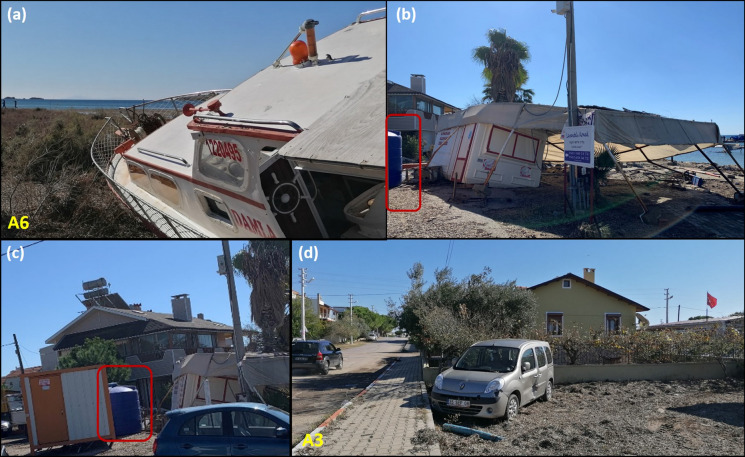
The garden fences and walls of the shore-facing summer houses also had notable damage (Fig. 15c–d, Table 2-A15). We measured 1.9 m splash height on a vertical wall of a house located just near the shore (Fig. 15c, Table 2-A1). A boat was dragged 90 m inland by the tsunami (Fig. 16a, Table 2-A6), where a car (~ 55 m) and a water storage tank (half full) were also dragged inland by the strong waves (Fig. 16b–d, Table 2-A3).
Fig. 16.
a A boat dragged 90 m inland in Akarca (A6). b Damaged shore-facing structures in Akarca fishery port area. c Half-full water storage tank (in red rectangles) dragged from the shoreline. d A car dragged 55 m inland and damaged by the tsunami at point A3
Tepecik Locality
Tepecik is another region where we noticed localized tsunami effects in several small bay-shaped areas. There was an overall decrease in the tsunami impact here compared with Akarca, with continuing impact decrease to the southeastern direction. The highland topography of this coastal area and the absence of many streams/streambeds (except one location, Table 2-T3) might be the reasons. Only small inundation was observed according to deposits on the beaches (Fig. 17a–b, Table 2-T1 and T5). The local maximum inundation reached 120 m along a small stream (Table 2-T3), where inundation was 20 m on the beach (Table 2-T2). A flow depth of 1.5 m was measured at location Table 2-T4, where the ground elevation was ~ 0.5 m above the sea level.
Fig. 17.
a Sweep deposits found at points a T1 and b T5 in Tepecik locality, where the tsunami inundation and impact was limited to these small inundation areas. The red dashed line indicates the estimated inundation border at point T5 according to the sweep deposits
Observations in the Northeastern Coast
Gümüldür Locality
Minor tsunami impact was observed in Gümüldür, mainly limited to narrow beach areas. The inundation distances ranged between 15 m and 25 m (Table 2-G1–G6), with a maximum value measured at the beach in front of Rafael Boutique Hotel (Table 2-G1). We found tsunami trace on a small pier with a flow depth of 0.5 m at only one location in Gümüldür (Table 2-G4).
We acquired information from local eyewitnesses about the tsunami behavior in Davutlar in Kuşadası District, the most southeastern coast from the epicenter. According to eyewitnesses, there was no significant abnormal water surface fluctuation or inundation in Davutlar. The tsunami penetrated ~ 30 m along a small streambed in Sevgi Beach in Davutlar. Our field observations show a significant reduction in the coastal impacts east from the V-shaped cape between Tepecik and Gümüldür.
Observations of Tsunami Dynamics and Impact/Damage on Coastal Facilities
In addition to the measurements of coastal tsunami parameters, we investigated the tsunami impact on coastal facilities, including small fishery shelters, ports, and marinas. Most of the damaged structures were poorly engineered structures, except Teos Marina in Sığacık. Teos Marina is a modern five-anchor quality marina, constructed and operated according to the national and international engineering and operational standards with 560 boat capacity.
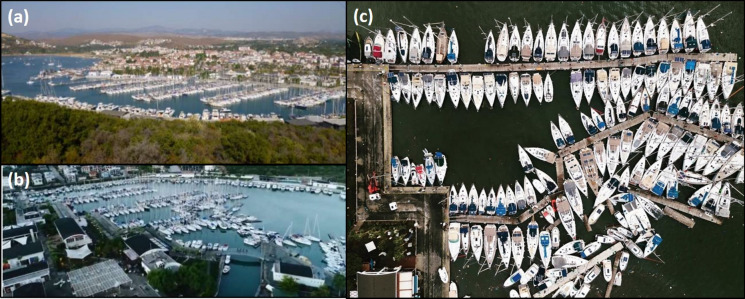
In Teos Marina (Fig. 8), four piers out of six (composed of floating pontoons) were displaced, and more than 320 boats were moved (some boats sank, and some were moved outside the marina by the tsunami). Figure 18 shows the Teos Marina’s layout and the boats before (Fig. 18a) and after (Fig. 18b–c) the tsunami. There is a stream inside the marina (Fig. 8) through which the tsunami penetrated and inundated Sığacık town. The backflow of inundation through the local stream discharging to the marina basin seems to be the primary cause of the strong currents and associated damage in Teos Marina. According to the general manager, the marina experienced large period oscillations lasting 4–5 h with an amplitude of 0.7 m. He stated that, 15 min after the earthquake, the marina’s water level decreased until the sea bottom appeared at some parts. Eyewitnesses heard loud bursts due to the breaking of the ropes connecting boats to the pontoons. Some boats were grounded on the sea bottom. Twenty minutes after the earthquake, the incoming waves caused strong current speeds and eddies inside the marina. The water level increased and reached ~ 2 m above the mean sea level at fixed berthing places ~ 25 min after the earthquake. He also informed that the second wave was more destructive, causing significant damage and grounding the boats to the sea bottom.
Fig. 18.
View of Teos Marina layout a before and b after the event with damaged pontoons (taken from a local newspaper, https://www.sabah.com.tr/video/yasam/depremin-merkez-ussu-seferisar-sigaciktaki-tsunami-felaketi-havadan-boyle-goruntulendi-video), and c after the event taken by a drone showing the damaged pontoons and boats (provided by a boat owner in the marina)
Port Alaçatı Marina (Fig. 3), which was well-engineered and floating concrete pontoons with 250 boat capacity, had damage only on connection points of the floating piers to the docks and fuel station, according to the general manager. However, considerable damage was reported in the fishery port located near the marina. The sea receded to a depth of ~ 2.5 m, 13 min after the earthquake, based on eyewitness interviews. The incoming wave was observed 20 min after the earthquake, 7–8 min after the withdrawal, and the water level rose to 1.5 m inside the marina.
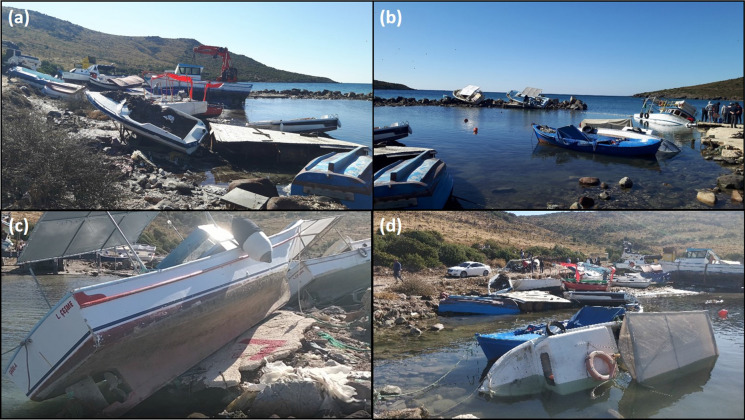
The small fishery port in Akarca suffered substantial damage. All of the floating piers (Fig. 19a–b) and many port facilities (Fig. 19c–d) were destroyed and became unusable. More than 20 boats were sunk, as reported by the Akarca fishery cooperative president.
Fig. 19.
Observed damage in a, b the floating piers used for berthing and mooring, and c, d the seafront harbor facilities in Akarca fishery shelter
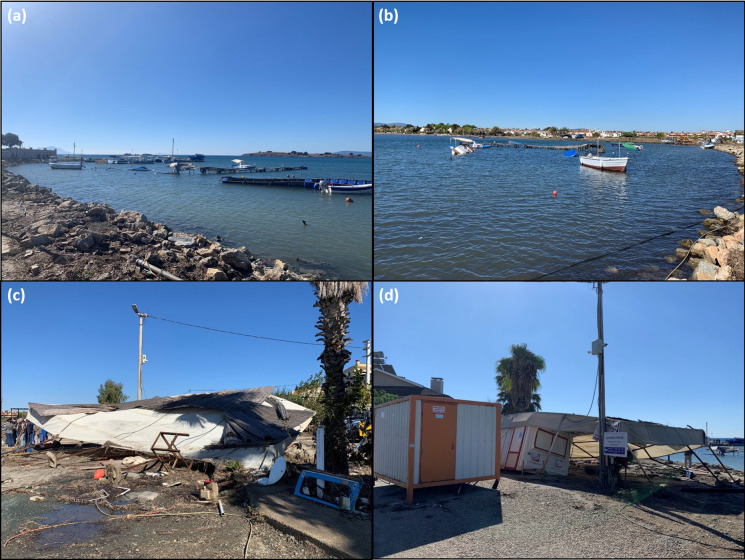
We also observed severe tsunami damage at another small fishery shelter in Zeytineli (Fig. 20). The poorly engineered mooring and berthing structures and all of the boats in the shelter were destroyed and became unusable, requiring complete reconstruction. The cars parked close to the shore were drifted to the sea. The sunk boats were required rescue operations.
Fig. 20.
Photos showing heavy damage in Zeytineli fishery shelter where all of the boats and mooring facilities were unusable after the tsunami
Discussion and Conclusions
The tsunami that followed the 30 October 2020 earthquake confirms the potential tsunami generation of segmented normal faults in the eastern Aegean and highlights the tsunami threat in the region. The results of the post-tsunami field surveys performed along a ~ 110-km-long coastline demonstrate the significant tsunami impact. This study’s primary limitation was that the fieldwork had to be performed under Covid-19 pandemic conditions, limiting time and human interaction considerably. Nevertheless, we attempted to attain clear information based on evidence, which necessitates a proper evaluation of the tsunami traces and eyewitness observations.
According to our findings from the field reconnaissances and eyewitness reports, the most impacted areas were Sığacık, especially Sığacık Teos Marina, and Akarca, about 30 km north from the epicenter. In Sığacık, the maximum inundation distance was measured as ~ 410 m, whereas it reached ~ 290 m in Akarca. Two hundred boats were sunk and destroyed at heavily damaged Teos Marina. In Teos Ancient City, located at the south of Sığacık, the inundation distance reached 550 m. The tsunami penetrated ~ 2490 m along Alaçatı Azmak (stream) and inundated the surrounding low-lying areas. The maximum inundation was ~ 760 m in Zeytineli, among all surveyed locations.
In the northwest, in Zeytineli, the local maximum flow depth was 1.9 m on the palm trees 50 m away from the coastline, whereas the local maximum runup reached 2.4 m. The maximum tsunami height was obtained in the Kaleiçi region of Sığacık and measured as 2.3 m, corresponding to a flow depth of 1.4 m. The maximum tsunami runup of 3.8 m was measured at an inundation distance of 91 m at Akarca. The tsunami impact decreased dramatically after the “V” shaped peninsula between Tepecik and Gümüldür localities. We identified almost no significant inundation or other indications of tsunami impact beyond Gümüldür, southeast of the earthquake epicenter.
On the Greek side, the 30 October tsunami impacted the island of Samos within a few minutes. In the harbor of Karlovasi, located on the island’s NW side and one of the nearest coastal locations to the fault rupture area, wave runup reached 1.8 m. The most impacted area of Samos Island is its most populated town of Vathy, where a series of waves flooded the waterfront buildings. On the southern coast of Samos, wave runup reached 0.5 m, and the tsunami did not inundate the waterfront of the harbor in Pythagorion (Kalligeris, personal communication). In Samos, a maximum inundation of 102 m was reported in Vathy town on the northeast coast (Triantafyllou et al. 2021).
To summarize, our findings reveal a significant amplification of the tsunami in small bays with narrow entrances, resulting in highly localized tsunami effects. The tsunami impact in such locations (especially in Sığacık and the central bay of Akarca) was much more severe than in other surveyed areas. The surveyed coastlines contain many streams (Azmak), which increased the potential tsunami inundation and impact. We also observed severe damage on properties at various surveyed locations, especially in poorly engineered coastal structures, i.e., fishery shelters.
An important survey finding was the remarkable level of tsunami awareness among the population of the surveyed coastlines. Most people moved away from the shores after noticing the sea withdrawal, which may be considered a successful self-evacuation. Unfortunately, an older woman was reported dead after failing to resist strong currents generated by the tsunami.
The eastern Aegean coastal settlements experienced three significant normal-faulting events in the last decade, i.e., 12 June 2017 Lesvos-Karaburun (Mw 6.3) 20 July 2017 Bodrum-Kos (Mw 6.6), and 30 October 2020 Aegean Sea (Mw 6.6), generating tsunamis. The first two tsunami events occurred at approximately 110 km north–northwest and south–southeast from the 30 October earthquake’s epicenter. The former event caused only minor impact with observed coastal amplitudes less than 0.5 m in Plomari town and surrounding areas in Greece, and Karaburun and Foça towns in Turkey. The second event, the Bodrum-Kos tsunami, resulted in a more remarkable impact with significant boat and property damage in Bodrum Peninsula, Turkey, and Kos Island, Greece, showing similarities with the latest tsunami. The tsunami impact was focused on Gümbet Bay on the southern coast of Bodrum with a maximum runup of 1.9 m. More considerable tsunami inundation was observed in several streambeds in the small bays, reaching 280 m. The inundation was limited only to the eastern part of the Kos Island, where the amphora-shaped bay of the Kos Port with a narrow entrance was the worst-hit area on the island. Both events showed highly localized tsunami effects with runup heights less than 5 m and first waves arriving at the nearest coast within minutes. The tsunami impact was the highest in the last event, with larger runup and inundation causing extensive loss of properties, damage to marine vessels, and a casualty. It was fortunate that this event occurred during a pandemic and in autumn, i.e., it could have caused a significant number of injured and casualties if it had occurred during the regular summer season, considering beaches of the Aegean Sea during summer times. The observed increase in the tsunami awareness in the affected coastal areas, where it was deficient during the 2017 Bodrum-Kos event (Arikawa et al. 2017; Dogan et al. 2019), is another important finding for future social preparedness.
Acknowledgements
The authors acknowledge Yüksel Proje International Co. for significant and invaluable support, which enabled the field survey to be quick, secure, safe, and effective under pandemic conditions. The authors also acknowledge EMAY International Engineering Co. for considerable support to the expenses for the effective survey. Acknowledgements are extended to several institutions and numerous individuals for their supports at different phases of post-tsunami field survey works; the institutions and/or entities are TÜBİTAK (Project No: 119Y419 and Project No: 5200101), METU, Yıldız Technical University, Kocaeli University, İstanbul Metropolitan Municipality, Dokuz Eylül University, İzmir Metropolitan Municipality, Çeşme Municipality, Seferihisar Municipality, and Dolfen Consultancy and Engineering Company. The distinguished individuals are Dr. Nikos Kalligeris from National Observatory of Athens, General Manager of Sığacık Teos Marina Mr. Faruk Günlü and Technical Director of Sığacık Teos Marina Mr. Özgür Uğan, General Manager of Port Alaçatı Marina Ms. Deniz Şahin, General Manager of Çeşme Marina Mr. Can Akalkan, Dr. Hasan Gökhan Güler, Civil Engineer MSc. Cem Bingöl, Civil Engineer MSc. Mehmet Sedat Gözlet, Geomatic Engineers Özgür Şahin Sarı and Seçkin Demirel, Geology Engineer Evrens Yapar and Geophysical Engineer MSc. Evrim Yavuz, Civil Engineer Yurttabir Özel, Mapping Technicians Mr. Erhan Yükselen and Mr. Ömer Mede. The eyewitnesses, Temel Okyar, Mehmet Ali Okyar, Nejat Demirkıran, Aydın Tunca, Mehmet Yarar, Zuhal Karabey, Mustafa Gül, Cengiz Özkan, are also acknowledged for their close cooperation.
Appendix 1
See Table 1.
Appendix 2
See Table 2.
Appendix 3
Funding
Yüksel Proje International Co. provided significant and invaluable cash support and paid a considerable amount of survey and travel/accommodation expenses of the METU team members. EMAY International Engineering Co. provided considerable support to the survey expenses. The travel expenses of Yalcin Yuksel and Cihan Şahin are covered by TÜBİTAK Project No: 5200101. TÜBİTAK Project No: 119Y419 partly supported the field expenses. In-kind support of Çeşme and Seferihisar municipalities to perform the measurements are other indirect funding to the survey.
Data Availability
The preliminary results of the first field survey (rapid survey on the 2 days after the earthquake) were published as a preliminary report (http://www.tsunami-ege.com/20201031_samos_izmir_tsunami_report.pdf and https://drive.google.com/file/d/1HzVFjMsZ5zei2UTAoIdrcWFtPpzGr8U9/view?usp=sharing) to share the field observations with the related global research community. The preliminary report’s data have been updated with accurate measurements and detailed interpretations of eyewitness interviews obtained in the next field surveys and presented comprehensively in this paper.
Declaration
Conflict of interest
The authors have no conflicts of interest.
Footnotes
Publisher’s Note
Springer Nature remains neutral with regard to jurisdictional claims in published maps and institutional affiliations.
Change history
6/10/2021
A Correction to this paper has been published: 10.1007/s00024-021-02753-8
References
- AFAD (2020). Disaster and Emergency Management Authority (AFAD), Ministry of Interiors, Ankara-Turkey. http://deprem.afad.gov.tr.
- Anadolu Agency (2020). https://www.aa.com.tr/tr/yasam/kismi-tsunamide-olen-kadinin-oglu-ile-torunu-yasadiklarini-anlatti/2030786#. Accessed 03 Nov 2020.
- Aktar M, Karabulut H, Ozalaybey S, Childs D. A conjugate strike-slip fault system within the extensional tectonics of Western Turkey. Geophysical Journal International. 2007;171(3):1363–1375. doi: 10.1111/j.1365-246X.2007.03598.x. [DOI] [Google Scholar]
- Altınok Y, Alpar B, Ozer N, Gazioglu C. 1881 and 1949 earthquakes at the Chios-Cesme Strait (Aegean Sea) and their relation to tsunamis. Natural Hazards and Earth System Sciences. 2005;5:717–725. doi: 10.5194/nhess-5-717-2005. [DOI] [Google Scholar]
- Altınok Y, Alpar B, Ozer N, Vardar H. Revision of the tsunami catalogue affecting Turkish coasts and surrounding regions. Natural Hazards and Earth System Sciences. 2011;11(2):273–291. doi: 10.5194/nhess-11-273-2011. [DOI] [Google Scholar]
- Altınok Y, Ersoy S. Tsunamis observed on and near the Turkish coast. Natural Hazards. 2000;21:185–205. doi: 10.1023/A:1008155117243. [DOI] [Google Scholar]
- Ambraseys NN. Data for the investigation of the seismic sea-waves in the Eastern Mediterranean. Bulletin of the Seismological Society of America. 1962;52(4):895–913. [Google Scholar]
- Ambraseys N, Synolakis C. Tsunami catalogs for the Eastern Mediterranean, revisited. Journal of Earthquake Engineering. 2010;14(3):309–330. doi: 10.1080/13632460903277593. [DOI] [Google Scholar]
- Arikawa, T., Guler, H. G., & Yalciner, A. C. (2017). Comparison of human response against earthquake and tsunami. In American Geophysical Union Fall Meeting, December 11–15, 2017, New Orleans, USA.
- Beisel S, Chubarov L, Didenkulova I, Kit E, Levin A, Pelinovsky E, et al. The 1956 Greek tsunami recorded at Yafo, Israel, and its numerical modeling. Journal of Geophysical Research Oceans. 2009;114:C09002. doi: 10.1029/2008JC005262. [DOI] [Google Scholar]
- Bozkurt E. Origin of NE-trending basins in western Turkey. Geodinamica Acta. 2003;16:61–81. doi: 10.1016/S0985-3111(03)00002-0. [DOI] [Google Scholar]
- Chatzipetros A, Kiratzi A, Sboras S, Zouros N, Pavlides S. Active faulting in the north-eastern Aegean Sea Islands. Tectonophysics. 2013;597:106–122. doi: 10.1016/j.tecto.2012.11.026. [DOI] [Google Scholar]
- Dewey JF, Şengor AMC. Aegean and surrounding regions: complex multiplate and continuum tectonics in a convergent zone. Geological Society of America Bulletin. 1979;90:84–92. doi: 10.1130/0016-7606(1979)90<84:AASRCM>2.0.CO;2. [DOI] [Google Scholar]
- Dogan GG, Annunziato A, Papadopoulos GA, Guler HG, Yalciner AC, Cakir TE, et al. The 20th July 2017 Bodrum-Kos Tsunami field survey. Pure and Applied Geophysics. 2019;176:2925–2949. doi: 10.1007/s00024-019-02151-1. [DOI] [Google Scholar]
- Dominey-Howes D. Documentary and geological records of tsunamis in the Aegean Sea region of Greece and their potential value to risk assessment and disaster management. Natural Hazards. 2002;25(3):195–224. doi: 10.1023/A:1014808804611. [DOI] [Google Scholar]
- Emre Ö, Duman TY, Özalp S, Elmacı H, Olgun Ş, Şaroğlu F. New active fault map of Turkey, Mineral Research and Exploration General Directorate (MTA) Ministry of Energy; 2013. [Google Scholar]
- Emre, O., Ozalp, S., Duman, T. Y. (2011). 1:250,000 scale active fault map series of Turkey, İzmir (NJ 35-7) Quadrangle. Serial number: 6, General Directorate of Mineral Research and Exploration, Ankara.
- Evelpidou N, Pavlopoulos K, Vouvalidis K, Syrides G, Triantaphyllou M, Karkani A, Paraschou T. Holocene palaeogeographical reconstruction and relative sea-level changes in the southeastern part of the island of Samos (Greece) Comptes Rendus Geoscience. 2019;351(6):451–460. doi: 10.1016/j.crte.2019.09.001. [DOI] [Google Scholar]
- Galanopoulos AG. Tsunamis observed on the coasts of Greece from antiquity to present time. Annals of Geophysics. 1960;13(3–4):369–386. [Google Scholar]
- Jackson J. Active tectonics of the Aegean region. Annual Review of Earth and Planetary Sciences. 1994;22(1):239–271. doi: 10.1146/annurev.ea.22.050194.001323. [DOI] [Google Scholar]
- Jackson JA, McKenzie D. Rates of active deformation in the Aegean Sea and surrounding regions. Basin Research. 1988;1:121–128. doi: 10.1111/j.1365-2117.1988.tb00009.x. [DOI] [Google Scholar]
- KOERI (2020). Kandilli Observatory and Earthquake Research Institute, Istanbul-Turkey. http://koeri.boun.edu.tr.
- Kuran U, Yalciner AC. Crack propagations, earthquakes and tsunamis in the vicinity of Anatolia. In: Tinti S, editor. Tsunamis in the world. Advances in natural and technological hazards research. Springer; 1993. pp. 159–175. [Google Scholar]
- Minoura K, Imamura F, Kuran U, Nakamura T, Papadopoulos GA, Takahashi T, Yalciner AC. Discovery of Minoan tsunami deposits. Geology. 2000;28(1):59–62. doi: 10.1130/0091-7613(2000)028<0059:DOMTD>2.0.CO;2. [DOI] [Google Scholar]
- Okal EA, Synolakis CE, Uslu B, Kalligeris N, Voukouvalas E. The 1956 earthquake and tsunami in Amorgos, Greece. Geophysical Journal International. 2009;178(3):1533–1554. doi: 10.1111/j.1365-246X.2009.04237.x. [DOI] [Google Scholar]
- Papadopoulos GA, Chalkis BJ. Tsunamis observed in Greece and the surrounding area from antiquity up to the present times. Marine Geology. 1984;56(1–4):309–317. doi: 10.1016/0025-3227(84)90022-7. [DOI] [Google Scholar]
- Papadopoulos GA, Gràcia E, Urgeles R, Sallares V, De Martini PM, Pantosti D, et al. Historical and pre-historical tsunamis in the Mediterranean and its connected seas: geological signatures, generation mechanisms and coastal impacts. Marine Geology. 2014;354:81–109. doi: 10.1016/j.margeo.2014.04.014. [DOI] [Google Scholar]
- Papadopoulos GA, Pavlides SB. The large 1956 earthquake in the South Aegean: macroseismic field configuration, faulting, and neotectonics of Amorgos Island. Earth and Planetary Science Letters. 1992;113(3):383–396. doi: 10.1016/0012-821X(92)90140-Q. [DOI] [Google Scholar]
- Papazachos BC, Koutitas C, Hatzidimitriou PM, Karacostas BG, Papaioannou CA. Source and short-distance propagation of the July 9, 1956 southern Aegean tsunami. Marine Geology. 1985;65(3–4):343–351. doi: 10.1016/0025-3227(85)90064-7. [DOI] [Google Scholar]
- Papazachos BC, Papadimitriou EE, Kiratzi AA, Papazachos CB, Louvari EK. Fault plane solutions in the Aegean Sea and the surrounding area and their tectonic implication. Bollettino Geofisica Teorica Applicata. 1998;39(3):199–218. [Google Scholar]
- Ring U, Gessner K, Thomson S. Variations in fault-slip data and cooling history reveal corridor of heterogeneous backarc extension in the eastern Aegean Sea region. Tectonophysics. 2017;700:108–130. doi: 10.1016/j.tecto.2017.02.013. [DOI] [Google Scholar]
- Tan O, Eleftheria EL, Pamucçu Z, Karakostas V, Yörük A, Leptokaropoulos K. A detailed analysis of microseismicity in Samos and Kusadasi (Eastern Aegean Sea) Acta Geophysica. 2014;62(6):1283–1309. doi: 10.2478/s11600-013-0194-1. [DOI] [Google Scholar]
- Taymaz T, Jackson J, McKenzie D. Active tectonics of the north and central Aegean Sea. Geophysical Journal International. 1991;106(2):433–490. doi: 10.1111/j.1365-246X.1991.tb03906.x. [DOI] [Google Scholar]
- Tepe Ç, Sözbilir H. Tectonic geomorphology of the Kemalpaşa Basin and surrounding horsts, southwestern part of the Gediz Graben, Western Anatolia, Anatolia. Geodinamica Acta. 2017;29(1):70–90. doi: 10.1080/09853111.2017.1317191. [DOI] [Google Scholar]
- Tinti S, Maramai A, Graziani L. A new version of the European tsunami catalogue: updating and revision. Natural Hazards and Earth System Sciences. 2001;1:255–262. doi: 10.5194/nhess-1-255-2001. [DOI] [Google Scholar]
- Triantafyllou I, Gogou M, Mavroulis S, Lekkas E, Papadopoulos GA, Thravalos M. The tsunami caused by the 30 October 2020 Samos (Aegean Sea) Mw7.0 earthquake: hydrodynamic features, source properties and impact assessment from post-event field survey and video records. Journal of Marine Science and Engineering. 2021;9:68. doi: 10.3390/jmse9010068. [DOI] [Google Scholar]
- UNESCO (2014). International Tsunami Survey Team (ITST) Post-Tsunami Survey Field Guide. 2nd Edition. IOC Manuals and Guides No.37, Paris: UNESCO 2014 (English).
- Wessel P, Smith WH. New, improved version of generic mapping tools released. Eos Transactions American Geophysical Union. 1998;79(47):579–579. doi: 10.1029/98EO00426. [DOI] [Google Scholar]
- Yalciner AC, Kuran U, Akyarli A, Imamura F. An investigation on the propagation of tsunamis in the Aegean Sea by mathematical modeling. In: Tsuchiya Y, Shuto N, editors. Tsunami: progress in prediction, disaster prevention and warning. Advances in natural and technological hazards research. Springer; 1995. pp. 55–70. [Google Scholar]
Associated Data
This section collects any data citations, data availability statements, or supplementary materials included in this article.
Data Availability Statement
The preliminary results of the first field survey (rapid survey on the 2 days after the earthquake) were published as a preliminary report (http://www.tsunami-ege.com/20201031_samos_izmir_tsunami_report.pdf and https://drive.google.com/file/d/1HzVFjMsZ5zei2UTAoIdrcWFtPpzGr8U9/view?usp=sharing) to share the field observations with the related global research community. The preliminary report’s data have been updated with accurate measurements and detailed interpretations of eyewitness interviews obtained in the next field surveys and presented comprehensively in this paper.


