

Abstract
Background:
Lead (Pb) is widespread and exposure to this non-essential heavy metal can cause multiple negative health effects; however the mechanisms underlying these effects remain incompletely understood.
Objectives:
To identify plasma metabolomic signatures of Pb exposure, as measured in blood and toenails.
Methods:
In a subset of men from the VA Normative Aging Study, mass-spectrometry based plasma metabolomic profiling was performed. Pb levels were measured in blood samples and toenail clippings collected concurrently. Multivariable linear regression models, smoothing splines and Pathway analyses were employed to identify metabolites associated with Pb exposure.
Results:
In 399 men, 858 metabolites were measured and passed QC, of which 154 (17.9%) were significantly associated with blood Pb (p < 0.05). Eleven of these passed stringent correction for multiple testing, including pro-hydroxy-pro (β(95%CI): 1.52 (0.93,2.12), p = 7.18×10⁻⁷), N-acetylglycine (β(95%CI): 1.44 (0.85,2.02), p = 1.12×10⁻⁶), tartarate (β(95%CI): 0.68 (0.35,1.00), p = 4.84×10⁻⁵), vanillylmandelate (β(95%CI): 1.05 (0.47,1.63), p = 4.44×10⁻⁷), and lysine (β(95%CI): 1.88 (−2.8,−0.95), p = 9.10×10⁻⁵). A subset of 48 men had a second blood sample collected a mean of 6.1 years after their first. Three of the top eleven metabolites were also significant in this second blood sample. Furthermore, we identified 70 plasma metabolites associated with Pb as measured in toenails. Twenty-three plasma metabolites were significantly associated with both blood and toenail measures, while others appeared to be specific to the biosample in which Pb was measured. For example, benzanoate metabolism appeared to be of importance with the longer-term exposure assessed by toenails.
Discussion:
Pb exposure is responsible for 0.6% of the global burden of disease and metabolomics is particularly well-suited to explore its pathogenic mechanisms. In this study, we identified metabolites and metabolomic pathways associated with Pb exposure that suggest that Pb exposure acts through oxidative stress and immune dysfunction. These findings help us to better understand the biology of this important public health burden.
Keywords: Metabolomics, Lead (Pb), Lead exposure, Normative Aging Study (NAS), Heavy metal
1. Introduction
Lead (Pb) is a non-essential heavy metal whose toxic effects have been recognized for centuries (Wani et al., 2015). It remains ubiquitous in the environment due to its widespread usage in industrial and manufacturing processes such as the production of fuels, paints, and plastics and through contaminated phosphate fertilizers (Hoffman et al., 2015; Garcia-Leston et al., 2010). Exposure occurs primarily through the ingestion of contaminated food, dust and drinking water, the inhalation of contaminated air, metallic dust, aerosols and vapors, dermal contact, and through smoking (Jomova and Valko, 2011). Consequently, Pb constitutes one of the most widespread environmental pollutants in the world and, with no known beneficial physiological role (Jomova and Valko, 2011), represents an important global public health burden (Metryka et al., 2018).
Crucially, Pb accrues in the human body, and exposures during early life can continue to result in adverse health effects throughout the life-span (Bakulski et al., 2014). In particular, Pb deposited in bone, where it has a half-life of up to 30 years in cortical bone and 8 years in trabecular bone, can reenter the circulation due to increased bone turnover later in life, thereby resulting in re-exposure (Hu et al., 1998). Pb can be highly toxic even in trace amounts (Jomova and Valko, 2011) and its bioaccumulation in the human body can be detrimental to health in numerous ways. Heavy metals such as Pb can undergo redox cycling, creating reactive species and leading to notable changes in DNA structure (Bagchi et al., 1995). Thus, Pb is classified as a possible human carcinogen (group2b) and its inorganic compounds as probable carcinogens (group 2a) based on an observed increase in the risk of lung, stomach, kidney and brain cancers. Pb exposure has also been linked with high blood pressure, heart disease, kidney disease, reduced fertility, cardiovascular disease, and neurodegenerative disorders (Bakulski et al., 2014; Kelly et al., 2013). Furthermore, the immune system has been shown to be uniquely sensitive to the effects of Pb, with evidence that exposures negatively impacts almost all of its functions (Metryka et al., 2018; Fischbein et al., 1993).
Although regulatory actions over the last two decades have dramatically reduced de novo exposure to Pb, environmental levels of Pb in the United States are no longer decreasing, and the health effects of previous exposures persist (Bakulski et al., 2014). Therefore, it is vital to better understand the impacts of Pb exposure on the human body. Metabolomics, the systematic profiling of all the small molecules in a biological system (Fiehn, 2002; Patti et al., 2012), is currently underutilized in the study of heavy metal exposure. Genomic, epigenetic, transcriptomic, and proteomic variability leads to alterations in metabolite concentrations in biological fluids and tissues. Metabolomics therefore, as the downstream ‘ome’ most closely related to phenotype, provides an integrated profile of biological status reflecting the ‘net results of these preceding omes’ and, crucially, their environmental interactions. By capturing the perturbations of multiple metabolic pathways, the metabolome enables a functionally relevant, holistic exploration of the health impacts of environmental exposures such as Pb (Stringer et al., 2016). As such, metabolomics profiling of blood represents a powerful tool to increase mechanistic understanding of the pathobiology of Pb exposure. However, existing literature on the metabolomics of Pb exposure is limited (Eguchi et al., 2018).
In this study, we perform mass-spectrometry based plasma metabolomic profiling of a large, well-characterized cohort of men from the US Department of Veterans Affairs (VA) Normative Aging Study (NAS) with comprehensive clinical and environmental exposure measurements to explore the signature changes in the blood metabolome related to Pb exposure.
2. Methods
2.1. Study population
The VA Normative Aging Study (NAS) is a longitudinal study of aging in men based in Boston, Massachusetts. The NAS recruited 2280 men aged 21–80 from 1961 to 1970 who were free of known chronic disease and has been following them since (Payton et al., 1998). Self-reported information regarding medical history, smoking history, dietary intake, and other health-related factors has been collected periodically throughout follow-up. Participants have routine physical examinations and laboratory tests every 3–5 years. At study visits throughout all of follow up, a 7-ml sample of venous blood is obtained from each participant after fasting and collected in a trace metal- and Pb-free tube containing ethylenediaminetetraacetic acid. The samples are spun at 3000 revolutions per minute (RPMs) for 15 min. Subsequently, serum and plasma samples are placed in 1.8 ml Nunc tubes for long-term storage at −80 °C. Between 1992 and 2014, 825 of 1286 active NAS participants provided toenail clippings during study visits. If possible, toenails were collected from all toes and were stored in locked facilities at room temperature (Wu et al., 2019). The NAS received written informed consent from study participants at each visit, as well as approval from the Review Boards of all institutions involved in data collection and analysis.
For the current study, we selected a subset of 399 NAS men with measured blood Pb levels and concurrent blood samples collected between 2000 and 2008 that were available and suitable for metabolomic profiling (samples collected prior to 2000 were not suitable for profiling due to their storage conditions). Three hundred and ten of these men had toenail samples, in which Pb could be measured, collected at the same study visit (between 2000 and 2008). Forty eight of the 399 had a second blood sample with measured Pb levels and metabolomic profiling collected between 2002 and 2008 (Supplementary Fig. 1).
2.2. Metabolomic profiling
Metabolomic profiling was conducted by Metabolon Inc. (Durham, NC, USA) using non-targeted high resolution Ultrahigh Performance Liquid Chromatography Coupled Tandem Mass Spectroscopy (UPLC-MS/MS) with Thermo Fisher Q-exactives and accurate mass data enabling the broadest coverage of the metabolome. The methods have been described in detail previously (Evans et al., 2014). In brief, the four platforms were as follows: (1) UPLC-MS/MS under positive ionization for early eluting metabolites; (2) UPLC-MS/MS under positive ionization for late eluting metabolites; (3) UPLC-MS/MS under negative ionization; and (4) UPLC-MS/MS, polar platform (negative ionization). Metabolites were identified by their mass-to-charge ratio (m/z), retention time (rt), and through a comparison to a library of purified known standards. Metabolites were quantified using area-under-the-curve and processed according to our in-house standard quality control (QC) pipeline (Kelly et al., 2018), which retains the maximum number of metabolites, including those with a high level of missingness as these may represent biologically important markers of exposure in a subset of the population, while excluding statistically uninformative metabolites. Missing values were imputed with half the minimum intensity for a given metabolite (Supplementary Fig. 2), and data were log transformed and Pareto scaled. Metabolites of unknown identity or with an interquartile range of zero after QC were considered uninformative and excluded from analysis.
2.3. Blood Pb
Whole blood samples were collected in lead-free tubes containing edentate calcium disodium (EDTA). Samples were digested with nitric acid and centrifuged then analyzed by Zeeman background-corrected flameless atomic absorption at ESA Laboratories, Inc., Chelmsford, Massachusetts. Analysis was calibrated with National Institute of Standards and Technology Blood Pb Standard Reference Materials (Bakulski et al., 2014)(further information in Supplementary Methods). The half-life of Pb in blood is approximately 30 days and reflects both recent intake and equilibration with lead stored in the body in bone (Bakulski et al., 2014; Mordukhovich et al., 2012; Longnecker et al., 1993).
2.4. Toenail Pb
Toenail clippings were pre-cleaned by sonicating for 15 min in approximately 10 mL (mL) of 1% Triton X-100 solution to remove extraneous contaminants. The samples were rinsed with distilled deionized water, dried at 60 °C for 24 h in a drying oven, then dissolved in HNO3 acid for 48 h and diluted to 5 mL with deionized water. Samples were analyzed by inductively coupled plasma-mass spectrometry (ICP-MS) utilizing the Agilent 8800 ICP-MS Triple Quad (Agilent technologies, Inc., Delaware, USA) (Wu et al., 2019) (further information in Supplementary Methods). The half-life of Pb in toenails is up to 18 months and measurement reflects the last six to twelve months of exposure. (Bakulski et al., 2014; Mordukhovich et al., 2012; Longnecker et al., 1993).
2.5. Statistical analysis
ANOVA or chi-squared tests were used to look for differences across blood Pb level categories in continuous and categorical baseline variables, respectively. Principal components analysis (PCA), which converts potentially correlated variables, such as metabolites, into a smaller number of uncorrelated principal components via orthogonal transformation, was used to visualize the metabolomics data to search for clusters of individuals with similar global metabolomic profiles, and to determine whether these profiles corresponded to higher blood Pb levels.
Independent linear regression models adjusting for age at blood collection, height, weight, smoking status (never, regular or former) and race (White and Other, due to the small number of men of non-white races) were run for each metabolite to identify those associated with blood Pb as a continuous variable. To adjust for multiple testing while also accounting for the high correlation between metabolites that are closely connected through interlinked biological pathways, we employed the “number of effective tests approach” (Li et al., 2012; Nyholt, 2004). This method determines the number of principal components required to explain a given percentage of the variance in the data (i.e. the number of effective tests). The adjusted p-value threshold was then calculated as α/m where α denotes the nominal p-value threshold of 0.05, and m denotes the number of effective (i.e. independent) tests. We explored thresholds of 75% (p < 7.58 × 10⁻⁴), 95% (p <2.44 × 10⁻⁴) and 99% (p < 1.68 × 10⁻⁴) variance explained for these analyses as well as a nominal α of 0.05. For the top metabolites passing multiple testing correction, we employed smoothing splines using the ‘drsmooth’ R package, to visualize a dose-response relationship between metabolite intensity and blood Pb level. A subset of men had a second blood sample collected at least one year after their initial sample in which blood Pb was measured and metabolomics profiling was performed; in these men we reran the regression models for our top hits to determine whether the Pb-metabolite associations were robust over time. We used the same methods to identify associations between blood metabolites and Pb exposure, as measured in toenail samples, which indicate medium term exposure, and compared these findings to those using blood Pb which may be indicative of shorter-term exposure.
All analyses were conducted using R version 3.6.0. Significant metabolites were further explored using the ‘Pathway Analysis’ functionality in MetaboAnalyst 4.0 (Chong et al., 2018), which takes both over-representation analyses and pathway topology into account, and visualized using the Metscape Bioinformatics tool (Karnovsky et al., 2012), a plug in for Cytoscape (Shannon et al., 2003).
3. Results
3.1. Study population
A total of 399 men were eligible for this study (Table 1). All had blood samples collected between May 2000 and July 2008. The median and interquartile range of blood Pb levels in the population were 3.00 μg/dL and 2.00–4.00 μg/dL, respectively (Supplementary Table 1). The majority of men (n = 290, 72.7%) had low levels of Pb in their blood (1–4 μg/dL), 17 (4.3%) men had no trace of Pb in their blood, 81 (20.3%) had moderate levels, and 11 (2.8%) had high levels, including one participant with a level of 29 μg/dL. There was no difference in the baseline characteristics (age, height, weight, race or smoking status) of these 399 men by blood Pb level.
Table 1.
Baseline characteristics of 399 men from NAS, stratified by Blood Pb Level.
| Characteristic at blood collection | Whole Blood Lead (μg/dL) | p-value | ||||
|---|---|---|---|---|---|---|
| 0 | > 0 to < 5 | 5 to < 10 | 10 to 30 | |||
| n = 17 | n = 290 | n = 81 | n = 11 | |||
| Age (yrs) | mean [SD] | 77.7 [6.0] | 74.4 [6.6] | 77.0 [7.0] | 75.5 [7.6] | 0.105 |
| Height (Inches) | mean [SD] | 68.7 [2.2] | 68.5 [2.9] | 68.2 [2.3] | 67.3 [2.3] | 0.117 |
| Weight (Pounds) | mean [SD] | 186.4 [24.4] | 185.7 [34.0] | 177.8 [26.9] | 186.1 [20.6] | 0.151 |
| BMI | Underweight [<18.5 kg/m2] (%) | 0 (0) | 3 (1) | 0 (0) | 0 (0) | 0.276 |
| Healthy weight [18.5–25 kg/m2] (%) | 2 (11.8) | 79 (27.2) | 23 (28.4) | 1 (9.1) | ||
| Overweight [25–30 kg/m2] (%) | 11 (64.7) | 134 (46.2) | 47 (58) | 7 (63.6) | ||
| Obese [>30 kg/m2] (%) | 4 (23.5) | 74 (25.5) | 11 (13.6) | 3 (27.3) | ||
| Race | White n (%) | 17 (100) | 286 (98.6) | 78 (96.3) | 10 (90.9) | 0.143 |
| Other n (%) | 0 (0) | 4 (1.4) | 3 (3.7) | 1 (0.1) | ||
| Smoking Status | Never n (%) | 10 (58.8) | 88 (30.3) | 22 (27.2) | 2 (18.2) | 0.238 |
| Regular Smoker n (%) | 0 (0) | 12 (4.1) | 5 (6.2) | 0 (0) | ||
| Former Smoker n (%) | 7 (41.2) | 190 (65.5) | 54 (66.7) | 9 (81.8) | ||
A total of 1301 metabolites were measured in the plasma samples. After QC and data processing, including the exclusion of metabolites of unknown identity (n = 320) and of metabolites with zero variance (n = 123, of which 106 were xenobiotics), 858 metabolites were included in the analyses The greatest proportion of metabolites (49.5%) were lipids, as defined by Metabolon super pathway, followed by amino acids (21.9%) and xenobiotics (13.8%) (Supplementary Fig. 3). PCA identified no obvious clustering by blood Pb exposure category across the first two principal components which explain the largest amount of variance in the metabolite data (PC1: 9.1% and PC2: 7.4% of the variance, respectively (Supplementary Fig. 4)).
3.2. Short-term measures of Pb in blood
Multivariable linear regression models (adjusting for age at blood collection, height, weight, smoking status and race) identified 154 of 858 (17.9%) metabolites as associated with blood Pb levels as a continuous measure at p < 0.05 (Supplementary Table 2). Reflecting the overall composition of the measured metabolites, these hits were primarily lipids (42.9%), amino acids (26.6%) and xenobiotics (9.7%) (Fig. 1). Pathway analyses using MetaboAnalyst 4.0 (Chong et al., 2018) determined that these 154 metabolites were enriched for metabolites of the glycerophospholipid metabolism (enrichment p = 0.018) and sphingolipid metabolism (enrichment p = 0.069) pathways.
Fig. 1.
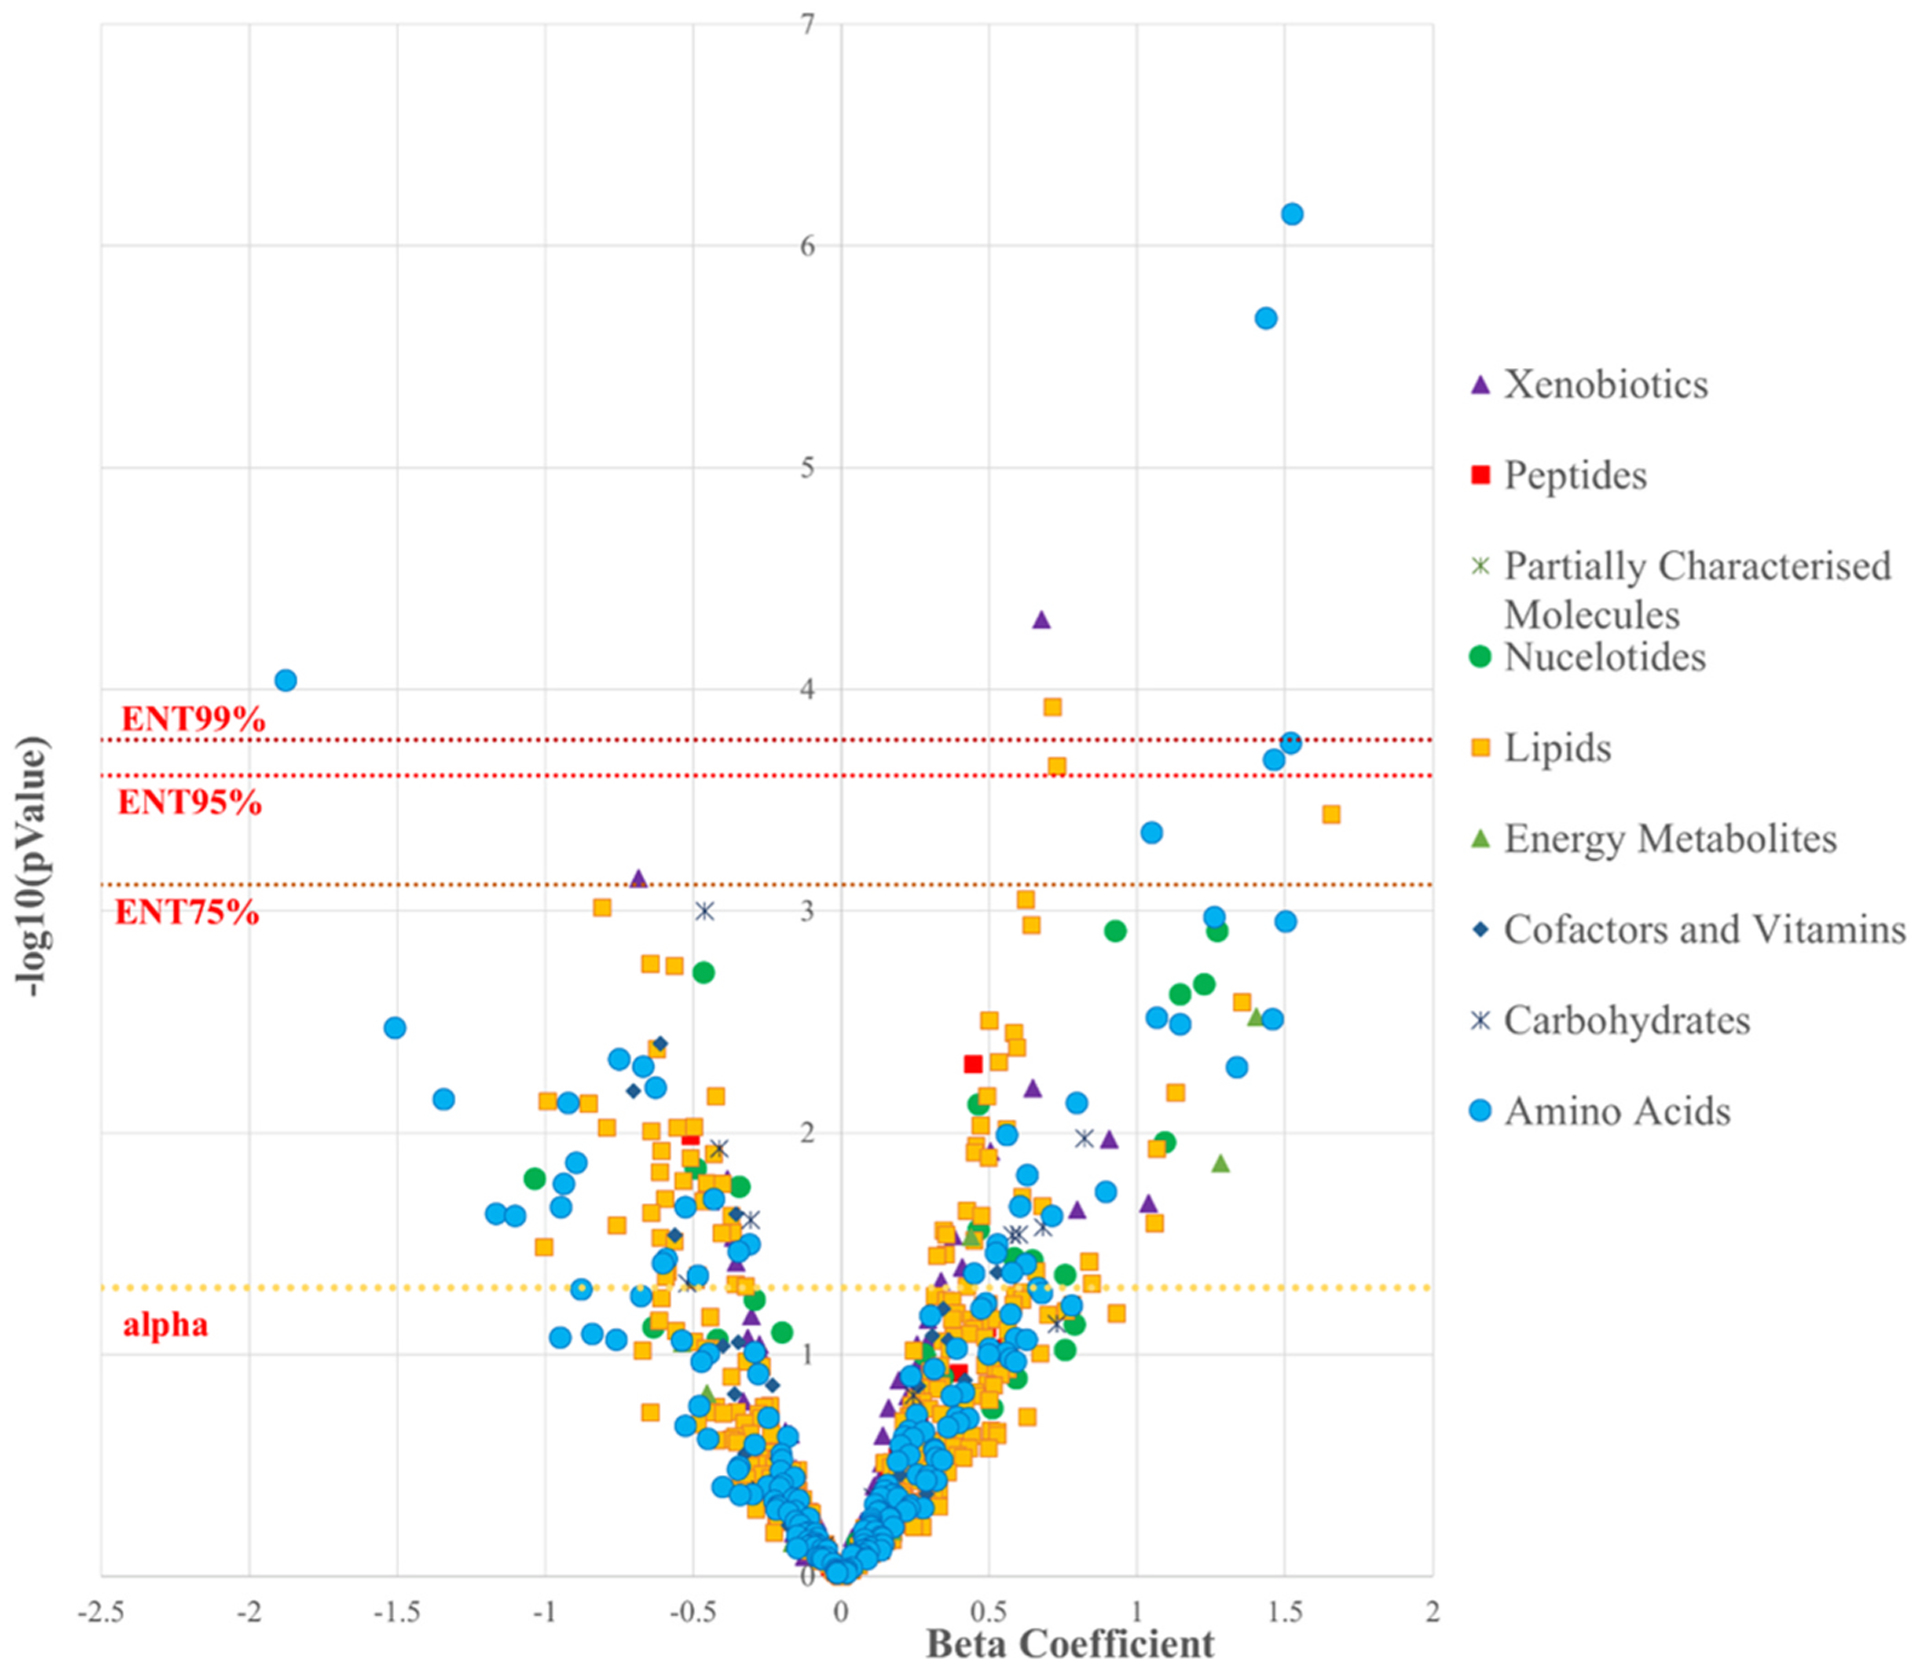
Volcano Plot demonstrating the association between continuous Pb blood levels and 858 metabolites colored according to Metabolon-defined Superpathway
There was evidence of high correlation among many of the 154 significant metabolites (Supplementary Fig. 5). To account for multiple testing, while taking these correlations into account, we explored an effective number of tests (ENT) threshold of 75% variance explained (66 principal components corresponding to a p-value threshold of p < 7.58 × 10⁻⁴); 95% (205 principal components corresponding to a p-value threshold of p < 2.44 × 10⁻⁴), and 99% (297 principal components corresponding to a p-value threshold of p < 1.68 × 10⁻⁴). Eleven, eight, and five metabolites retained significance at the ENT75%, ENT95% and ENT99% thresholds, respectively. Of the top eleven metabolites, nine were higher among men with higher blood Pb levels, pro-hydroxy-pro (β (95% CI): 1.52 (0.93,2.12), p = 7.18 × 10⁻⁷), N-acetylglycine (β (95% CI), 1.44 (0.85,2.02), p = 1.12 × 10⁻⁶), tartarate (β (95% CI):0.68 (0.35,1), p = 4.84 × 10⁻⁵), suberate (C8-DC) (β (95% CI): 0.71 (0.35,1.07), p = 1.20 × 10⁻⁴), N-formylmethionine (β (95% CI): 1.52 (0.73,2.31), p = 1.76 × 10⁻⁴), hydroxyasparagine (β (95% CI): 1.46 (0.7,2.23), p = 2.09 × 10⁻⁴), hexanoylglycine (β (95% CI): 0.73 (0.35,1.11), p = 2.21 × 10⁻⁴), sphingomyelin (d18:2/16:0, d18:1/16:1) (β (95% CI): 1.66 (0.75,2.56), p = 3.66 × 10⁻⁴), and vanillylmandelate (VMA) (β (95% CI): 1.05 (0.47,1.63), p = 4.44 × 10⁻⁷). Two metabolites, lysine (β: 1.88 (−2.8,−0.95), p = 9.10 × 10⁻⁵) and theobromine (β: 0.69 (−1.08,−0.29), p = 7.07 × 10⁻⁴) were negatively associated with blood Pb levels. The numbers of metabolites passing the ENT thresholds were too small to apply pathway analyses.
We modeled the dose-response curves for the top eleven metabolites using smoothing splines (Fig. 2). These plots indicated a potential outlier, an individual with a blood Pb level of 29 μg/dL, which was almost double the next highest level (15 μg/dL). To ensure this individual was not driving the results, we conducted a sensitivity analysis excluding this individual. In the 398 remaining men; 192, 39, 26 and 23 metabolites were significant at thresholds of p < 0.05, ENT75%, ENT95%, and ENT99%, respectively. There was high consistency with the initial analysis including all 399 men, 138 metabolites were significant in both analyses at an alpha of 0.05. All of the top 39 hits at ENT75% in the subsample of 398 men were significant at a threshold of p < 0.05 in the total sample. Pro-hydroxy-pro, tartarate, N-acetyleglycine, lysine, and suberate (C10-DC) were the top five metabolites in both the full sample and the sensitivity analyses; and the significance of the association with blood Pb actually increased for these five metabolites after the removal of the outlier with concordant directions of effect (Table 2).
Fig. 2.
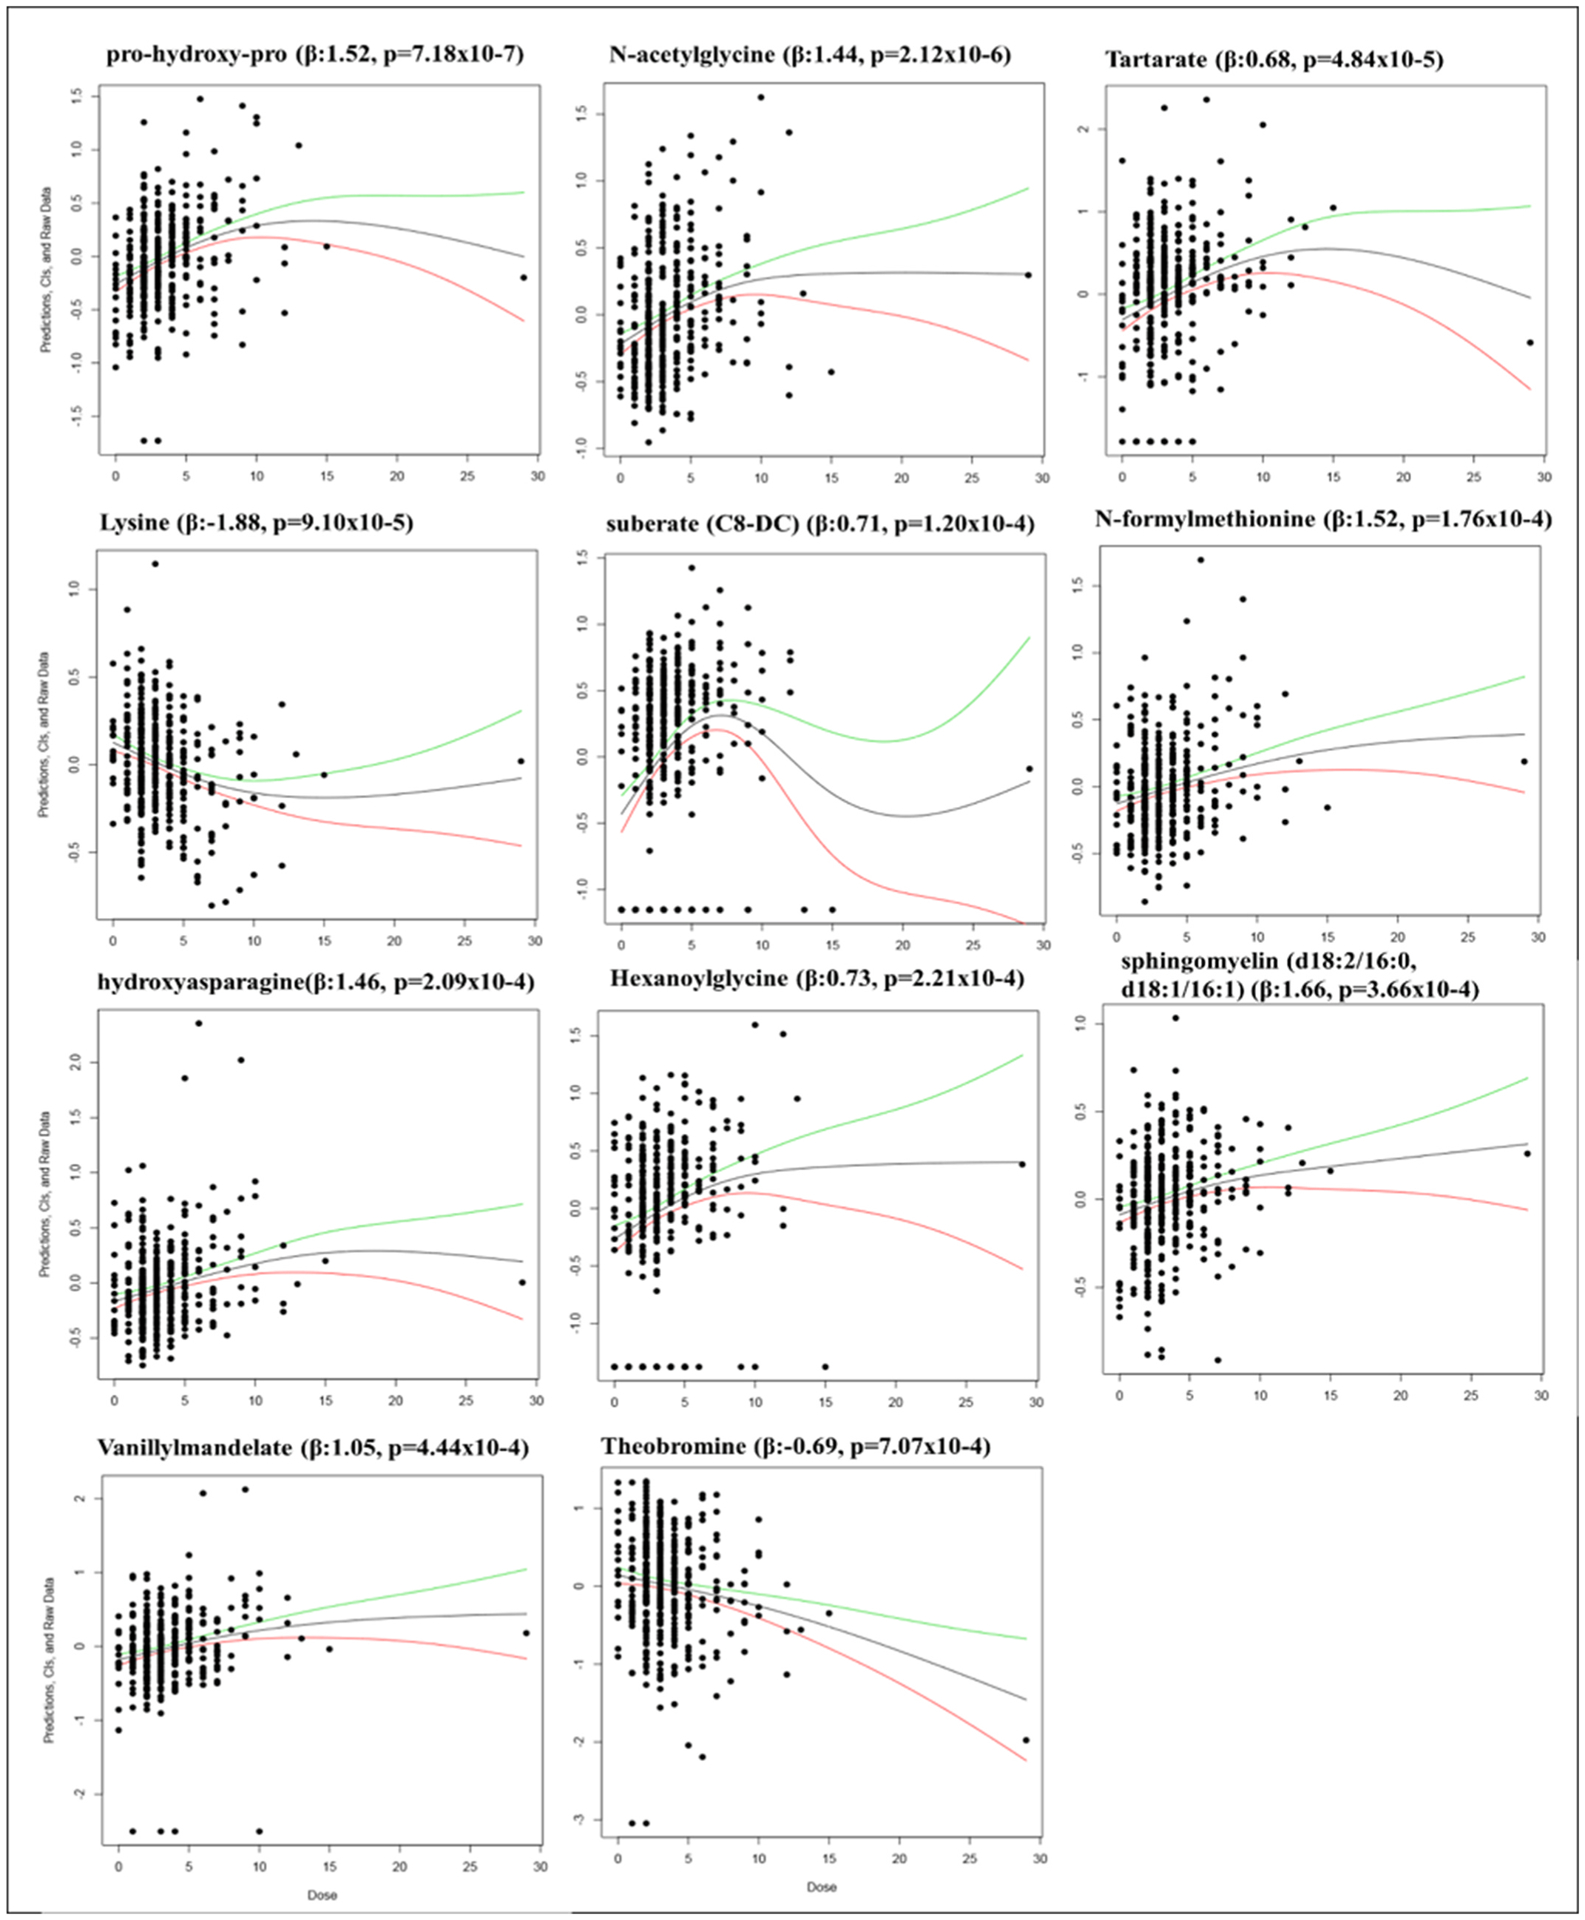
Dose-Response Splines for Eleven Top Metabolites Associated with Blood Pb levels in 399 men at ENT75%. Dose-response models with smoothing splines generated using the R package drsmooth; showing the spline-estimated dose-response function with its upper (green) and lower (red) 95 percent confidence bounds. This method does not adjust for confounders.
Table 2.
Top Metabolites Significantly Associated with Blood Pb Levels in the total sample and the subset excluding one outlier; Table includes all metabolites with p value reaching at least the ENT75% threshold in either dataset.
| Metabolite | Total Sample (n = 399) | SubSample (n = 398) | ||||||
|---|---|---|---|---|---|---|---|---|
| β (95%CI) | P-value | rank | Significance | β (95%CI) | P-value | rank | Significance | |
| pro-hydroxy-pro | 1.52 (0.93,2.12) | 7.18E-07 | 1 | **** | 1.59 (1.08,2.1) | 2.05E-09 | 1 | **** |
| N-acetylglycine | 1.44 (0.85,2.02) | 2.12E-06 | 2 | **** | 1.34 (0.83,1.84) | 3.86E-07 | 3 | **** |
| tartarate | 0.68 (0.35,1) | 4.84E-05 | 3 | **** | 0.74 (0.46,1.02) | 2.56E-07 | 2 | **** |
| lysine | −1.88 (−2.8,−0.95) | 9.10E-05 | 4 | **** | −1.91 (−2.71,−1.11) | 4.17E-06 | 4 | **** |
| suberate (C8-DC) | 0.71 (0.35,1.07) | 1.20E-04 | 5 | **** | 0.72 (0.41,1.03) | 7.50E-06 | 5 | **** |
| N-formylmethionine | 1.52 (0.73,2.31) | 1.76E-04 | 6 | *** | 1.43 (0.75,2.11) | 4.96E-05 | 9 | **** |
| hydroxyasparagine | 1.46 (0.7,2.23) | 2.09E-04 | 7 | *** | 1.48 (0.82,2.14) | 1.55E-05 | 7 | **** |
| hexanoylglycine | 0.73 (0.35,1.11) | 2.21E-04 | 8 | *** | 0.68 (0.34,1.01) | 8.17E-05 | 12 | **** |
| sphingomyelin (d18:2/16:0, d18:1/16:1) | 1.66 (0.75,2.56) | 3.66E-04 | 9 | ** | 1.45 (0.67,2.24) | 3.29E-04 | 30 | ** |
| vanillylmandelate (VMA) | 1.05 (0.47,1.63) | 4.44E-04 | 10 | ** | 1 (0.5,1.51) | 1.12E-04 | 15 | **** |
| theobromine | −0.69 (−1.08,−0.29) | 7.07E-04 | 11 | ** | −0.38 (−0.73,−0.03) | 3.27E-02 | 168 | * |
| sebacate (C10-DC) | 0.62 (0.26,0.99) | 8.84E-04 | 12 | * | 0.72 (0.4,1.03) | 1.01E-05 | 6 | **** |
| choline phosphate | −0.81 (−1.29,−0.33) | 9.64E-04 | 13 | * | −0.83 (−1.25,−0.42) | 8.71E-05 | 14 | **** |
| 3-phosphoglycerate | −0.46 (−0.74,−0.19) | 9.99E-04 | 14 | * | −0.49 (−0.73,−0.26) | 5.15E-05 | 10 | **** |
| N-acetylserine | 1.26 (0.51,2.01) | 1.07E-03 | 15 | * | 1.37 (0.72,2.02) | 4.11E-05 | 8 | **** |
| N-acetylalanine | 1.5 (0.61,2.4) | 1.11E-03 | 16 | * | 1.53 (0.75,2.3) | 1.35E-04 | 17 | **** |
| azelate (C9-DC) | 0.64 (0.26,1.03) | 1.16E-03 | 17 | * | 0.69 (0.36,1.02) | 5.64E-05 | 11 | **** |
| N6-carbamoylthreonyladenosine | 0.93 (0.37,1.49) | 1.23E-03 | 18 | * | 0.87 (0.38,1.35) | 5.24E-04 | 37 | ** |
| 5,6-dihydrouridine | 1.27 (0.51,2.04) | 1.24E-03 | 19 | * | 1.27 (0.61,1.94) | 2.00E-04 | 25 | *** |
| phosphoethanolamine | −0.65 (−1.05,−0.24) | 1.73E-03 | 20 | * | −0.69 (−1.04,−0.34) | 1.14E-04 | 16 | **** |
| glycerophosphoglycerol | −0.57 (−0.92,−0.21) | 1.76E-03 | 21 | * | −0.57 (−0.87,−0.27) | 2.81E-04 | 27 | ** |
| adenosine 5’-monophosphate (AMP) | −0.46 (−0.76,−0.17) | 1.89E-03 | 22 | * | −0.49 (−0.74,−0.24) | 1.56E-04 | 19 | **** |
| N2,N2-dimethylguanosine | 1.15 (0.41,1.88) | 2.38E-03 | 24 | * | 1.24 (0.6,1.88) | 1.55E-04 | 18 | **** |
| 1-oleoyl-GPC (18:1) | 1.35 (0.48,2.23) | 2.57E-03 | 25 | * | 1.36 (0.6,2.11) | 5.10E-04 | 35 | ** |
| aconitate [cis or trans] | 1.4 (0.48,2.32) | 2.99E-03 | 26 | * | 1.53 (0.73,2.32) | 1.95E-04 | 24 | *** |
| dimethylarginine (SDMA + ADMA) | 1.46 (0.5,2.42) | 3.09E-03 | 28 | * | 1.54 (0.71,2.37) | 3.20E-04 | 29 | ** |
| 8-hydroxyoctanoate | 0.5 (0.17,0.83) | 3.10E-03 | 29 | * | 0.55 (0.27,0.84) | 1.60E-04 | 21 | **** |
| valine | −1.51 (−2.51,−0.51) | 3.37E-03 | 31 | * | −1.68 (−2.55,−0.82) | 1.61E-04 | 22 | **** |
| heptanoate (7:0) | 0.58 (0.19,0.97) | 3.52E-03 | 32 | * | 0.65 (0.32,0.99) | 1.58E-04 | 20 | **** |
| nicotinamide | − 0.61 (−1.03,−0.2) | 3.96E-03 | 33 | * | −0.67 (−1.03,−0.31) | 2.90E-04 | 28 | ** |
| sphinganine | −0.62 (−1.05,−0.2) | 4.16E-03 | 35 | * | −0.66 (−1.03,−0.3) | 4.36E-04 | 33 | ** |
| taurine | −0.75 (−1.27,−0.23) | 4.68E-03 | 36 | * | −0.85 (−1.29,−0.4) | 2.36E-04 | 26 | *** |
| iminodiacetate (IDA) | 0.65 (0.19,1.11) | 6.29E-03 | 42 | * | 0.71 (0.31,1.11) | 5.15E-04 | 36 | ** |
| sphingadienine | −0.42 (−0.73,−0.12) | 6.80E-03 | 45 | * | −0.47 (−0.74,−0.21) | 5.10E-04 | 34 | ** |
| 4-acetamidobutanoate | 0.8 (0.22,1.38) | 7.35E-03 | 49 | * | 0.93 (0.42,1.43) | 3.42E-04 | 31 | ** |
| 1-(1-enyl-palmitoyl)-2-arachidonoyl-GPE (P-16:0/20:4) | −0.85 (−1.48,−0.23) | 7.35E-03 | 50 | * | −1.04 (−1.58,−0.51) | 1.64E-04 | 23 | **** |
| sphingosine | −0.55 (−0.97,−0.14) | 9.45E-03 | 56 | * | −0.63 (−0.99,−0.27) | 6.47E-04 | 38 | ** |
| sphinganine-1-phosphate | −0.64 (−1.13,−0.16) | 9.82E-03 | 58 | * | −0.77 (−1.19,−0.35) | 4.02E-04 | 32 | ** |
| uridine | −1.03 (−1.87,−0.2) | 1.61E-02 | 78 | * | −1.26 (−1.99,−0.54) | 7.23E-04 | 39 | ** |
| glycerol 3-phosphate | 0.45 (0.04,0.85) | 3.06E-02 | 122 | * | 0.71 (0.36,1.06) | 8.30E-05 | 13 | **** |
Alpha;
ENT75%;
ENT95%;
ENT99%.
All estimates are adjusted for age at blood collection, height, weight, smoking status (regular or former) and race (White or Other).
3.3. Second blood sample in a subset of men
A total of 48 men had a second blood sample, taken between 1 and 7.5 years after the first sample (mean = 6.1 years), in which Pb was measured and which was suitable for metabolomic profiling. There was high correlation in the Pb measures between the two timepoints in these 48 men (ρ: 0.74, p = 1.92 × 10⁻⁹) (Supplementary Fig. 6). The distribution of baseline characteristics in this subset of men was similar to that in the full sample (Supplementary Table 3). Although power was limited in this analysis, three of the top 11 metabolites identified in the first sample (n = 399 men) were significantly associated with whole-blood Pb measured concurrently to the metabolites among those with a second sample (n = 48): lysine (β (95% CI): 3.65 (−6.49,−0.81), p = 0.016), N-formylmethionine (β (95% CI): 2.20 (0.16, 4.26), p = 0.041), and sphingomyelin (d18:2/16:0, d18:1/16:1) (β (95%CI): 2.55 (0.21, 0.489), p = 0.039). The remaining metabolites showed consistency in magnitude and direction of effect, further supporting the association between these metabolites and Pb (Fig. 3). The only exceptions were vanillylmandelate and hexanolglycine, which showed discordant directions of effect between the first and second sample; although it should be noted that neither of these metabolites reached significance in the second sample.
Fig. 3.
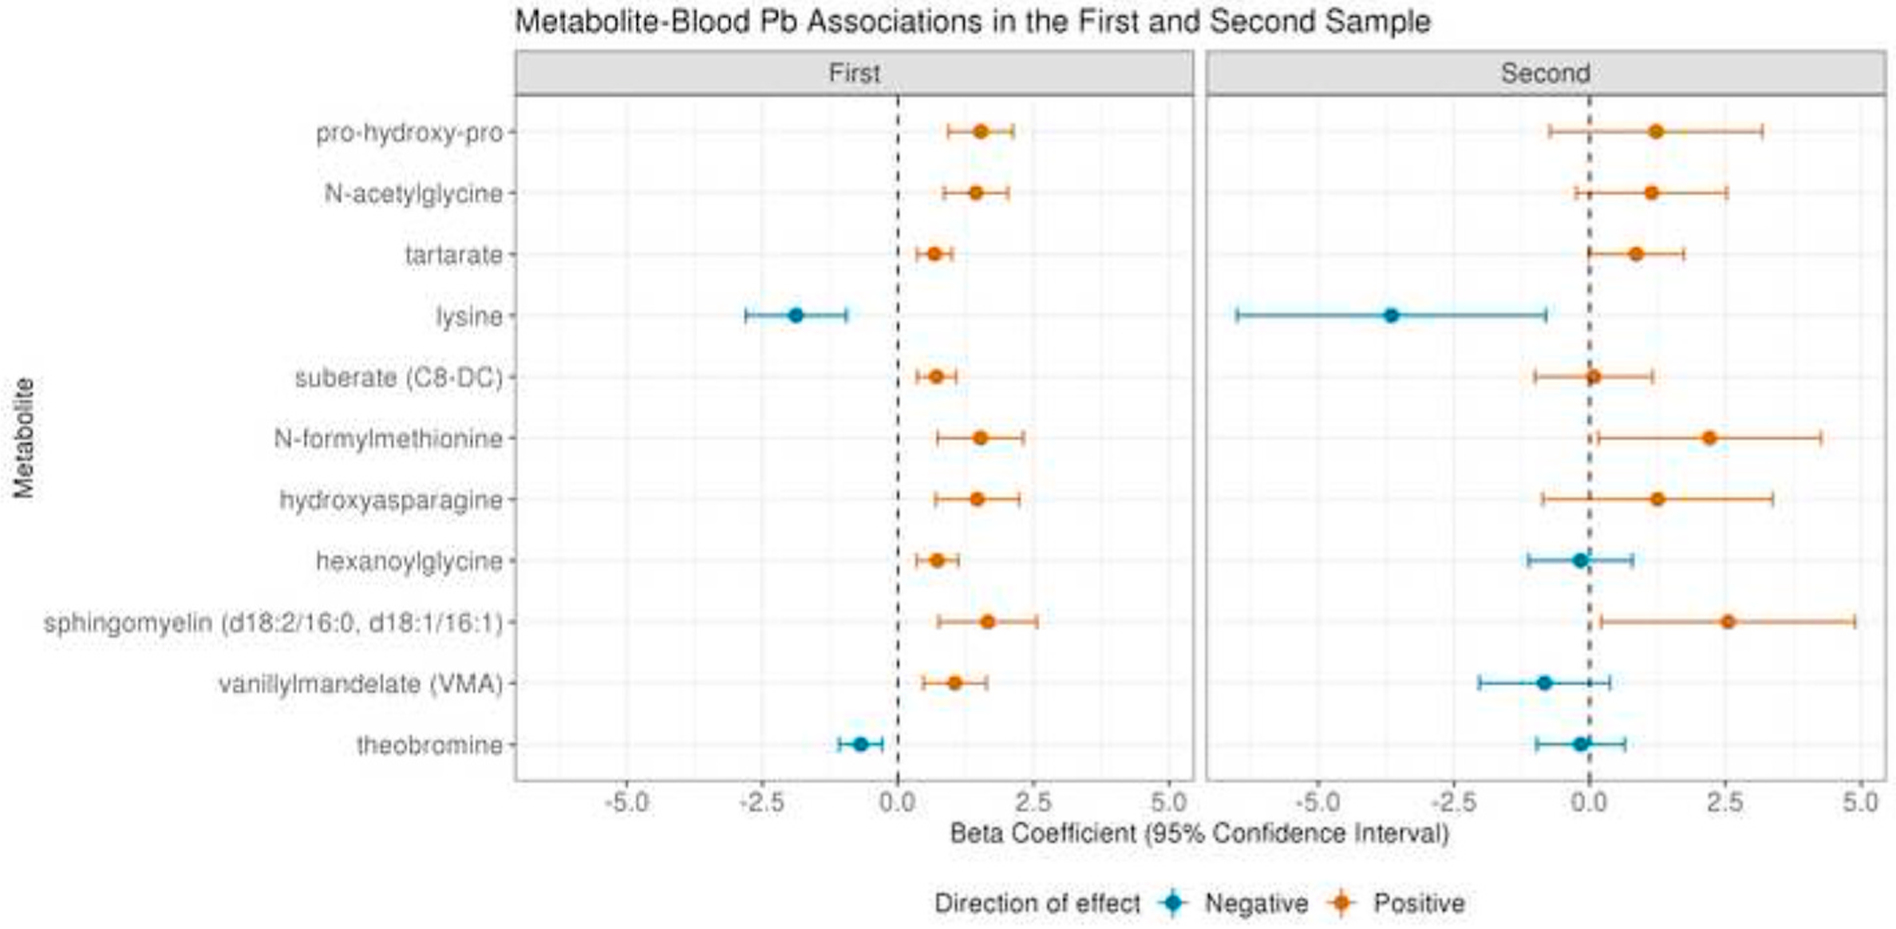
Blood Pb-metabolite associations in the first sample from 399 men and the second sample from 48 men for the top 11 hits at a threshold of ENT75%. All estimates are from generalized linear models including Pb and metabolite intensity as continuous variables adjusted for age at blood collection, height, weight, smoking status (regular or former) and race (White or Other).
3.4. Medium-term measures of Pb in toenails
Three hundred and ten of 399 men (78%) provided toenail clippings at the same time as the blood samples, in which Pb could be measured for metabolomics profiling. These 310 men were representative of the larger sample (Supplementary Table 4). There was a modest but significant correlation between measures of Pb levels in blood and in toenail; (ρ: 0.26, p = 4.06 × 10⁻⁶) (Supplementary Fig. 7); this correlation was very similar when the high blood Pb level outlier was excluded (rho: 0.25, p = 6.58 × 10⁻⁶). The median and interquartile range of toenail Pb levels in this subpopulation were 0.26 μg/g and 0.13–0.58 μg/g, respectively (Supplementary Table 1). A total of 70 blood metabolites were associated with toenail Pb at an alpha of 0.05 (Supplementary Table 5, Fig. 4). In comparison to the blood Pb results, the majority of significant metabolites were amino acids (n = 30, 42.9%) and xenobiotics (n = 16, 22.9%); with lipids comprising only nine (12.9%) significant metabolites. No pathways were significantly enriched among these metabolites. After correction for multiple testing, four metabolites were associated with toenail Pb at a threshold of ENT75%, of which one retained significance at ENT99%; homocitrulline (β(95%CI): 0.59 (0.30, 0,88), p = 8.31 × 10⁻⁵), 5–6-dihydrouridine (β(95%CI): 0.86 (0.40,1.32), p = 2.66 × 10⁻⁴), gamma-tocopherol/beta-tocopherol (β(95%CI): 0.47(0.21,0.72), p = 3.21 × 10⁻⁴) and dimethylarginine (isobar SDMA + ADMA) (β(95%CI): 1.02 (0.45, 1.59), p = 5.47 × 10⁻⁴). These metabolites were not among the top hits in the blood Pb analysis; although all but gamma-tocopherol/beta-tocopherol were significantly associated with blood Pb levels at an alpha of 0.05.
Fig. 4.
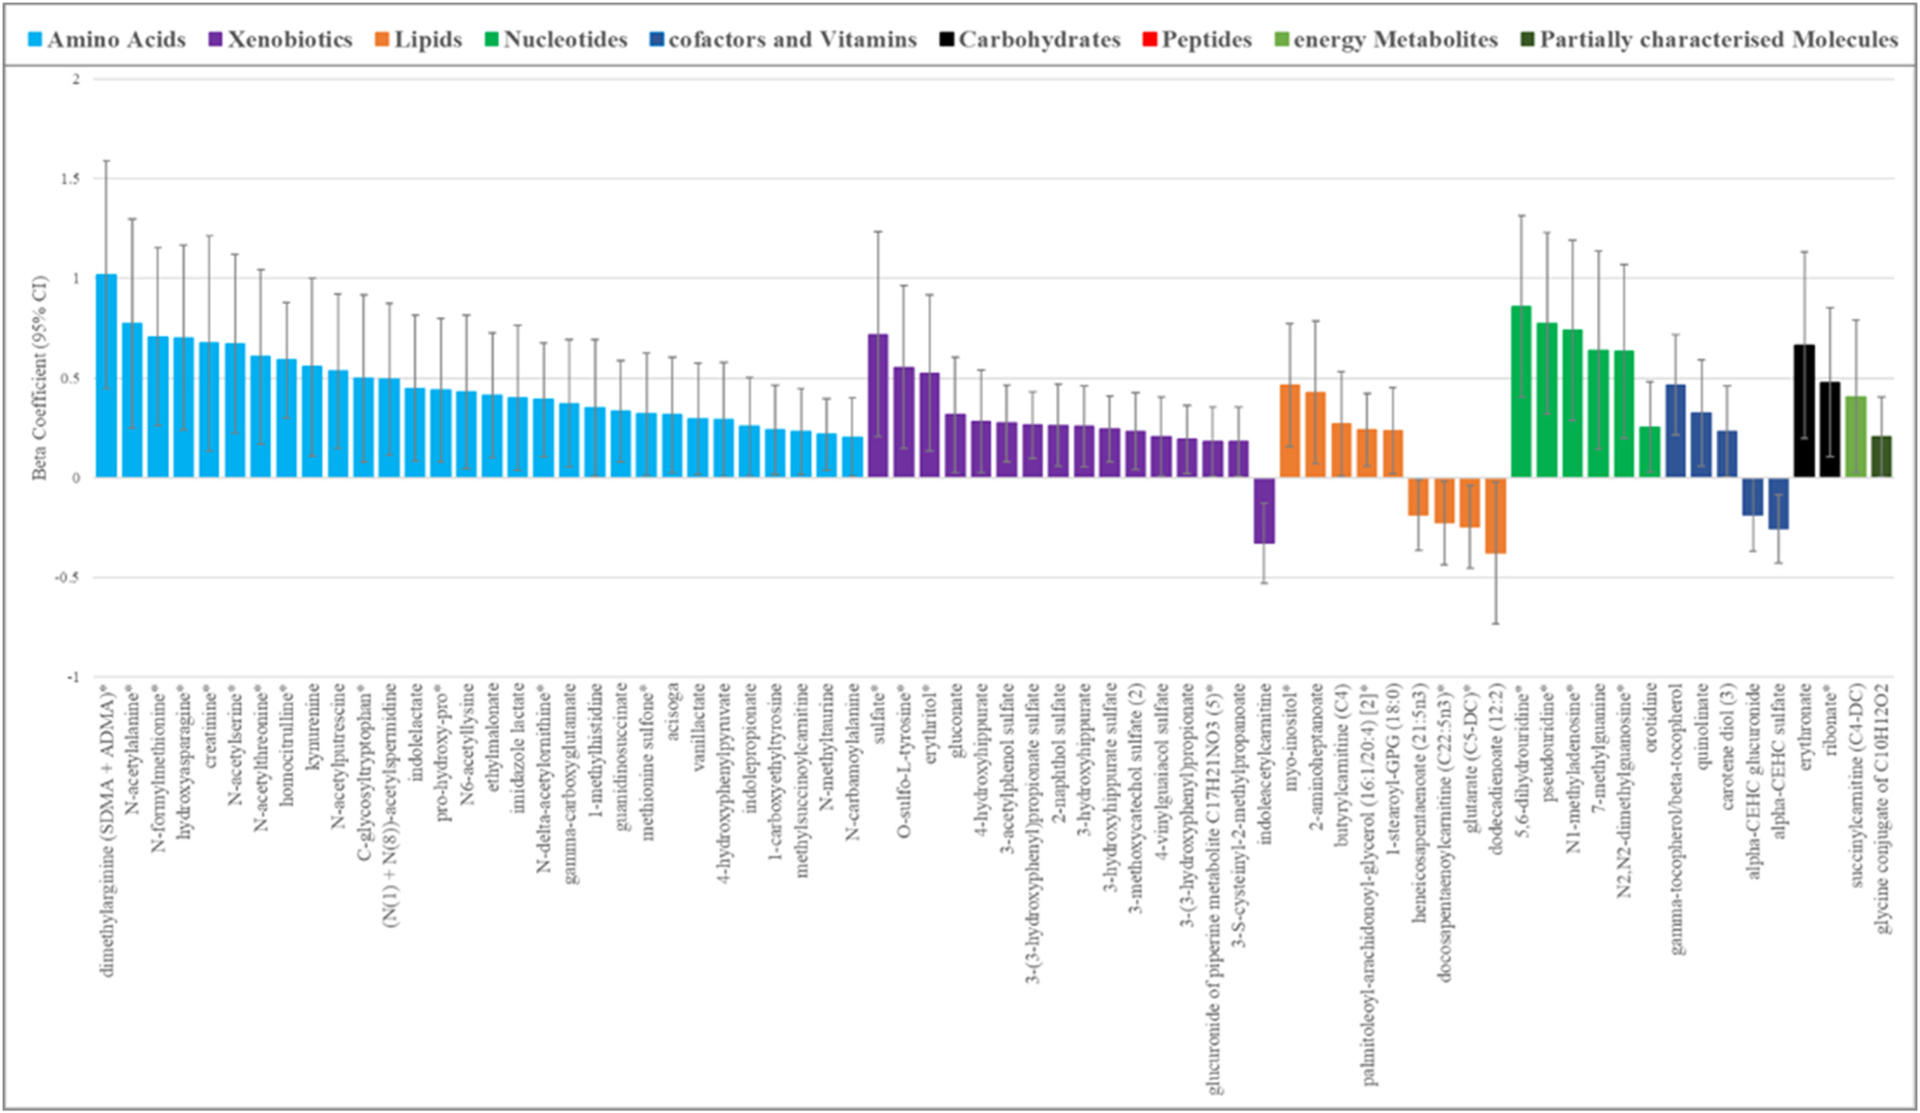
Seventy blood metabolites associated (p < 0.05) with Pb exposure levels as measured in concurrently collected toenail clippings. *indicates the metabolite was also significant (p < 0.05) in the blood Pb analysis, All estimates are from generalized linear models including Pb and metabolite intensity as continuous variables adjusted for age at blood collection, height, weight, smoking status (regular or former) and race (White or Other).
Overall, 23 metabolites were significantly associated with both blood and toenail measures of Pb with concordant directions of effect. One metabolite, diacylglycerol (16:1/18:2 (Hoffman et al., 2015), 16:0/18:3 (Wani et al., 2015)), demonstrated a discordant effect between Pb exposure as measured in blood and in toenail, but was not highly significant in either; β: 0.37, p = 0.028 and β: 0.24, p = 0.010, respectively. Of the 46 metabolites that were unique to the toenail analysis, seven were from Metabolon superpathways that were not identified as being dysregulated in blood Pb analysis; six were from the benzanoate metabolism pathway (3-(3-hydroxyphenyl)propionate sulfate; 3-hydroxyhippurate sulfate; 3-hydroxyhippurate; 3-methoxycatechol sulfate (2); 3-(3-hydroxyphenyl)propionate and 4-hydroxyhippurate) and one was from the guanidino and acetamido Metabolism (guanidinosuccinate). The remainder were involved in some of the same super-pathwaysas those identified in the blood Pb analysis, even if the specific metabolites differed.
4. Discussion
Exposure to Pb is widespread and has far-reaching negative physiological effects. Isolating the underlying biological pathways affected by Pb exposure can help us to better understand the mechanisms of these effects (Eguchi et al., 2018). However, quantifying chronic Pb exposure can be complex; the metabolome, as the objective downstream product of genetics, environment and their interactions, is an ideal matrix in which to investigate such exposures. This study, in 399 men from the VA Normative Aging Study, represents one of the first metabolomics profiling studies of Pb exposure.
Of 858 metabolites that we could identify and quantify in plasma, 18% were associated with Pb levels measured concurrently in the same blood sample. The greatest proportion of these metabolites were lipids, followed by amino acids and xenobiotics; and in each of these metabolite classes, the majority were positively associated with Pb exposure. The top hits were robust to stringent correction for multiple testing, and could largely be validated in two ways; (i) blood metabolite ~ bood Pb measures in repeat blood samples from 48 men, and in (ii) blood metabolite ~ toenail Pb measures in 310 men for whom toenail clippings were available. The half-life of Pb in toenails is up to 18 months; and clippings typically reflect a longer-term measure of exposure integrated over the previous 6–12 months. In comparison, the half-life of Pb in blood is approximately 30 days (Bakulski et al., 2014; Mordukhovich et al., 2012). Interestingly, there were also some metabolites that were uniquely associated Pb exposure as measured in toenails, which may suggest some differential effects of Pb on the metabolome according to duration of exposure.
Men in the study sample were aged 57–97 years at blood collection between the years of 2000 and 2008; and in common with many older adults, may have sustained exposure to high levels of Pb earlier in their lives from occupational sources, Pb-based paint, and, widespread combustion of leaded gasoline (Bakulski et al., 2014). The Normative Ageing Study also includes a large proportion of military veterans, fire fighters and police officers, who may be at an increased risk of exposure to Pb by occupation (Ji et al., 2014). However, in this study we had only shorter term measures of Pb exposure in blood and toenails. In the men included in these analyses, blood levels of Pb ranged from 0 to 29 μg/dL with a mean of 3.47 μg/dL and a median of 3 μg/dL. According to the National Health and Nutrition Examination Survey (NHANES), the mean blood level of a comparable population of men aged 65 and older in the United States in 2003–2012 was 2.16 μg/dL (95% CI 2.11, 2.22 μg/dL) (Jain, 2016). In 2015, the National Institute for Occupational Safety and Health (NIOSH) designated 5 μg/dL, as the reference level for adults; anything above this level is determined to be an elevated blood level, which would include 92 (23.1%) of the participants in this sample. Nevertheless, our participants’ blood Pb levels are well below those in many studies of industrially exposed workers (Myers et al., 2002; Rosenman et al., 2003; Piacitelli et al., 1997; Far et al., 1993), which have been found to be as high as 75 μg/dL (Baker et al., 1979), and below the U.S. Occupational Safety and Health Administration (OSHA) lead standards level which requires workers to be removed from exposure if their levels are 50 μg/dL or greater. Notably, we did not see any obvious metabolomically driven clustering of subjects with blood Pb levels above or below 5 μg/dL, suggesting no overall global shift in the metabolome between these exposure groups. In the subsample of men with measured Pb in toenails, the mean and median levels were 0.62 μg/g and 0.26 μg/g respectively, with a range of 0.02–14.73 μg/g, which is generally in keeping with estimates from other populations (Grashow et al., 2014).
To date, few studies have explored the metabolome of Pb exposure. Among those that have, participants have primarily been drawn from highly exposed populations both residentially and occupationally, with blood Pb levels well in excess of the safe reference level and the levels seen in our sample (Eguchi et al., 2018; Clarkson and Kench, 1956; Dudka et al., 2014). Nevertheless, there was substantial concordance between prior findings and ours, identifying amino acid and lipid metabolism as the groups of pathways most commonly dysregulated by Pb exposure (Eguchi et al., 2018; Clarkson and Kench, 1956; Dudka et al., 2014). More specifically, metabolites from a number of interconnected amino acid pathways were significant in our primary blood Pb analyses. Fig. 5 displays these significant metabolites (in dark red) within the context of their pathways; glycine serine, alanine and threonine metabolism’, ‘histidine metabolism’, ‘purine metabolism’, and the ‘urea cycle and metabolism of arginine, proline, glutamate, aspartate and asparagine’. A number of these pathways and metabolites, particularly glutamate, histidine, alanine and purine have been previously identified as significantly dysregulated in other Pb exposed populations, including in the urine of residents living in close proximity to a lead-acid battery recycling site (Eguchi et al., 2018) and of men occupationally exposed to lead fumes and lead-oxide dust (Clarkson and Kench, 1956). It is hypothesized that one of the main effects of Pb exposure is the induction of increased oxidative stress via its chemical affinity for proteins and non-protein thiols and the Fenton mechanism (Rubino, 2015). This is consistent with the identification of dysregulation of these oxidative-stress related pathways as well others noted in our study such as the methionine and cysteine metabolism pathways – which involve sulfur-containing amino acids that are readily oxidized (Yan et al., 2019). It should also be noted that a large number of acetylated amino acids were also among the significant hits, including N-acetylglycine, N-acetylserine and N-acetylalanine, which may have been generated in response to free radicals and reactive oxidative species generated from exposure induced chronic oxidative stress (Rubino, 2015; Cao et al., 2017).
Fig. 5.
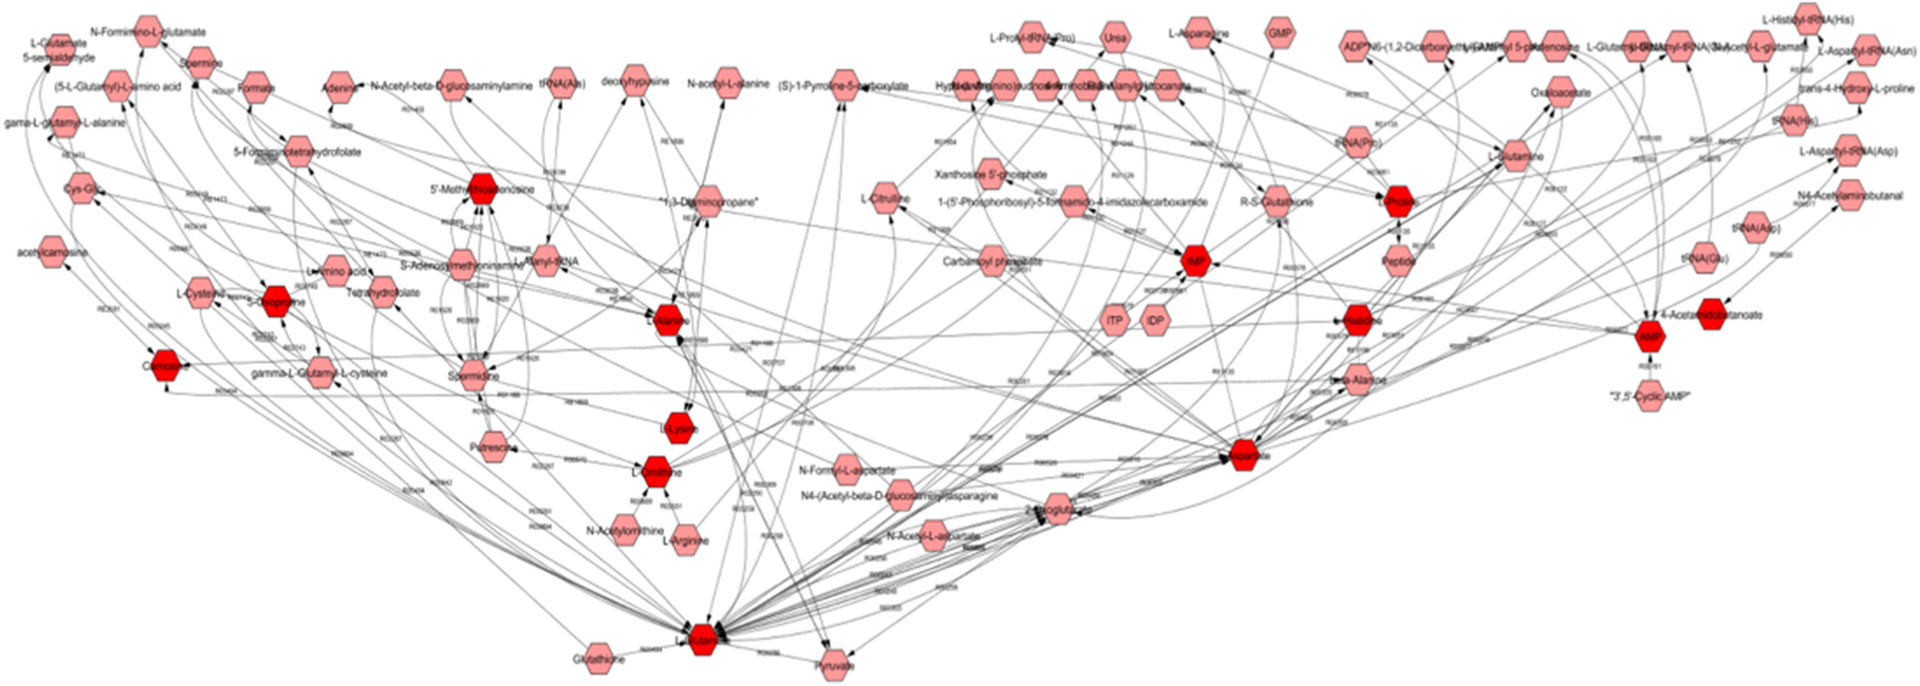
Metscape-derived Pathway based network of ‘Glycine serine alanine and threonine metabolism’; ‘Histidine metabolism’; ‘Purine metabolism’; ‘Urea cycle and metabolism of arginine, proline, glutamate, asparatate and asparagine’; with blood Pb associated metabolites in dark red Metabolites are shown in hexagons; metabolites from these pathways identified as significant in the metabolite ~ blood Pb analysis in 399 men are in dark red. Reaction numbers are shown along the edges between the metabolite nodes..
Glutamate, an excitatory neurotransmitter that plays a key role in neurotoxicity is of particular interest, given one of the other key actions by which Pb is known to influence health is as a potent neurotoxin (Garza et al., 2006; Sanders et al., 2009). Neurotransmitters are dependent on the action of cations, Pb has the ability to mimic these cations thereby disrupting neurotransmitter release (Marchetti, 2014). Accordingly, we identified a number of other neurotransmitters including aspartate, serotonin, and myo-inositol among our top metabolomic hits. Furthermore, in agreement with existing studies we identified several metabolites of the urea cycle, which is related to the metabolism of ammonia – another known neurotoxin (Eguchi et al., 2018). There is also evidence to suggest that exposure to Pb may result in microgliosis and astrogliosis, a nonspecific reactive change of glial cells in response to damage to the central nervous system (CNS), by triggering a signaling cascade and the production of proinflammatory cytokines (Metryka et al., 2018).
In fact, the immune system is one of the more sensitive targets of Pb; and Pb exposure has been shown to impact almost all of its functions (Metryka et al., 2018; Fischbein et al., 1993). A wealth of evidence demonstrates that Pb can promote inflammatory responses through its actions on cytokine metabolism, and on enzymes involved in the inflammatory process and on certain acute phase proteins (Metryka et al., 2018). Furthermore, Pb has been shown to impair the function of cells of the immune system, including T lymphocytes, B lymphocytes, dendritic cells and macrophages, and increase the secretion of IgA, IgE, IgG, histamine, and endothelin (Metryka et al., 2018; Fischbein et al., 1993). In keeping with a global influence of Pb on the immune system, we identified glycerophospholipid and glycosphingolipid metabolism as two pathways dysregulated with Pb exposure (Fig. 6). Both pathways metabolize lipids that play a role in inflammation via their roles as downstream signaling molecules. These findings are in agreement with existing work showing that Pb exposure leads to an increase in the level of total cholesterol, triglycerides, elevated lipoprotein changes in polyunsaturated fatty acids and induction of lipid peroxidation (Kasperczyk et al., 2015).
Fig. 6.
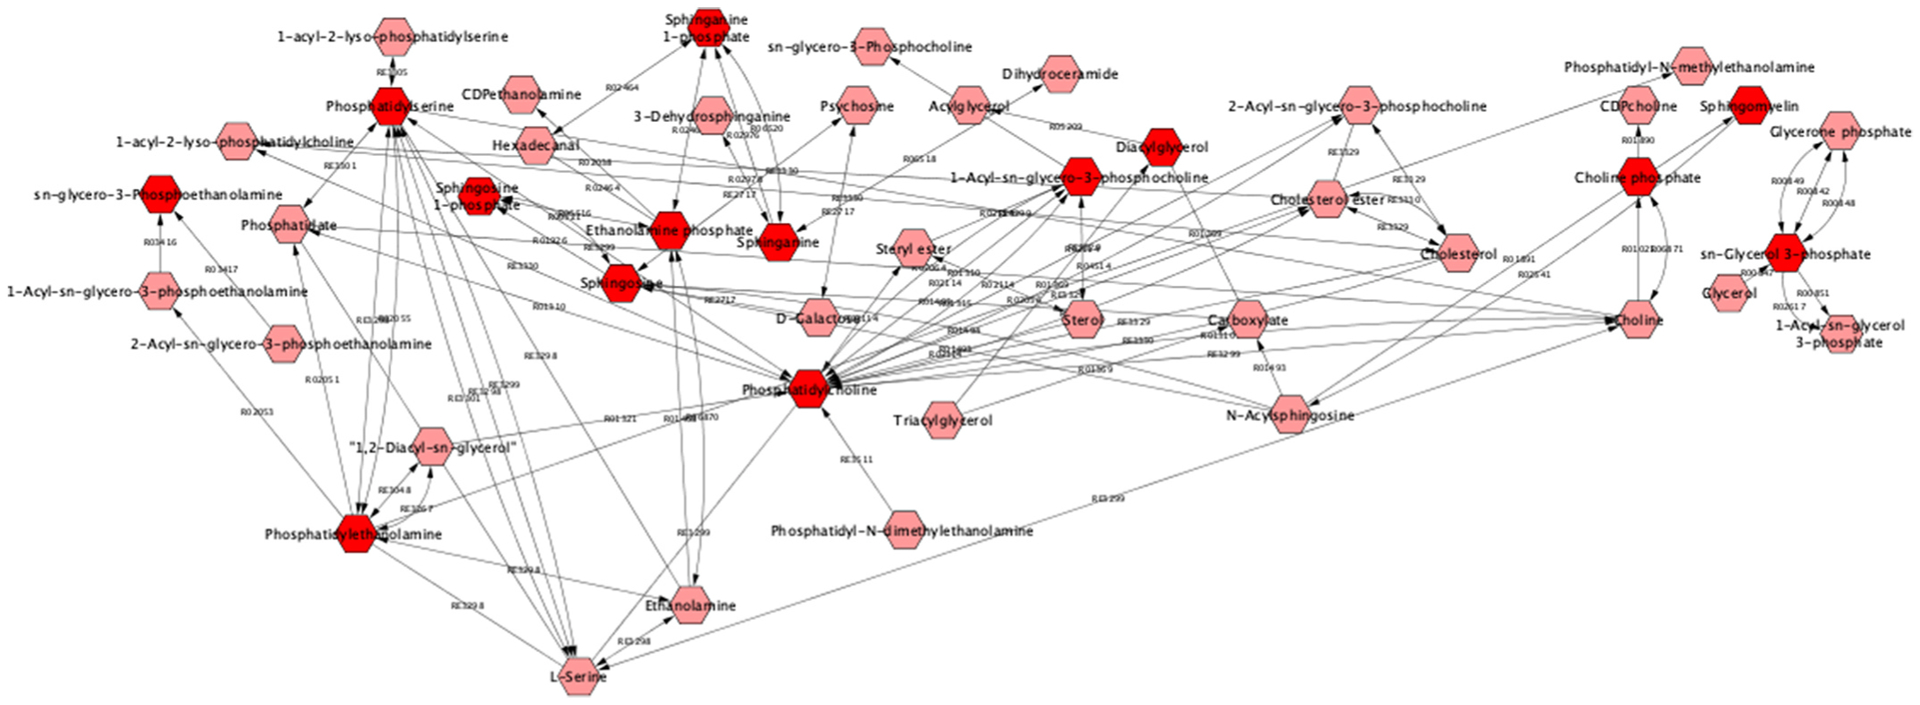
Metscape-derived Pathway based network of ‘Glycerophospholipid metabolism’; and ‘Glycosphingolipid metabolism’ with blood Pb associated metabolites in dark red, Metabolites are shown in hexagons; metabolites from these pathways identified as significant in the metabolite ~ blood Pb analysis in 399 men are in dark red. Reaction numbers are shown along the edges between the metabolite nodes..
Our results therefore provide biological and mechanistic evidence for some of the multi-faceted means through which Pb exposure can negatively impact the human body and health; through the induction of oxidative stress and through its impairment of both neurological and immunological functions. Our top metabolite hit was pro-hydroxy-pro, a dipeptide that has not previously been associated with Pb, but which has a biologically plausible relationship through its involvement in anti-oxidative reactions and immune responses (Wu et al., 2011). Among our top hits were a number of other novel findings which could reflect the greater breadth of the metabolome measured in this study than in previous analyses. We also identified several metabolites that have been identified as being associated with Pb in these previous studies such as heme (Eguchi et al., 2018), sphingosine-1-phosphate (Lukomska et al., 2017), and corticosterone (Virgolini et al., 2005). The consistency of our findings with existing literature that in many cases utilizes different biosamples to measure both Pb and the metabolome; as well as study populations differing both in demographics and levels of exposure, points to the global influence of Pb on the human body. Nevertheless, as noted, we did identify some metabolites that seems to be unique to Pb as measured in toenails versus the blood. For example, N-acetylputrescine, an abundant polyamine, was associated with Pb exposure as measured in toenails but not in blood. Interestingly, given that toenail Pb provides a longer-term measure of exposure, this metabolite was also associated with Pb exposure in individuals living in close proximity to a lead acid battery recycling site who are therefore likely to have sustained Pb exposure (Eguchi et al., 2018).
Unfortunately, we were not able to measure homocysteine in this study, a one-carbon metabolite which has commonly been associated with blood Pb levels in population-based studies (Schafer et al., 2005), and has been suggested as a potential mediator between Pb and a number of pathological conditions (Bakulski et al., 2014). However, homocysteine, is a metabolite of methionine and we did note several other methionine metabolites among our significant hits. There were several other limitations. Our sample consists predominantly of White men, many of whom served in the military during World War II or the Korean War; therefore the insights gained may not be generalizable to the wider population. It may not be possible to extrapolate these findings to women; who have been shown to exhibit higher levels of Pb due to lower circulating levels of iron (Gaudet et al., 2019). We also did not consider other metals in our analyses, and it is possible that men may have been co-exposed to other metals that may also influence the metabolome. Further work is needed to explore this. Although data from an independent population were not available for replication of our findings, we did have repeat samples from a subset of men at a later time-point which support the findings for a number of our top hits results. Furthermore, we had an additional longer term measure of Pb exposure in the form of toenail clippings, which largely corroborated findings in blood, providing support for the validity and robustness of our top Pb-associated metabolites.
There are several other strengths to this study, which is among the first and largest studies to utilize high-resolution metabolomics profiling to explore the biology underlying Pb exposure. It is nested within an established and well-characterized longitudinal study of men, encompassing rich epidemiological data and clinical data, as well as validated measures of Pb exposure including repeat samples from a subset of participants. The study utilizes validated, calibrated and quality-assured methods with the inclusion of quality-control samples to ensure robust and reproducible findings, thus providing fertile ground for novel discoveries. Furthermore, there is limited potential for measurement bias in this study, despite the use of a retrospective cohort, as both Pb exposure and metabolite levels are assessed using objective measures. Metabolomic profiling was conducted with the use of measurements from blood samples based on the qualities of blood which is easily accessible and has shown great promise in the development of metabolomics biomarkers in other settings.
In conclusion, our understanding of how various occupational exposures, including Pb, influence the health and the human body remains limited (Metryka et al., 2018; Vermeulen, 2017); despite the fact that according to the US Agency for Toxic Substances and Disease Registry’s Priority Substance List it is the second most dangerous environmental poison and contributes to 0.6% of the global burden of disease (Metryka et al., 2018). Metabolomics is a particularly powerful tool for exploring the effects of Pb exposure (Deng et al., 2019). In this study, we identified a number of metabolites and metabolomic pathways associated with Pb exposure as measured in both blood and toenails, using a global and untargeted approach that both confirmed previous findings and revealed novel ones. These findings help us to better understand the biology of Pb exposure and may also support the development of biomarkers of exposure, something which is currently lacking (Vermeulen, 2017). Taken together, our findings demonstrate that exploiting the potential of metabolomics provides a novel way to help address the substantial global burden of toxic heavy metal exposure.
Supplementary Material
Acknowledgements
We wish to thank all the participants and study staff involved in the VA Normative Aging Study and those at MAVERIC.
Funding
This study was supported by PR161204 W81XWH-17-1-0533 from the Congressionally Directed Medical Research Programs (CDMRP), USAMRDC. The VA Normative Aging Study is a research component of the Massachusetts Veterans Epidemiology Research and Information Center (MAVERIC) at VA Boston Healthcare System and is supported by the Cooperative Studies Program/Epidemiology Research and Information Centers, Office of Research and Development, US Department of Veterans Affairs. A.S was supported by a Senior Research Career Scientist award from the Clinical Science Research and Development Service, Office of Research and Development, US Department of Veterans Affairs.
R.S.K was supported by K01HL146980 from the NHLBI; M.H., S.H.C., and J.L-S. by R01HL141826 from the NHLBI; S.H.C. and J.L-S. by R01 HL123915 from the NHLBI; K.L-S. by K08HL148178 from the NHLBI, and P.K. by P01 HL132825 from the NHLBI.
The funders played no role in the design of this study, in the analysis of the data, the interpretation of the results or the decision to submit this manuscript for publication.
Consent: The VA Normative Aging Study received written informed consent from study participants at each visit, as well as approval from the Review Boards of all institutions involved in data collection and analysis.
Footnotes
Declaration of competing interest
The authors declare that they have no known competing financial interests or personal relationships that could have appeared to influence the work reported in this paper.
Appendix A. Supplementary data
Supplementary data to this article can be found online at https://doi.org/10.1016/j.envres.2020.110022.
References
- Bagchi D, Bagchi M, Hassoun EA, Stohs SJ, 1995. In vitro and in vivo generation of reactive oxygen species, DNA damage and lactate dehydrogenase leakage by selected pesticides. Toxicology 104 (1–3), 129–140. [DOI] [PubMed] [Google Scholar]
- Baker EL Jr., Landrigan PJ, Barbour AG, Cox DH, Folland DS, Ligo RN, Throckmorton J, 1979. Occupational lead poisoning in the United States: clinical and biochemical findings related to blood lead levels. Br. J. Ind. Med 36 (4), 314–322. [DOI] [PMC free article] [PubMed] [Google Scholar]
- Bakulski KM, Park SK, Weisskopf MG, Tucker KL, Sparrow D, Spiro A 3rd, Vokonas PS, Nie LH, Hu H, Weuve J, 2014. Lead exposure, B vitamins, and plasma homocysteine in men 55 years of age and older: the VA normative aging study. Environ. Health Perspect 122 (10), 1066–1074. [DOI] [PMC free article] [PubMed] [Google Scholar]
- Cao X, Li C, Xiao S, Tang Y, Huang J, Zhao S, Li X, Li J, Zhang R, Yu W, 2017. Acetylation promotes TyrRS nuclear translocation to prevent oxidative damage. Proc. Natl. Acad. Sci. U. S. A 114 (4), 687–692. [DOI] [PMC free article] [PubMed] [Google Scholar]
- Chong J, Soufan O, Li C, Caraus I, Li S, Bourque G, Wishart DS, Xia J, 2018. MetaboAnalyst 4.0: towards more transparent and integrative metabolomics analysis. Nucleic Acids Res. 46 (W1), W486–W494. [DOI] [PMC free article] [PubMed] [Google Scholar]
- Clarkson TW, Kench JE, 1956. Urinary excretion of amino acids by men absorbing heavy metals. Biochem. J 62 (3), 361–372. [DOI] [PMC free article] [PubMed] [Google Scholar]
- Deng P, Li X, Petriello MC, Wang C, Morris AJ, Hennig B, 2019. Application of metabolomics to characterize environmental pollutant toxicity and disease risks. Rev. Environ. Health 34 (3), 251–259. [DOI] [PMC free article] [PubMed] [Google Scholar]
- Dudka I, Kossowska B, Senhadri H, Latajka R, Hajek J, Andrzejak R, Antonowicz-Juchniewicz J, Gancarz R, 2014. Metabonomic analysis of serum of workers occupationally exposed to arsenic, cadmium and lead for biomarker research: a preliminary study. Environ. Int 68, 71–81. [DOI] [PubMed] [Google Scholar]
- Eguchi A, Nomiyama K, Sakurai K, 2018. Kim Trang PT, Viet PH, Takahashi S, Iwata H, Tanabe S, Todaka E, Mori C: alterations in urinary metabolomic profiles due to lead exposure from a lead-acid battery recycling site. Environ. Pollut 242 (Pt A), 98–105. [DOI] [PubMed] [Google Scholar]
- Evans AB,B, Mitchell M, Liu Q, Stewart S, Dai H, Dehaven C, Miller, 2014. L: high resolution mass spectrometry improves data quantity and quality as compared to unit mass resolution mass spectrometry in high-throughput profiling metabolomics. Metabolomics 132, 4. [Google Scholar]
- Far HS, Pin NT, Kong CY, Fong KS, Kian CW, Yan CK, 1993. An evaluation of the significance of mouth and hand contamination for lead absorption in lead-acid battery workers. Int. Arch. Occup. Environ. Health 64 (6), 439–443. [DOI] [PubMed] [Google Scholar]
- Fiehn O, 2002. Metabolomics–the link between genotypes and phenotypes. Plant Mol. Biol 48 (1–2), 155–171. [PubMed] [Google Scholar]
- Fischbein A, Tsang P, Luo JC, Bekesi JG, 1993. The immune system as target for subclinical lead related toxicity. Br. J. Ind. Med 50 (2), 185–186. [DOI] [PMC free article] [PubMed] [Google Scholar]
- Garcia-Leston J, Mendez J, Pasaro E, Laffon B, 2010. Genotoxic effects of lead: an updated review. Environ. Int 36 (6), 623–636. [DOI] [PubMed] [Google Scholar]
- Garza A, Vega R, Soto E, 2006. Cellular mechanisms of lead neurotoxicity. Med. Sci. Mon. Int. Med. J. Exp. Clin. Res 12 (3). RA57–65. [PubMed] [Google Scholar]
- Gaudet MM, Deubler EL, Kelly RS, Ryan Diver W, Teras LR, Hodge JM, Levine KE, Haines LG, Lundh T, Lenner P, et al. , 2019. Blood levels of cadmium and lead in relation to breast cancer risk in three prospective cohorts. Int. J. Canc 144 (5), 1010–1016. [DOI] [PMC free article] [PubMed] [Google Scholar]
- Grashow R, Zhang J, Fang SC, Weisskopf MG, Christiani DC, Cavallari JM, 2014. Toenail metal concentration as a biomarker of occupational welding fume exposure. J. Occup. Environ. Hyg 11 (6), 397–405. [DOI] [PMC free article] [PubMed] [Google Scholar]
- Hoffman RS, Howland MA, Lewin NA, Nelson L, Goldfrank LR, Flomenbaum N, 2015. Goldfrank’s Toxicologic Emergencies, tenth ed. McGraw-Hill Education, New York. edn. [Google Scholar]
- Hu H, Rabinowitz M, Smith D, 1998. Bone lead as a biological marker in epidemiologic studies of chronic toxicity: conceptual paradigms. Environ. Health Perspect 106 (1), 1–8. [DOI] [PMC free article] [PubMed] [Google Scholar]
- Jain RB, 2016. Trends and variability in blood lead concentrations among US adults aged 20–64 years and senior citizens aged >/=65 years. Environ. Sci. Pollut. Res. Int 23 (14), 14056–14067. [DOI] [PubMed] [Google Scholar]
- Ji JS, Schwartz J, Sparrow D, Hu H, Weisskopf MG, 2014. Occupational determinants of cumulative lead exposure: analysis of bone lead among men in the VA normative aging study. J. Occup. Environ. Med 56 (4), 435–440. [DOI] [PMC free article] [PubMed] [Google Scholar]
- Jomova K, Valko M, 2011. Advances in metal-induced oxidative stress and human disease. Toxicology 283 (2–3), 65–87. [DOI] [PubMed] [Google Scholar]
- Karnovsky A, Weymouth T, Hull T, Tarcea VG, Scardoni G, Laudanna C, Sartor MA, Stringer KA, Jagadish HV, Burant C, et al. , 2012. Metscape 2 bioinformatics tool for the analysis and visualization of metabolomics and gene expression data. Bioinformatics 28 (3), 373–380. [DOI] [PMC free article] [PubMed] [Google Scholar]
- Kasperczyk S, Slowinska-Lozynska L, Kasperczyk A, Wielkoszynski T, Birkner E, 2015. The effect of occupational lead exposure on lipid peroxidation, protein carbonylation, and plasma viscosity. Toxicol. Ind. Health 31 (12), 1165–1171. [DOI] [PubMed] [Google Scholar]
- Kelly RS, Lundh T, Porta M, Bergdahl IA, Palli D, Johansson AS, Botsivali M, Vineis P, Vermeulen R, Kyrtopoulos SA, et al. , 2013. Blood erythrocyte concentrations of cadmium and lead and the risk of B-cell non-Hodgkin’s lymphoma and multiple myeloma: a nested case-control study. PloS One 8 (11), e81892. [DOI] [PMC free article] [PubMed] [Google Scholar]
- Kelly RS, Chawes BL, Blighe K, Virkud YV, Croteau-Chonka DC, McGeachie MJ, Clish CB, Bullock K, Celedon JC, Weiss ST, et al. , 2018. An integrative transcriptomic and metabolomic study of lung function in children with asthma. Chest 154 (2), 335–348. [DOI] [PMC free article] [PubMed] [Google Scholar]
- Li MX, Yeung JM, Cherny SS, Sham PC, 2012. Evaluating the effective numbers of independent tests and significant p-value thresholds in commercial genotyping arrays and public imputation reference datasets. Hum. Genet 131 (5), 747–756. [DOI] [PMC free article] [PubMed] [Google Scholar]
- Longnecker MP, Stampfer MJ, Morris JS, Spate V, Baskett C, Mason M, Willett WC, 1993. A 1-y trial of the effect of high-selenium bread on selenium concentrations in blood and toenails. Am. J. Clin. Nutr 57 (3), 408–413. [DOI] [PubMed] [Google Scholar]
- Lukomska A, Baranowska-Bosiacka I, Budkowska M, Pilutin A, Tarnowski M, Dec K, Dolegowska B, Metryka E, Chlubek D, Gutowska I, 2017. The effect of low levels of lead (Pb) in the blood on levels of sphingosine-1-phosphate (S1P) and expression of S1P receptor 1 in the brain of the rat in the perinatal period. Chemosphere 166, 221–229. [DOI] [PubMed] [Google Scholar]
- Marchetti C, 2014. Interaction of metal ions with neurotransmitter receptors and potential role in neurodiseases. Biometals 27 (6), 1097–1113. [DOI] [PubMed] [Google Scholar]
- Metryka E, Chibowska K, Gutowska I, Falkowska A, Kupnicka P, Barczak K, Chlubek D, Baranowska-Bosiacka I, 2018. Lead (Pb) exposure enhances expression of factors associated with inflammation. Int. J. Mol. Sci 6, 19. [DOI] [PMC free article] [PubMed] [Google Scholar]
- Mordukhovich I, Wright RO, Hu H, Amarasiriwardena C, Baccarelli A, Litonjua A, Sparrow D, Vokonas P, Schwartz J, 2012. Associations of toenail arsenic, cadmium, mercury, manganese, and lead with blood pressure in the normative aging study. Environ. Health Perspect 120 (1), 98–104. [DOI] [PMC free article] [PubMed] [Google Scholar]
- Myers SN, Rowell B, Binns HJ, 2002. Lead poisoning and asthma: an examination of comorbidity. Arch. Pediatr. Adolesc. Med 156 (9), 863–866. [DOI] [PubMed] [Google Scholar]
- Nyholt DR, 2004. A simple correction for multiple testing for single-nucleotide polymorphisms in linkage disequilibrium with each other. Am. J. Hum. Genet 74 (4), 765–769. [DOI] [PMC free article] [PubMed] [Google Scholar]
- Patti GJ, Yanes O, Siuzdak G, 2012. Innovation: metabolomics: the apogee of the omics trilogy. Nat. Rev. Mol. Cell Biol 13 (4), 263–269. [DOI] [PMC free article] [PubMed] [Google Scholar]
- Payton M, Riggs KM, Spiro A 3rd, Weiss ST, Hu H, 1998. Relations of bone and blood lead to cognitive function: the VA Normative Aging Study. Neurotoxicol. Teratol 20 (1), 19–27. [DOI] [PubMed] [Google Scholar]
- Piacitelli GM, Whelan EA, Sieber WK, Gerwel B, 1997. Elevated lead contamination in homes of construction workers. Am. Ind. Hyg. Assoc. J 58 (6), 447–454. [DOI] [PubMed] [Google Scholar]
- Rosenman KD, Sims A, Luo Z, Gardiner J, 2003. Occurrence of lead-related symptoms below the current occupational safety and health act allowable blood lead levels. J. Occup. Environ. Med 45 (5), 546–555. [DOI] [PubMed] [Google Scholar]
- Rubino FM, 2015. Toxicity of glutathione-binding metals: a review of targets and mechanisms. Toxics 3 (1), 20–62. [DOI] [PMC free article] [PubMed] [Google Scholar]
- Sanders T, Liu Y, Buchner V, Tchounwou PB, 2009. Neurotoxic effects and biomarkers of lead exposure: a review. Rev. Environ. Health 24 (1), 15–45. [DOI] [PMC free article] [PubMed] [Google Scholar]
- Schafer JH, Glass TA, Bressler J, Todd AC, Schwartz BS, 2005. Blood lead is a predictor of homocysteine levels in a population-based study of older adults. Environ. Health Perspect 113 (1), 31–35. [DOI] [PMC free article] [PubMed] [Google Scholar]
- Shannon P, Markiel A, Ozier O, Baliga NS, Wang JT, Ramage D, Amin N, Schwikowski B, Ideker T, 2003. Cytoscape: a software environment for integrated models of biomolecular interaction networks. Genome Res. 13 (11), 2498–2504. [DOI] [PMC free article] [PubMed] [Google Scholar]
- Stringer KA, McKay RT, Karnovsky A, Qúemerais B, Lacy P, Metabolomics, Application, Its, 2016. To acute lung diseases. Front. Immunol 7, 44. [DOI] [PMC free article] [PubMed] [Google Scholar]
- Vermeulen R, 2017. The use of high-resolution metabolomics in occupational exposure and health research. Ann Work Expo Health 61 (4), 395–397. [DOI] [PubMed] [Google Scholar]
- Virgolini MB, Chen K, Weston DD, Bauter MR, Cory-Slechta DA, 2005. Interactions of chronic lead exposure and intermittent stress: consequences for brain catecholamine systems and associated behaviors and HPA axis function. Toxicol. Sci 87 (2), 469–482. [DOI] [PubMed] [Google Scholar]
- Wani AL, Ara A, Usmani JA, 2015. Lead toxicity: a review. Interdiscipl. Toxicol 8 (2), 55–64. [DOI] [PMC free article] [PubMed] [Google Scholar]
- Wu G, Bazer FW, Burghardt RC, Johnson GA, Kim SW, Knabe DA, Li P, Li X, McKnight JR, Satterfield MC, et al. , 2011. Proline and hydroxyproline metabolism: implications for animal and human nutrition. Amino Acids 40 (4), 1053–1063. [DOI] [PMC free article] [PubMed] [Google Scholar]
- Wu AC, Allen JG, Coull B, Amarasiriwardena C, Sparrow D, Vokonas P, Schwartz J, Weisskopf MG, 2019. Correlation over time of toenail metals among participants in the VA normative aging study from 1992 to 2014. J. Expo. Sci. Environ. Epidemiol 29 (5), 663–673. [DOI] [PMC free article] [PubMed] [Google Scholar]
- Yan Q, Liew Z, Uppal K, Cui X, Ling C, Heck JE, von Ehrenstein OS, Wu J, Walker DI, Jones DP, et al. , 2019. Maternal serum metabolome and traffic-related air pollution exposure in pregnancy. Environ. Int 130, 104872. [DOI] [PMC free article] [PubMed] [Google Scholar]
Associated Data
This section collects any data citations, data availability statements, or supplementary materials included in this article.