

Abstract
Motivation:
Despite increasing understanding of the molecular characteristics of cancer, chemotherapy success rates remain low for many cancer types. Studies have attempted to identify patient and tumor characteristics that predict sensitivity or resistance to different types of conventional chemotherapies, yet a concise model that predicts chemosensitivity based on gene expression profiles across cancer types remains to be formulated. We attempted to generate pan-cancer models predictive of chemosensitivity and chemoresistance. Such models may increase the likelihood of identifying the type of chemotherapy most likely to be effective for a given patient based on the overall gene expression of their tumor.
Results:
Gene expression and drug sensitivity data from solid tumor cell lines were used to build predictive models for 11 individual chemotherapy drugs. Models were validated using datasets from solid tumors from patients. For all drug models, accuracy ranged from 0.81 to 0.93 when applied to all relevant cancer types in the testing dataset. When considering how well the models predicted chemosensitivity or chemoresistance within individual cancer types in the testing dataset, accuracy was as high as 0.98. Cell line–derived pan-cancer models were able to statistically significantly predict sensitivity in human tumors in some instances; for example, a pan-cancer model predicting sensitivity in patients with bladder cancer treated with cisplatin was able to significantly segregate sensitive and resistant patients based on recurrence-free survival times (P = .048) and in patients with pancreatic cancer treated with gemcitabine (P = .038). These models can predict chemosensitivity and chemoresistance across cancer types with clinically useful levels of accuracy.
Keywords: Chemotherapy, sensitivity, resistance, predictive models
Introduction
Cancers are responsible for approximately 600 000 deaths per year in the United States, with approximately 1.7 million new cases diagnosed annually.1 In 2016, 21.8% of deaths in the United States were attributed to cancer, making this the second-leading cause of death.2 Despite a relatively low overall recurrence rate (~15%) of cancers in the United States,3 some cancer types exhibit much higher rates of recurrence (eg, 30% of kidney cancers recur4). These challenges have prompted researchers to seek new models, using bioinformatics approaches,5 that more accurately predict clinical response to drug therapy. Using these approaches, researchers can leverage publicly available data and translate it into clinically actionable knowledge5-7 to be used as decision-making tools for clinicians in determining treatment course for individual patients.
In this study, we developed a pan-cancer model that predicts chemosensitivity using gene expression data derived from cancer cell lines. Here, we present 11 gene expression–based prediction models, 1 for each chemotherapy drug, that can be applied to multiple cancer types with a high degree of certainty. We selected these 11 chemotherapy drugs as representative members of 5 classes of chemotherapy agents (alkylating agents, anthracyclines, topoisomerase inhibitors, and antimetabolites). The choice of nontargeted agents allows us to predict the sensitivity of each chemotherapy drug across all relevant cancer types, lending to our pan-cancer model design.
There is a large body of research describing models that predict response to chemotherapy based on gene expression.5-9 However, this research landscape is limited to models predicting sensitivity to single- or few-agent chemotherapy drugs in a single cancer type.5-9 For example, a recent study reported a gene expression–based model that predicted response to treatment with taxane, cisplatin, and 5-fluorouracil in hypopharyngeal carcinoma.6 Similarly, multigene expression predictors of platinum resistance in ovarian carcinoma have been reported.8
The novelty of this research is the pan-cancer approach we took to building predictive models for sensitivity to 11 chemotherapy drugs. To our knowledge, this is the first pan-cancer predictive model for chemosensitivity. Using data from all 16 cancer types available in the Genomics of Drug Sensitivity in Cancer (GDSC) database, we were able to capture heterogeneity across tumor types, build gene expression–based prediction models for each chemotherapy drug, and apply the models to multiple cancer types with a high degree of certainty. Herein, we define “chemotherapies” as small molecules not targeted to an oncoprotein or prescribed due to a specific genetic aberration or cancer cell lineage phenotype. Developing a generalizable pan-cancer model that predicts sensitivity and/or resistance to multiple chemotherapy drugs provides clinicians with a data-driven decision-making toolkit for choosing chemotherapies based on clinical outcome predicted from tumor gene expression profiles of individual patients.
Methods
Datasets
We obtained publicly available data on gene expression and drug sensitivity profiles for 962 cancer cell lines, among which 676 to 766 cell lines reported sensitivity measures for the 11 chemotherapy drugs of interest.
Cell line data, which include both gene expression and drug sensitivity profiles, were obtained from the GDSC database.10 Clinical data and human tumor gene expression profiles originally compiled in The Cancer Genome Atlas (TCGA) were obtained from the University of California, Santa Cruz XENA database.11
Data processing
All computational work was done in the R statistical environment.12 To enable model building and validation between datasets consisting of RNA-seq as well as microarray data, data were normalized using feature-specific quantile normalization.13 Data were then scaled to provide equal weight for all available genes to be included in the models. Sensitivity data in the GDSC database is reported in the form of ln(IC50), which is a continuous variable. As we are developing models capable of predicting sensitivity or resistance to a given drug in human tumor samples, we must convert the continuous outcome variable reported by GDSC into a binary outcome variable that can be used for predictive model building. To accomplish this, cell lines were labeled sensitive or resistant based on the ln(IC50) sensitivity threshold for each drug determined by GDSC. The resulting classes showed an imbalance in data, with a greater number of resistant cell lines compared with sensitive (Table 1). This level of imbalance in classes can lead to classifiers that simply always predict the larger class, resulting in deceivingly high levels of accuracy, despite ignoring the smaller class.14,15 To correct for this class imbalance, synthetic-balanced datasets were generated using the “ROSE” R package,16 a bootstrap-based technique that oversamples the underrepresented class (sensitive) which incorporates the oversampling algorithm developed by Menardi and Torelli.17 Menardi and Torelli17 algorithm uses Gaussian kernel density estimates to generate clones of the underrepresented class that fall within a reasonable neighborhood of the observations. We chose this method to correct for class imbalance instead of simply replicating the underrepresented samples. This allows the classifier to learn more about the minority class, whereas replicating underrepresented samples limits the knowledge of the classifier, leading to overfitting of the model regarding the minority class.18
Table 1.
Number of sensitive and resistant cancer cell lines per chemotherapy drug.
| Drug | Sensitivity threshold ln(IC50) | Number of sensitive lines | Number of resistant lines |
|---|---|---|---|
| Bleomycin | −1.4805 | 4 | 37 |
| Camptothecin | −6.584 | 18 | 258 |
| Cisplatin | 1.3801 | 51 | 505 |
| Cytarabine | −1.9516 | 6 | 73 |
| Doxorubicin | −3.9565 | 25 | 320 |
| Etoposide | −1.2198 | 18 | 435 |
| Gemcitabine | −5.9903 | 30 | 469 |
| Methotrexate | −2.4743 | 19 | 285 |
| Mitomycin | −2.9647 | 5 | 33 |
| SN38 | −6.559 | 23 | 328 |
| Temozolomide | 4.6032 | 22 | 299 |
Abbreviation: GDSC, Genomics of Drug Sensitivity in Cancer.
The number of cancer cell lines labelled as “sensitive” or “resistant” according to thresholds set for each chemotherapy drug by GDSC.
Pan-cancer models were built using the synthetic (training) dataset for each chemotherapy drug separately and tested using the original imbalanced dataset from GDSC. To limit sources of bias, no a priori feature selection was performed to remove any genes from the training data. For TCGA samples, overall survival (OS) was observed by the “days_to_death.diagnoses” variable in the clinical data, and recurrence-free survival (RFS) was observed by the “days_to_new_tumor_event_after_initial_treatment” variable; if the RFS variable was not available, OS was used as the outcome variable.
Model building and testing
We used gene expression data derived from solid tumor cancer cell lines to build pan-cancer models that predict tumor sensitivity or resistance to chemotherapies (alkylating agents, anthracyclines, topoisomerase inhibitors, and antimetabolites) in patients, with the ultimate goal of creating gene expression–based predictive models for each drug that can be applied to multiple cancer types with a high degree of certainty. The project workflow is shown in Figure 1. To build clinically relevant models, only cell lines from cancer types where the drug in question is a standard therapy regimen according to the National Comprehensive Cancer Network (NCCN) were included in the training and testing data. For each chemotherapy drug, 10-fold cross-validated generalized linear models (GLM) were generated using the “glmnet” package. An elastic net penalization scheme, which incorporates the penalization schemes of both LASSO and ridge regression, was used to limit the number of genes included in the models.19 This is the ideal penalization scheme for this study because LASSO regression will only choose, at most, as many genes as samples (cell lines) included in the training data, and ridge regression will include all genes in the model.20 In addition, the “family=‘binomial’” argument was used because the outcome of interest is binomial in the sense that each cell line or tumor will be predicted to respond or not to any given chemotherapy drug. Tuning of the models was done by alteration of the α hyperparameter. The optimal value of α was determined using an iterative generation of GLM models with values of α ranging from 0.01 to 0.99, in increments of 0.01, to find the best predictive model based on maximization of model accuracy. This allows for finding the optimal α value between 0, which is used for ridge regression, and 1, which is used for LASSO regression. Pan-cancer models were then tested for accuracy on the testing set overall, as well as on individual cancer types to determine how well pan-cancer models predicted chemosensitivity/chemoresistance, with the number of cell lines with reported sensitivity measures per cancer type shown in Table S1.
Figure 1.
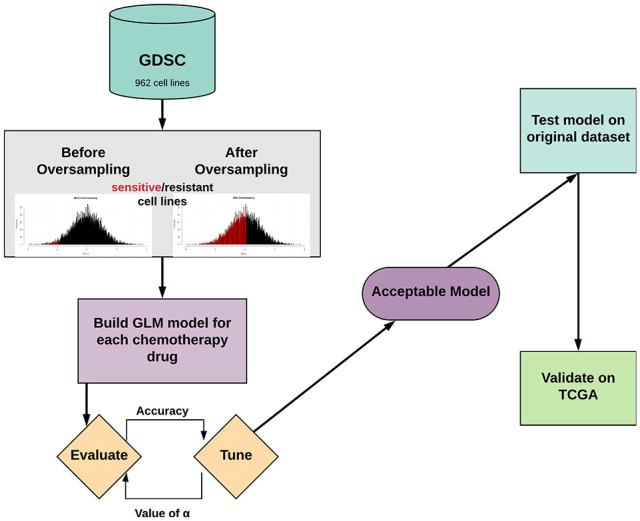
Project overview.
GDSC indicates Genomics of Drug Sensitivity in Cancer; GLM, generalized linear models; TCGA, The Cancer Genome Atlas.
External validation
Pan-cancer models were validated on human primary tumor data from TCGA. Pan-cancer models were tested against all combinations of solid tumor type and chemotherapy drug combination where n ⩾ 4 patients. After predicting sensitivity and resistance using pan-cancer models, survival curves were generated using the “survival” package,21 showing RFS of TCGA patients stratified by predicted labels, and log-rank P values were calculated using a Cox proportional hazards model22 adjusted for age, stage, and sex when these variables were available and appropriate, and with the null hypothesis that there will be no difference in RFS times between groups of patients with tumors predicted to be sensitive or resistant.
Model gene sets
To determine whether the genes included in the pan-cancer models were enriched for cancer hallmark gene sets in the Molecular Signatures Database (MSigDB),23 gene sets from the final models were analyzed for enrichment using Gene Set Enrichment Analysis (GSEA).24 The beta coefficient determined by the penalized regression model was reported for each gene included in each model ( Table S3).
Results
Building models to predict chemosensitivity and chemoresistance
We used gene expression data derived from solid tumor cancer cell lines to build pan-cancer models that predict tumor sensitivity or resistance to chemotherapies (alkylating agents, anthracyclines, topoisomerase inhibitors, and antimetabolites) in patients, with the ultimate goal of creating gene expression–based prediction models for each drug that can be applied to multiple cancer types with a high degree of certainty. We obtained publicly available data on gene expression and drug sensitivity profiles for 962 cancer cell lines. According to the NCCN database of drugs standardly used to treat individual cancer types, the number of relevant cell lines ranged from 38 for mitomycin to 556 for cisplatin. We then built pan-cancer models based on gene expression profiles to predict sensitivity and resistance to individual chemotherapy drugs.
Applying pan-cancer models to testing datasets
To initially verify the predictive accuracy of our models, we applied the pan-cancer models for each chemotherapy agent to predict sensitivity or resistance of the samples in the testing dataset of cell lines. Figure 2 shows the resulting sensitivity, specificity (A), accuracy with 95% confidence interval (CI) (B), and accuracy for each relevant cancer type (C) of the pan-cancer models being applied to predict sensitivity or resistance in the testing set. Overall, these models exhibited high levels of sensitivity and specificity (Figure 2A), which reflect the ability of the models to detect drug-sensitive and drug-resistant cell lines, respectively. Comparing models across drugs, results indicated a high level of predictive accuracy overall, with the SN-38 model being the least accurate (0.81, 95% CI [0.77, 0.985]) and the most accurate models being for bleomycin (0.93, 95% CI [0.85, 1.0]), temozolomide (0.88, 95% CI [0.84, 0.92]), and camptothecin (0.88, 95% CI [0.84, 0.92]) (Figure 2B). Pan-cancer models applied to relevant individual cancer types resulted in accuracies ranging from 0.61 in bone cancer cell lines treated with cisplatin to 0.98 in skin cancer cell lines treated with temozolomide (Figure 2C). Within individual cancer types, predictions were consistently strong across all drugs tested apart from bone cancers generally being weakly predicted.
Figure 2.

Testing results. Performance measures from application of pan-cancer models to testing data are shown for all drug models, including sensitivity and specificity (A), overall accuracy with 95% CI (B), and accuracy when pan-cancer model is applied to each relevant cancer type in the testing dataset (C), where accuracy results are colored from dark blue (0.50) to deep red (1.00).
CI indicates confidence interval; NSCLC, non-small cell lung cancer.
External validation of models on patient data
Pan-cancer models were validated by assessing their ability to predict tumor sensitivity or resistance in clinical datasets and evaluating RFS. Because this study focused on generating models for conventional chemotherapies, therapeutic agents that target mutant proteins were excluded from these analyses (eg, BRAF inhibitors used for the treatment of BRAF-mutant melanoma,25,26 or epidermal growth factor receptor [EGFR] inhibitors used to treat EGFR-mutant lung cancer27,28). Pan-cancer models for each chemotherapeutic were applied to TCGA cancer types with RFS data for patients treated with the same drugs in a monotherapy setting. For any chemotherapy drug and TCGA cancer type combination resulting in n ⩾ 4 patients, each patient was predicted as “sensitive” or “resistant” to the chemotherapeutic using the previously built cell line–based predictive models and the adjusted log-rank P value was calculated to assess the difference in RFS between predicted groups. Recurrence-free survival curves separated by predicted labels with 95% CIs were plotted (Figure 3).
Figure 3.

Recurrence-free survival and RFS distributions based on predicted chemosensitivity or chemoresistance. Patients were predictively labeled as sensitive or resistant by pan-cancer models according to gene expression. Recurrence-free survival curves were generated and statistically measured by the log-rank test with risk tables displayed below. The Cancer Genome Atlas cohorts depicted are patients with bladder cancer (TCGA-BLCA) treated with cisplatin (n = 47) (A), patients with cervical cancer (TCGA-CESC) treated with cisplatin (n = 99) (B), patients with breast cancer (TCGA-BRCA) treated with doxorubicin (n = 46) (C), patients with pancreatic adenocarcinoma (TCGA-PAAD) treated with gemcitabine (n = 72) (D), patients with glioblastoma (TCGA-GBM) treated with temozolomide (n = 72) (E). Patients predicted to have sensitive tumors are shown in green, and those predicted to be resistant are shown in purple.
RFS indicates recurrence-free survival; TCGA, The Cancer Genome Atlas.
The majority of the subsets that fit our criteria for analysis included patients treated with cisplatin or gemcitabine. With a significance threshold of P = .05, survival analysis predicted response in patient subsets treated with cisplatin and gemcitabine, but not doxorubicin or temozolomide (Figure 3). The cisplatin pan-cancer models performed well in distinguishing patients with sensitive vs resistant tumors based on RFS in bladder cancer (P = .048), showing a majority of the resistant tumors recurring before 5 years (Figure 3A). In cervical cancer (P = .070), all the samples predicted as “resistant” have recurred by the 5-year mark (Figure 3B). The gemcitabine pan-cancer model performed well in distinguishing patients with sensitive vs resistant tumors based on RFS in pancreatic adenocarcinoma (P = .038), showing all the resistant tumors recurring before 5 years (Figure 3D). The log-rank P values for all other patient subsets tested are shown in Table S2.
Enrichment analysis of model gene sets
To determine whether the genes included in the pan-cancer models were enriched for traditional cancer hallmarks, genes for each model were analyzed via GSEA and the hallmark gene sets in MSigDB. Of the 50 hallmark gene sets, 15 were significantly enriched (false discovery rate q < 0.05) in the genes of at least 1 model ( Figure S1). The most commonly represented gene sets were “p53 Pathway and ‘Xenobiotic Metabolism’,” followed by “TNFa Signaling via NFKb” and “MTORC1 Signaling.” This may denote that these pathways play a larger role in the response to these chemotherapies than other pathways.
The genes included in each model were ranked according to their corresponding beta coefficient ( Table S3), effectively ranking the genes in order of how great their level of expression affects the decision of the model to predict a sample as “sensitive.” The number of genes included in each model varied greatly (n = 24 for cisplatin to n = 175 for cytarabine) ( Table S3).
Discussion
This research describes the first pan-cancer predictive model for chemosensitivity using gene expression data as a predictor for RFS. We validated 11 predictive models, 1 for each chemotherapy drug, that are published on Github and can be accessed by researchers to predict patient outcome based on a gene expression profile from an individual’s tumor. For our bioinformatic approach, we leveraged established methodology, including GLMs, with matching performance in predicting clinical models to machine learning algorithms.29 The resulting pan-cancer model accurately predicted drug sensitivity and/or resistance for several cancer type/drug combinations (Figure 2).
When considering the models developed from synthetic training data and the resulting accuracy when predicting sensitivity/resistance to drugs using GDSC cell line testing data, certain cancer type/drug combinations that reflect standard treatments showed above-average predictive performance. For example, the accuracy of the temozolomide pan-cancer model applied to skin cancer cell lines was 0.98 (Figure 2C); recent studies have shown methotrexate to be an effective treatment for skin cancers in humans.30-32 Results such as these suggest that pan-cancer models can be relied on to provide meaningful insights that are applicable to specific cancer types regarding identifying treatments that are known to be clinically relevant.
The results of the pan-cancer models being validated on human tumor data from TCGA show that pan-cancer models based on cell lines can predict not only sensitivity of human tumors but also sensitivity to standard (ie, approved) therapies for certain cancer types. The cisplatin pan-cancer model significantly (P = .014) predicted sensitivity vs resistance when RFS was considered for human ovarian cancers (TCGA-OV). This model outperforms some single-therapy, single-cancer studies recently reported that predict sensitivity to cisplatin in ovarian cancer: a model reported by Murakami et al33 significantly (P = .02) predicted cisplatin sensitivity in the same cohort of patients with TCGA-OV.
When validating the doxorubicin pan-cancer model, only the TCGA breast cancer (TCGA-BRCA) cohort met our requirements for analysis, which contained 46 patients treated with doxorubicin. Our model did not significantly (P = .093) predict doxorubicin sensitivity (Figure 3C), which has been shown to be possible in some studies34 and difficult in others.35 Among the successful attempts is the study by Chen et al,34 where they were able to significantly (P = .018) predict doxorubicin sensitivity in 171 patients with estrogen receptor–negative breast cancer using a cell line–derived model to predict sensitivity of human tumors. Among the less successful attempts is the study by Lee et al,35 who attempted to predict sensitivity of breast cancer tumors treated with doxorubicin by using a cell line–derived model, which resulted in an area under the curve value 0.5. While our doxorubicin pan-cancer model did not significantly predict sensitivity based on RFS in breast cancer patients with doxorubicin, it did perform better than some previously published studies.
One of the limitations of our study was that, due to the imbalance of sensitive and resistant cell lines based on thresholds determined by GDSC, we used synthetic datasets to build our pan-cancer models. Although this approach may superficially seem ill-advised for building clinical models, the use of synthetic datasets has been shown to improve accuracy in settings of building predictive models for means of medical diagnosis.36 In addition, because our synthetic training data included oversampling of the sensitive cell lines, this may have slightly inflated the sensitivity of the pan-cancer models when applied to the testing data reported in Figure 2A.
Our pan-cancer gene expression and drug sensitivity analysis confirm known biomarkers for chemosensitivity that have been reported in the literature for individual cancer types. For example, we report a negative association between O-6-methylguanine-DNA methyltransferase (MGMT) expression and temozolomide sensitivity ( Table S3), consistent with reports of elevated MGMT activity conferring resistance to temozolomide in glioblastoma.37 In addition, we report SLFN11 as the top predictor gene for chemosensitivity to camptothecin, gemcitabine, cisplatin, etoposide, and SN38 ( Table S3). These findings are consistent with SLFN11 as a well-known predictor of chemosensitivity38 to camptothecin in Ewing sarcoma39 and a strong predictor of sensitivity to cisplatin in ovarian cancer,40,41 etoposide in small cell lung cancer,42 and gemcitabine in breast, lung, and ovarian cancers.43 These consistencies speak to the accuracy of our model, lending confidence in the application of pan-cancer approaches to model building when including relevant cancer types to expand the scope of clinical applicability beyond 1 or few cancer types.
Another method currently used to predict sensitivity to platinum-based agents (eg, cisplatin) is homologous recombination deficiency (HRD) scoring,44,45 which entails examining the prevalence of germline mutations in genes involved in homologous combination DNA damage repair,45 namely BRCA, ATM, PALB2, and RAD50 among others. The list of genes included in the model created to predict sensitivity to cisplatin does not include any of these genes, which is not altogether surprising as traditional HRD scoring involves DNA sequencing and looking at mutations whereas our approach involved RNA sequencing and looking at expression levels.
One of the major strengths of our study is that we used the actual sensitivity thresholds determined by GDSC to label cell lines as sensitive or resistant. Several recent studies that used publicly available cell line data to build models labeled their training data by using the median of the reported drug sensitivity outcome measure.5,7,46,47 This practice creates a balanced training dataset, yet the labels being used already induce error, particularly when cell lines are being labeled as “sensitive” when in reality they are not sensitive to the drug in question, which ultimately can lead to further labeling tumors in any validation data as “sensitive” when in fact they are not. This could have serious consequences if the decisions of the model in question were ever put into clinical practice, as patients with tumors thought to be drug sensitive would in fact be receiving chemotherapy treatment to which their tumors would actually be resistant.
Chemotherapy drugs are often administered to patients in combination, but our pan-cancer models focus on single agents. There are little publicly available data that integrate gene expression profiles and response to combination chemotherapies. In addition, the main source of publicly available human tumor data, TCGA, has little information regarding drug responses in patients with gene expression data available. For example, in the TCGA-BRCA dataset, there are 1217 patients with gene expression data, of which only 820 also have accompanying clinical data with 117 of those listing drug or drug combination treatments. The limited number of patients with treatment records in some instances can make it difficult to find enough samples to create and/or validate predictive models for a given cancer type/drug combination. Increases in the numbers of patients with both gene expression and drug response data would allow predictive models to be built and validated exclusively on patient data and remove the need to transition between cell line and human tumor datasets.
The clinical significance of the outcome of this work is its potential for clinical utility to aid the decision-making process when choosing efficacious treatments for individual patients. In this age of precision medicine, patient RNA sequence data—obtained from a tumor biopsied at the time of diagnosis—can be directly input into any 1 of our 11 chemosensitivity models to predict clinical outcome for an individual patient.
Supplemental Material
Supplemental material, sj-pdf-1-cix-10.1177_11769351211002494 for Pan-Cancer Transcriptional Models Predicting Chemosensitivity in Human Tumors by Jason D Wells, Jacqueline R Griffin and Todd W Miller in Cancer Informatics
Supplemental material, sj-xlsx-2-cix-10.1177_11769351211002494 for Pan-Cancer Transcriptional Models Predicting Chemosensitivity in Human Tumors by Jason D Wells, Jacqueline R Griffin and Todd W Miller in Cancer Informatics
Acknowledgments
The results published here are in whole or part based on data generated by The Cancer Genome Atlas Research Network: https://www.cancer.gov/tcga.
Footnotes
Funding:The author(s) disclosed receipt of the following financial support for the research, authorship, and/or publication of this article: This work was supported by the Burroughs Wellcome Big Data in the Life Sciences Training Program (fellowship to J.D.W.), Friends of the Norris Cotton Cancer Center (Scholar Award to T.W.M.), National Institutes of Health (R01CA211869 and R01CA200994 to T.W.M., and Dartmouth College Norris Cotton Cancer Center Support Grant P30CA023108), and Susan G. Komen (CCR1533084 to T.W.M.).
Declaration of conflicting interests:The author(s) declared no potential conflicts of interest with respect to the research, authorship, and/or publication of this article.
Author Contributions: TWM conceptualized the study; JDW conducted the formal analysis and investigation, and wrote the original draft of the article; TWM supervised the study; and all authors developed the study methodology and reviewed and edited the article.
ORCID iD: Jason D Wells  https://orcid.org/0000-0002-3451-4304
Supplemental Material: Supplemental material for this article is available online.
Availability and Implementation: All source code used to analyze data and generate figures can be found at https://github.com/JWellsBio/Chemosensitivity. Contact: Todd.W.Miller@Dartmouth.edu.
References
- 1. Siegel RL, Miller KD, Jemal A. Cancer statistics, 2017. CA Cancer J Clin. 2017;67:7-30. [DOI] [PubMed] [Google Scholar]
- 2. Heron M. Deaths: leading causes for 2015. Natl Vital Stat Rep. 2017;66:1-76. [PubMed] [Google Scholar]
- 3. Division of Cancer Control and Population Sciences, N.C.I. Surveillance, Epidemiology, and End Results (SEER) Program, 18 SEER Registries (Released April 2013, based on the November 2012 submission, 1973-2010). Atlanta, GA: American Cancer Society; 2013. [Google Scholar]
- 4. Motzer RJ, Jonasch E, Agarwal N, et al. Kidney cancer, version 2.2017, NCCN clinical practice guidelines in oncology. J Natl Compr Canc Netw. 2017;15:804-834. [DOI] [PubMed] [Google Scholar]
- 5. Shahid M, Choi TG, Nguyen MN, et al. An 8-gene signature for prediction of prognosis and chemoresponse in non-small cell lung cancer. Oncotarget. 2016;7:86561-86572. [DOI] [PMC free article] [PubMed] [Google Scholar]
- 6. Zhong Q, Fang J, Huang Z, et al. A response prediction model for taxane, cisplatin, and 5-fluorouracil chemotherapy in hypopharyngeal carcinoma. Sci Rep. 2018;8:12675. [DOI] [PMC free article] [PubMed] [Google Scholar]
- 7. Wei H, Li J, Xie M, Lei R, Hu B. Comprehensive analysis of metastasis-related genes reveals a gene signature predicting the survival of colon cancer patients. PeerJ. 2018;6:e5433. [DOI] [PMC free article] [PubMed] [Google Scholar]
- 8. Ferriss JS, Kim Y, Duska L, et al. Multi-gene expression predictors of single drug responses to adjuvant chemotherapy in ovarian carcinoma: predicting platinum resistance. PLoS ONE. 2012;7:e30550. [DOI] [PMC free article] [PubMed] [Google Scholar]
- 9. Gonzalez Bosquet J, Newtson AM, Chung RK, et al. Prediction of chemo-response in serous ovarian cancer. Mol Cancer. 2016;15:66. [DOI] [PMC free article] [PubMed] [Google Scholar]
- 10. Yang W, Soares J, Greninger P, et al. Genomics of drug sensitivity in cancer (GDSC): a resource for therapeutic biomarker discovery in cancer cells. Nucleic Acids Res. 2013;41:D955-D961. [DOI] [PMC free article] [PubMed] [Google Scholar]
- 11. Goldman M, Craft B, Hastie M, et al. The UCSC Xena platform for public and private cancer genomics data visualization and interpretation. bioRxiv. https://www.biorxiv.org/content/10.1101/326470v5. Published 2019.
- 12. R Core Team. R: A Language and Environment for Statistical Computing. Vienna, Austria: R Foundation for Statistical Computing; 2019. [Google Scholar]
- 13. Franks JM, Cai G, Whitfield ML. Feature specific quantile normalization enables cross-platform classification of molecular subtypes using gene expression data. Bioinformatics. 2018;34:1868-1874. [DOI] [PMC free article] [PubMed] [Google Scholar]
- 14. Cramer JS. Predictive performance of the binary logit model in unbalanced samples. J Roy Stat Soc D: Sta. 1999;48:85-94. [Google Scholar]
- 15. King G, Zeng L. Logistic regression in rare events data. Polit Anal. 2001;9:137-163. [Google Scholar]
- 16. Lunardon N, Menardi G, Nicola T. ROSE: a package for binary imbalanced learning. R J. 2014;6:82-92. [Google Scholar]
- 17. Menardi G, Torelli N. Training and assessing classification rules with imbalanced data. Data Min Knowl Disc. 2014;28:92-122. [Google Scholar]
- 18. Chawla NV. C4.5 and imbalanced data sets: investigating the effect of sampling method, probabilistic estimate, and decision tree structure. Paper presented at: ICML Workshop on Learning from Imbalanced Data sets; August 21, 2003; Washington, DC. https://www3.nd.edu/~dial/publications/chawla2003c45.pdf. [Google Scholar]
- 19. Zou H, Hastie T. Regularization and variable selection via the elastic net (vol B 67, pg 301, 2005). J Roy Stat Soc B. 2005;67:768-768. [Google Scholar]
- 20. Ogutu JO, Schulz-Streeck T, Piepho H-P. Genomic selection using regularized linear regression models: ridge regression, lasso, elastic net and their extensions. BMC Proc. 2012;6:S10. [DOI] [PMC free article] [PubMed] [Google Scholar]
- 21. Therneau TM, Grambsch PM. Modeling Survival Data: Extending the Cox Model. Berlin, Germany: Springer; 2000. [Google Scholar]
- 22. Cox D. Regression models and life tables (with discussion). J Roy Stat Soc B Met. 1972;34:187-220. [Google Scholar]
- 23. Liberzon A, Subramanian A, Pinchback R, Thorvaldsdóttir H, Tamayo P, Mesirov JP. Molecular signatures database (MSigDB) 3.0. Bioinformatics. 2011;27:1739-1740. [DOI] [PMC free article] [PubMed] [Google Scholar]
- 24. Subramanian A, Tamayo P, Mootha VK, et al. Gene set enrichment analysis: a knowledge-based approach for interpreting genome-wide expression profiles. Proc Natl Acad Sci USA. 2005;102:15545-15550. [DOI] [PMC free article] [PubMed] [Google Scholar]
- 25. Ahn JH, Hwang SH, Cho HS, Lee M. Differential gene expression common to acquired and intrinsic resistance to BRAF inhibitor revealed by RNA-seq analysis. Biomol Ther (Seoul). 2019;27:302-310. [DOI] [PMC free article] [PubMed] [Google Scholar]
- 26. Luebker SA, Koepsell SA. Diverse mechanisms of BRAF inhibitor resistance in melanoma identified in clinical and preclinical studies. Front Oncol. 2019;9:268. [DOI] [PMC free article] [PubMed] [Google Scholar]
- 27. Spencer SA, Riley AC, Matthew A, Di Pasqua AJ. Brigatinib: novel ALK inhibitor for non-small-cell lung cancer. Ann Pharmacother. 2019;53:621-626. [DOI] [PubMed] [Google Scholar]
- 28. Yi L, Fan J, Qian R, Luo P, Zhang J. Efficacy and safety of osimertinib in treating EGFR-mutated advanced NSCLC: a meta-analysis. Int J Cancer. 2019;145:284-294. [DOI] [PMC free article] [PubMed] [Google Scholar]
- 29. Christodoulou E, Ma J, Collins GS, Steyerberg EW, Verbakel JY, Van Calster B. A systematic review shows no performance benefit of machine learning over logistic regression for clinical prediction models. J Clin Epidemiol. 2019;110:12-22. [DOI] [PubMed] [Google Scholar]
- 30. Quirbt I, Verma S, Petrella T, Bak K, Charette M; and members of the Melanoma Disease Site Group of Cancer Care Ontario’s Program in Evidence-Based Care. Temozolomide for the treatment of metastatic melanoma. Curr Oncol. 2007;14:27-33. [DOI] [PMC free article] [PubMed] [Google Scholar]
- 31. Polesie S, Gillstedt M, Paoli J, Osmancevic A. Methotrexate treatment in patients with a history of cutaneous melanoma and the risk of a consecutive primary melanoma: a national retrospective registry-based cohort study. J Am Acad Dermatol. 2017;77:161-163. [DOI] [PubMed] [Google Scholar]
- 32. Moss M, Weber E, Hoverson K, Montemarano AD. Management of keratoacanthoma: 157 tumors treated with surgery or intralesional methotrexate. Dermatol Surg. 2019;45:877-883. [DOI] [PubMed] [Google Scholar]
- 33. Murakami R, Matsumura N, Brown JB, et al. Prediction of taxane and platinum sensitivity in ovarian cancer based on gene expression profiles. Gynecol Oncol. 2016;141:49-56. [DOI] [PubMed] [Google Scholar]
- 34. Chen YZ, Kim Y, Soliman HH, Ying G, Lee JK. Single drug biomarker prediction for ER-breast cancer outcome from chemotherapy. Endocr Relat Cancer. 2018;25:595-605. [DOI] [PMC free article] [PubMed] [Google Scholar]
- 35. Lee JK, Coutant C, Kim YC. Prospective comparison of clinical and genomic multivariate predictors of response to neoadjuvant chemotherapy in breast cancer. Clin Cancer Res. 2010;16:711-718. [DOI] [PMC free article] [PubMed] [Google Scholar]
- 36. Han W, Huang Z, Li S, Jia Y. Distribution-sensitive unbalanced data oversampling method for medical diagnosis. J Med Syst. 2019;43:39. [DOI] [PubMed] [Google Scholar]
- 37. Esteller M, Garcia-Foncillas J, Andion E, et al. Inactivation of the DNA-repair gene MGMT and the clinical response of gliomas to alkylating agents. N Engl J Med. 2000;343:1350-1354. [DOI] [PubMed] [Google Scholar]
- 38. Barretina J, Caponigro G, Stransky N, et al. The cancer cell line encyclopedia enables predictive modelling of anticancer drug sensitivity. Nature. 2012;483:603-607. [DOI] [PMC free article] [PubMed] [Google Scholar]
- 39. Tang SW, Bilke S, Cao L, et al. SLFN11 is a transcriptional target of EWS-FLI1 and a determinant of drug response in Ewing sarcoma. Clin Cancer Res. 2015;21:4184-4193. [DOI] [PMC free article] [PubMed] [Google Scholar]
- 40. Nogales V, Reinhold WC, Varma S, et al. Epigenetic inactivation of the putative DNA/RNA helicase SLFN11 in human cancer confers resistance to platinum drugs. Oncotarget. 2016;7:3084-3097. [DOI] [PMC free article] [PubMed] [Google Scholar]
- 41. Zoppoli G, Regairaz M, Leo E, et al. Putative DNA/RNA helicase Schlafen-11 (SLFN11) sensitizes cancer cells to DNA-damaging agents. Proc Natl Acad Sci USA. 2012;109:15030-15035. [DOI] [PMC free article] [PubMed] [Google Scholar]
- 42. Gardner EE, Lok BH, Schneeberger VE, et al. Chemosensitive relapse in small cell lung cancer proceeds through an EZH2-SLFN11 axis. Cancer Cell. 2017;31:286-299. [DOI] [PMC free article] [PubMed] [Google Scholar]
- 43. Shee K, Wells JD, Jiang A, Miller TW. Integrated pan-cancer gene expression and drug sensitivity analysis reveals SLFN11 mRNA as a solid tumor biomarker predictive of sensitivity to DNA-damaging chemotherapy. PLoS ONE. 2019;14:e0224267. [DOI] [PMC free article] [PubMed] [Google Scholar]
- 44. Telli ML, Timms KM, Reid J, et al. Homologous recombination deficiency (HRD) score predicts response to platinum-containing neoadjuvant chemotherapy in patients with triple-negative breast cancer. Clin Cancer Res. 2016;22:3764-3773. [DOI] [PMC free article] [PubMed] [Google Scholar]
- 45. Heeke AL, Pishvaian MJ, Lynce F, et al. Prevalence of homologous recombination-related gene mutations across multiple cancer types. JCO Precis Oncol. 2018;2:PO.17.00286. [DOI] [PMC free article] [PubMed] [Google Scholar]
- 46. Emdadi A, Eslahchi C. DSPLMF: a method for cancer drug sensitivity prediction using a novel regularization approach in logistic matrix factorization. Front Genet. 2020;11:75. [DOI] [PMC free article] [PubMed] [Google Scholar]
- 47. Li B, Shin H, Gulbekyan G, et al. Development of a drug-response modeling framework to identify cell line derived translational biomarkers that can predict treatment outcome to erlotinib or sorafenib. PLoS ONE. 2015;10:e0130700. [DOI] [PMC free article] [PubMed] [Google Scholar]
Associated Data
This section collects any data citations, data availability statements, or supplementary materials included in this article.
Supplementary Materials
Supplemental material, sj-pdf-1-cix-10.1177_11769351211002494 for Pan-Cancer Transcriptional Models Predicting Chemosensitivity in Human Tumors by Jason D Wells, Jacqueline R Griffin and Todd W Miller in Cancer Informatics
Supplemental material, sj-xlsx-2-cix-10.1177_11769351211002494 for Pan-Cancer Transcriptional Models Predicting Chemosensitivity in Human Tumors by Jason D Wells, Jacqueline R Griffin and Todd W Miller in Cancer Informatics