

Abstract
This study focuses on determining the real-time functionality of a customized interface and investigating the optimal parameters for intra-cardiac subharmonic aided pressure estimation (SHAPE) utilizing Definity Lantheus Medical Imaging Inc) and Sonazoid (GE Healthcare) microbubbles. Pressure measurements within the chambers of the heart yield critical information for managing cardiovascular diseases. An alternative to current, invasive, clinical cardiac catheterization procedures is utilizing ultrasound contrast agents and SHAPE to noninvasively estimate intra-cardiac pressures. Therefore, this work developed a customized interface (on a SonixTablet, BK Ultrasound) for real-time intra-cardiac SHAPE. In vitro, a Doppler flow phantom was utilized to mimic the dynamic pressure changes within the heart. Definity (15.0 to 22.5 μL microspheres; corresponding to 0.1 to 0.15 mL) and Sonazoid (GE Healthcare; 0.4 to 1.2 μL microspheres; corresponding to 0.05 to 0.15 mL) microbubbles were used. Data was acquired for varying transmit frequencies (2.5–4.0 MHz), and pulse shaping options (square wave and chirp down) to determine optimal transmit parameters. Simultaneously obtained radiofrequency data and ambient pressure data were compared. For Definity, the chirp down pulse at 3.0 MHz yielded the highest correlation (r = −0.77 ± 0.2) between SHAPE and pressure catheter data. For Sonazoid, the square wave pulse at 2.5 MHz yielded the highest correlation (r = −0.72 ± 0.2). In conclusion, the real-time functionality of the customized interface has been verified and the optimal parameters for utilizing Definity and Sonazoid for intra-cardiac SHAPE have been determined.
Index Terms—: incident acoustic output optimization, real-time noninvasive pressure estimation, subharmonic aided pressure estimation, subharmonic signals, ultrasound contrast agents
I. Introduction
The purpose of this work was to develop an interface for enabling real-time intra-cardiac subharmonic aided pressure estimation (SHAPE) and determine the optimal parameters for intra-cardiac SHAPE using this interface. There are currently 92.1 million Americans suffering from multiple cardiovascular diseases or the after-effects of stroke [1]. Treatment options range from drug therapy to heart transplantation. In order to diagnose and manage these diseases, pressure measurements within the chambers of the heart are required, because these measurements provide critical information on cardiac function and status. The current standard of care approach to obtain pressure measurements in the heart is a cardiac catheterization procedure. This procedure is invasive and precludes frequent monitoring. While multiple approaches have been investigated for pressure estimation using ultrasound contrast agents (UCAs), none achieved errors in estimated pressure values, relative to a reference standard, that were clinically acceptable [2]–[6]. For clinical translation it is recommended that the errors for noninvasive blood pressure estimation should be less than 5 mmHg relative to clinical pressures [7]. An accurate, cost-effective, noninvasive approach to measure intra-cardiac pressures is needed. Based on previous studies, subharmonic aided pressure estimation (SHAPE) has shown promise as a technique to meet this clinical need [8] – [11].
The SHAPE technique utilizes UCAs as noninvasive pressure sensors. Ultrasound contrast agents are gas filled, encapsulated microbubbles (mean diameter < 8 μm) that traverse the entire vasculature [12]–[14]. When UCAs are insonated in vivo at acoustic pressures greater than 200 kPa, they act as nonlinear oscillators [12]. These nonlinear oscillations yield energy components in the received echo signals at frequencies ranging from the subharmonic (half of transmit frequency) to higher harmonics and even ultraharmonics [13], [14].
Research into subharmonic signal generation started with the seminal paper published in 1969 by Eller and Flynn, and is still ongoing [15]. In 2010, Frinking et al. explored the relationship between subharmonics and the behavior (specifically the compression behavior) of phospholipid microbubbles [16]. The authors found that the subharmonic signals present in the echo responses of phospholipid-shell microbubbles excited at around twice the resonance frequency (at acoustic pressures less than 30 kPa), are related to the echo responses from compression-only bubbles. This behavior was predicted by the Marmottant model and is marked with an increase in subharmonic amplitude as a function of overpressure [17]–[18]. Similar microbubble behavior was observed in a 2020 study, conducted by Nio et al, where the use of SonoVue for noninvasive aortic pressure estimation was investigated [19].
In 1999, Shi et al. showed that the subharmonic amplitude undergoes a rapid growth in the intermediate acoustic pressure range (0.3–0.6 MPa) with slower increases at relatively lower and higher acoustic pressures [8]. The authors concluded that subharmonic generation can be divided into three stages: occurrence, growth, and saturation. In the growth stage, the subharmonic amplitude increases rapidly with acoustic pressure and an excellent correlation (r = −0.98) was found between the subharmonic amplitude in the growth stage and ambient hydrostatic pressure [8]. Subsequent in vitro, pre-clinical, and clinical pilot studies revealed that subharmonic signal can be used to noninvasively estimate pressures (using SHAPE) by exploiting the inverse linear relationship between changes in the subharmonic signal and changes in hydrostatic pressures [8]–[11], [20]–[24].
For previous in vitro, pre-clinical and clinical studies, the incident acoustic output (IAO) eliciting ambient pressure sensitive subharmonics (i.e., subharmonics in the growth stage) was identified after acquiring data at several different IAO levels [9]–[11]. For instance, in one in vitro study, data was acquired at 5 IAO levels and then the IAO eliciting growth stage subharmonic signals was selected for pressure estimation [24]. While this approach is feasible for in vitro and pre-clinical studies, for clinical use of the SHAPE technique determining the optimal IAO level for SHAPE in real-time is a limiting factor; specifically, because this optimal IAO level will vary on a case-by-case basis in patients due to attenuation differences. Overcoming this limitation is critical for transitioning SHAPE into clinical applications, because acquiring data at all available acoustic outputs and then post-processing precludes real-time investigations. In another study, the concept of utilizing specific growth stage subharmonic signals (showing the maximum change in the subharmonic amplitude with increases in IAO levels) was investigated for SHAPE [25]. The results showed that at this optimal IAO level, the changes in subharmonic signal tracked changes in ambient pressure whereas at IAO levels above and below the optimal IAO level there were relatively high errors in estimated pressure values with the SHAPE technique [25].
A clinical pilot study specifically comparing intra-cardiac pressures acquired using a pressure catheter to pressures estimated using the SHAPE technique was performed in 15 adults scheduled for left and/or right heart catheterization [9]. Data was acquired at three IAO levels (0 dB or 100% of acoustic output corresponding to 897 kPapeak–to–peak; −2 dB or 79% acoustic output and −4 dB or 63% acoustic output) on a Sonix RP scanner using a PA4–2 transducer [9]. Radiofrequency (RF) and catheter data were acquired simultaneously, then subharmonic signal was extracted from the RF data and compared with the catheter pressures [9]. At the optimal IAO, differences between SHAPE estimates and the catheter results were as low as 2.6 mmHg. This study highlights the possibility of using SHAPE for estimating clinically relevant cardiac pressures, but it also highlights the limitations involved in translating this technique for real-time pressure estimation [9]. Hence, an algorithm to find optimal IAO in real-time for dynamically varying pressures (e.g., intra-cardiac pressures during a single cardiac cycle) needs to be implemented. The novel contribution of this work is in developing a customized interface for intra-cardiac SHAPE that processes and displays subharmonic signal variations indicative of ambient pressure changes, and that assists in tailoring data acquisition at the optimal IAO levels compensating for attenuation differences between patients.
II. Methods
To determine optimum IAO in real-time, the SHAPE algorithm was developed (Fig. 1) and implemented on a SonixTablet (BK Ultrasound, Peabody, MA, USA) ultrasound scanner. The SonixTablet scanner was selected for this particular application because it is an open-platform device with the ability to capture and process raw RF and Doppler signals for customized applications.
Fig. 1.
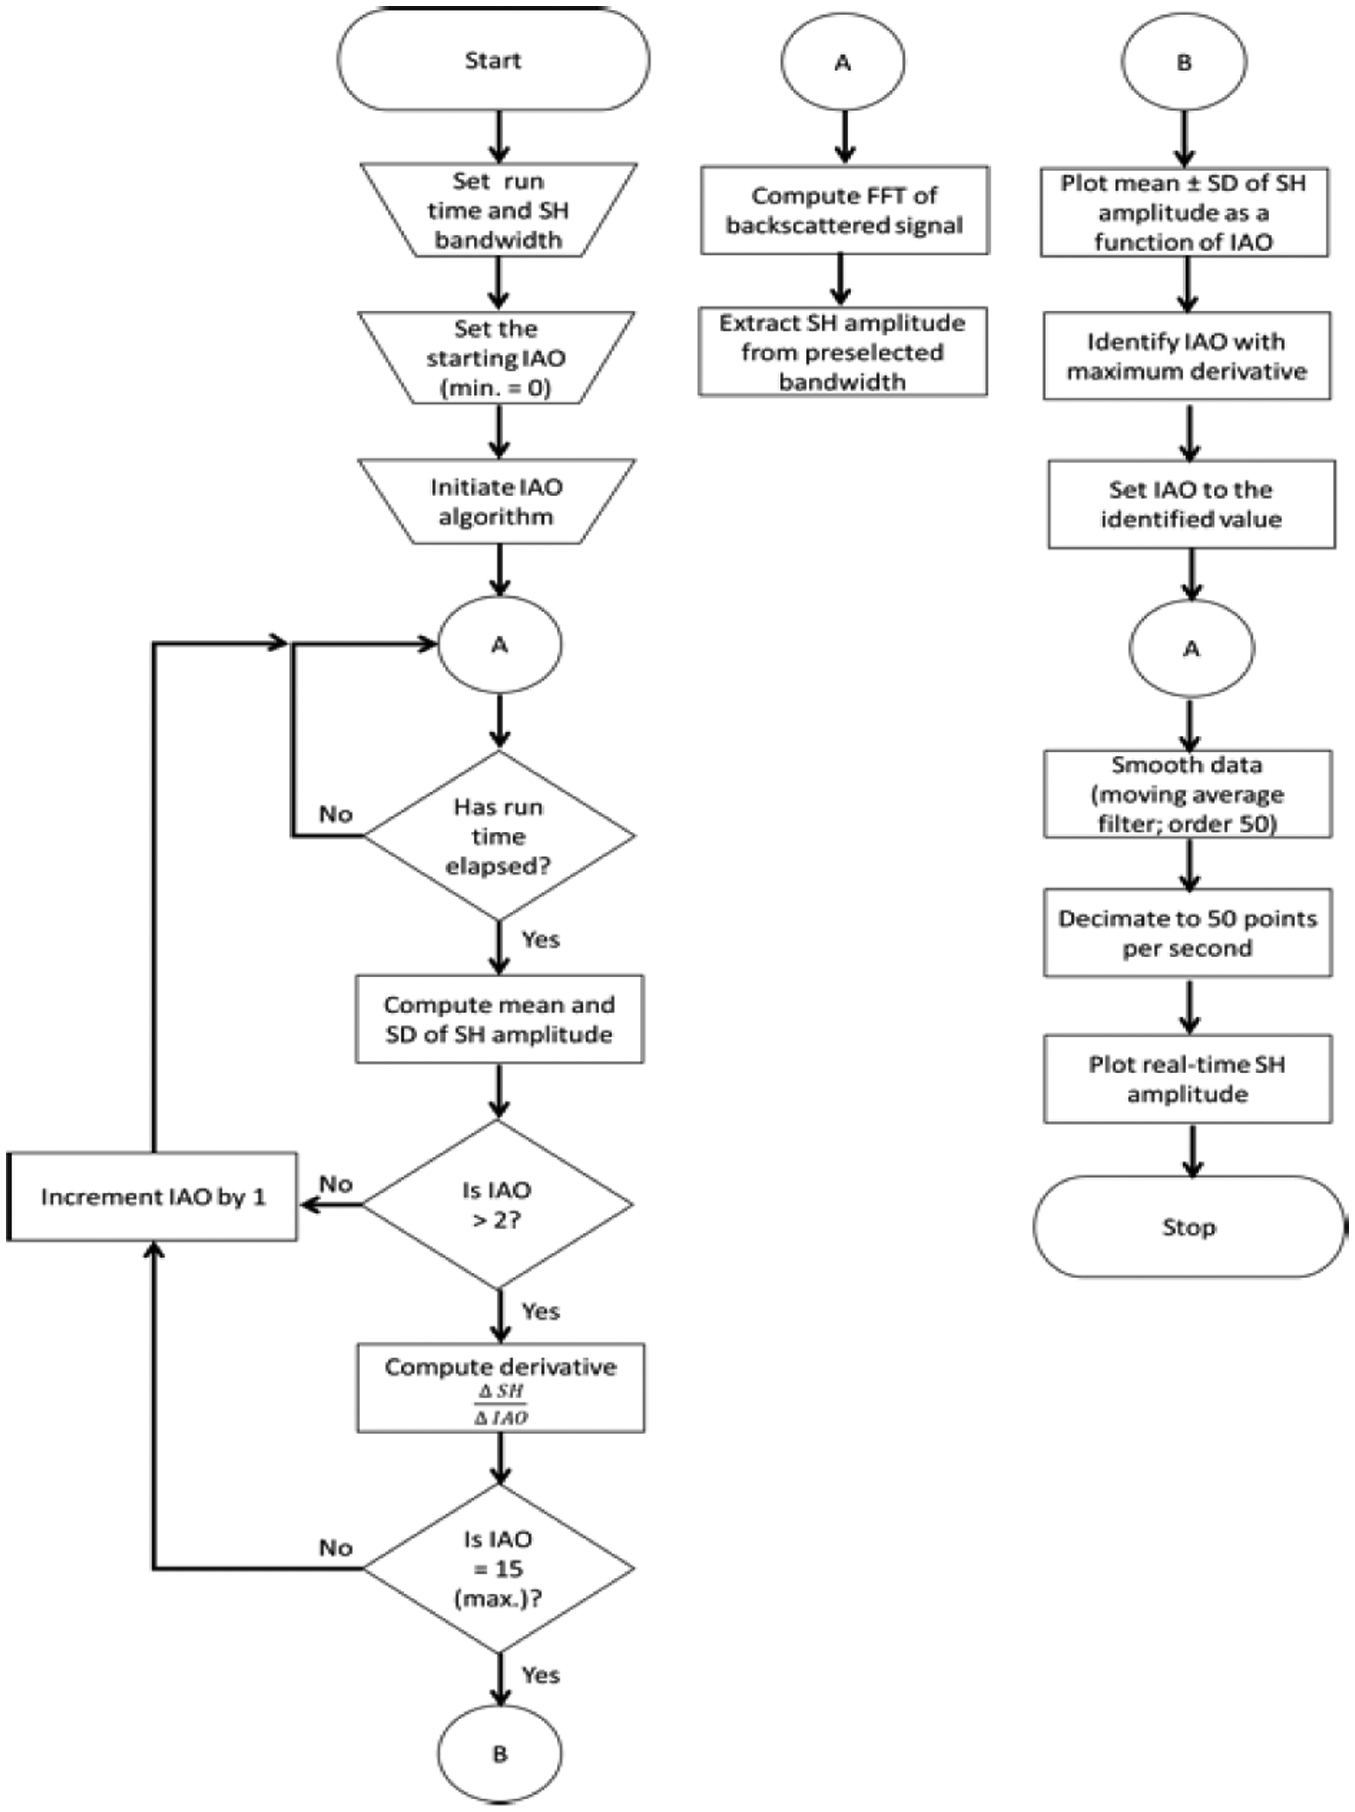
Flowchart of the SHAPE algorithm implemented on the SonixTablet scanner (IAO - incident acoustic output; FFT - fast Fourier transform; SD - standard deviation; SH - subharmonic amplitude; min. - minimum and max. - maximum).
To determine the optimal IAO, the IAO optimization algorithm is executed. As shown in Fig. 1, at first, a user inputs the duration of data-capture at each IAO level (configurable from 0 secs to 15 secs), the bandwidth from which the subharmonic amplitude will be extracted and the initial IAO level i.e., the IAO level from which the data acquisition will begin (range: 0 to 15; 16 possible levels). Once the IAO algorithm is initiated, the scanner automatically extracts the subharmonic data (mean ± standard deviation) for each IAO based on the duration entered by the user, and then repeats this process until data for the maximum IAO (level 15) is obtained. In order to compensate for any shift in the subharmonic amplitude, due to extrinsic factors (e.g., breathing, talking, or shifting during data acquisition), a 3rd order polynomial fit is applied to the data. Then, the IAO eliciting growth stage subharmonics is identified by the algorithm as the maximum subharmonic gradient; computed using equation 1:
| (1) |
Once the optimal IAO is determined, SHAPE data for pressure estimation is initiated. The subharmonic amplitude is processed using a moving average filter and the processed subharmonic amplitude is decimated to 50 points per second for display compatibility. While the technique to identify the optimal IAO was proposed earlier by the authors [25], the current work focusses on the implementation of the technique on a commercially available ultrasound scanner for investigating intra-cardiac pressure changes in real-time.
A. Customized interface for data acquisition
The SHAPE algorithm is accessed via a customized interface (Fig. 2). This interface was configured on a SonixTablet scanner using C/C++ and cross-platform Qt libraries (The Qt Company, Espoo, Finland). This configured interface displays grayscale imaging and computes optimal IAO in real-time.
Fig. 2.
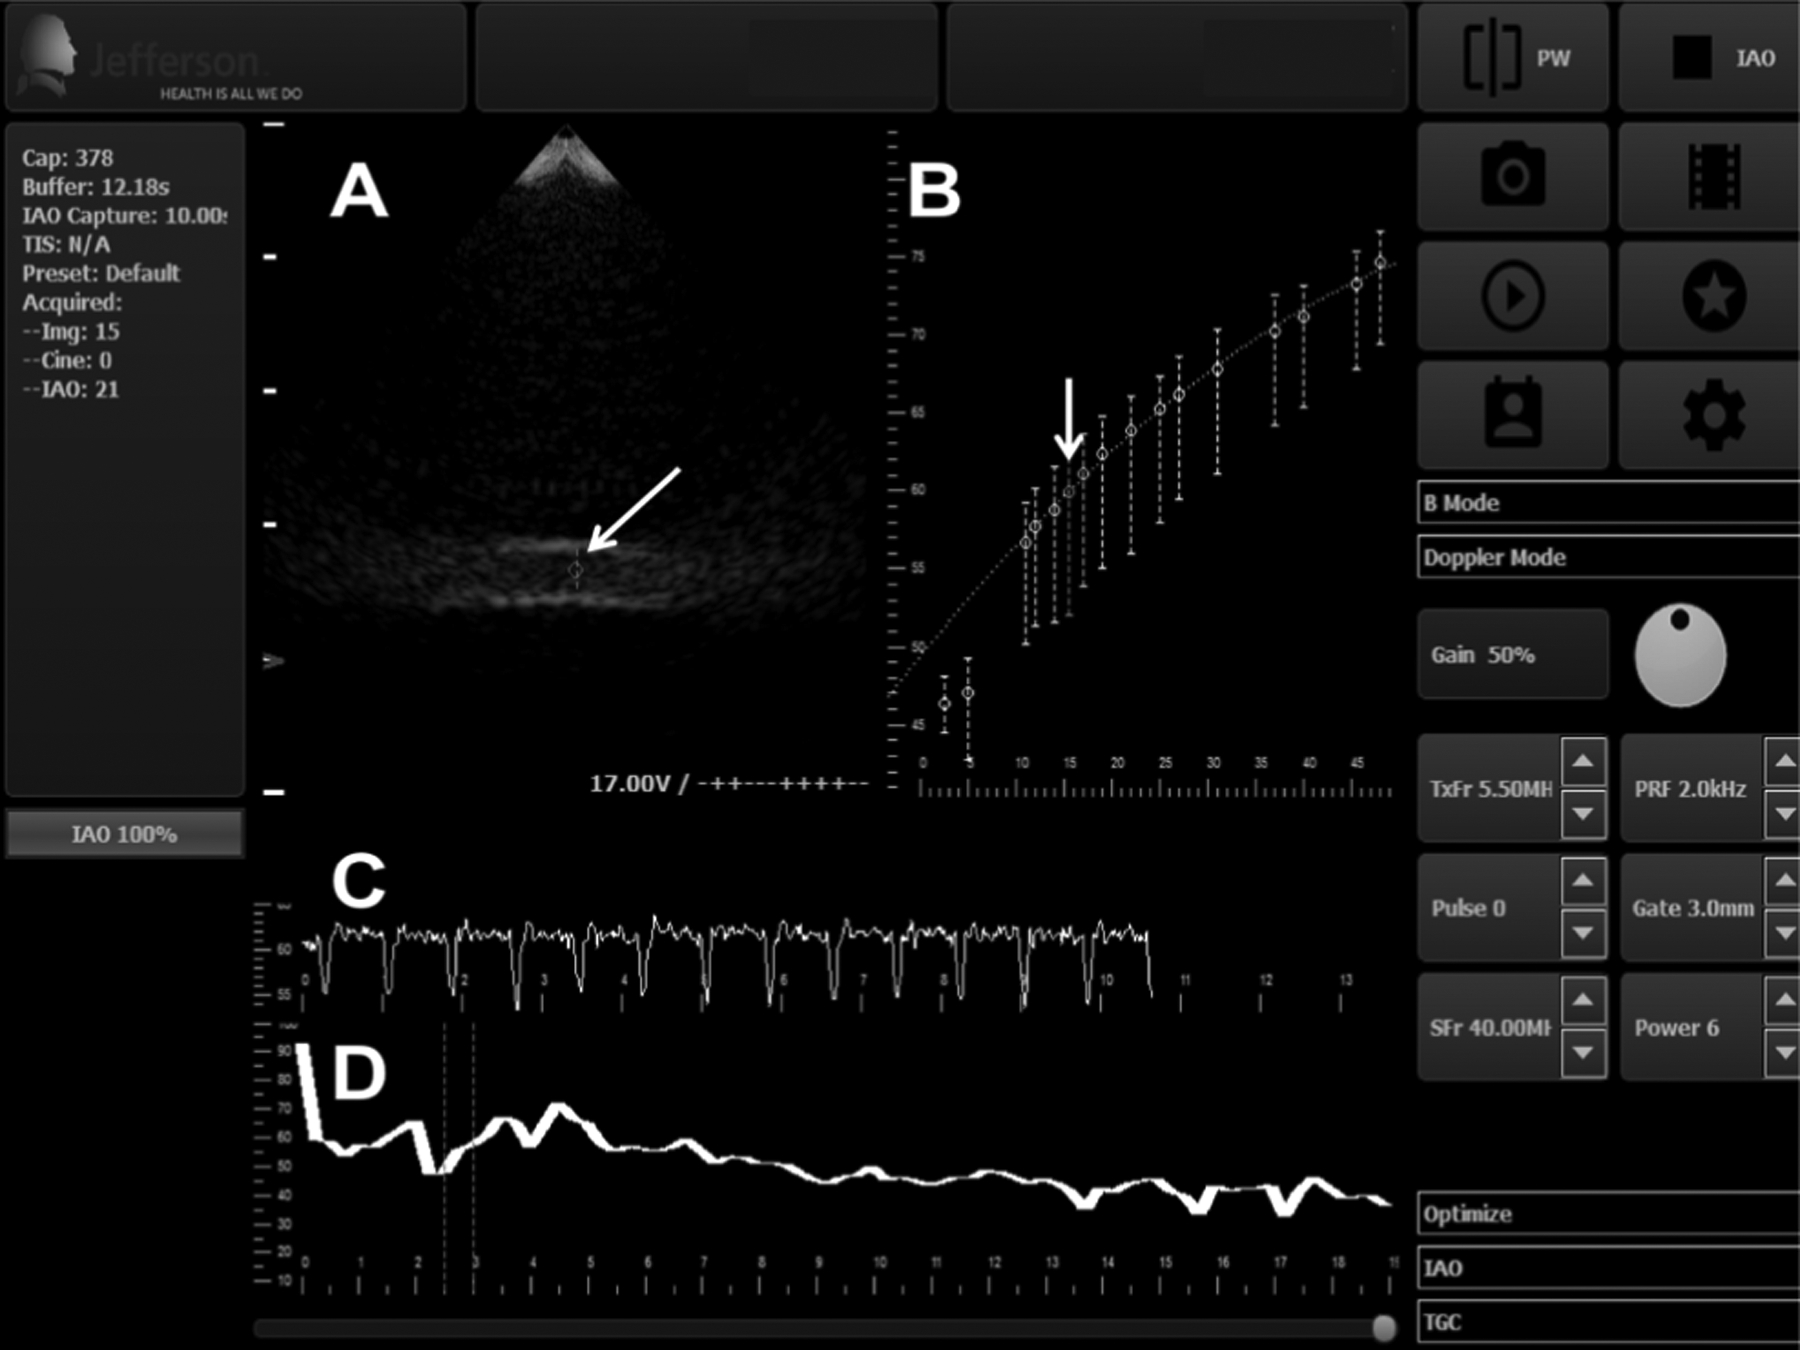
Customized user interface for the SHAPE data acquisition (this screenshot is after the IAO optimization algorithm [Fig. 1] was executed). (A) shows the grayscale image in real-time (arrow: pulsed Doppler gate within the lumen of the flow phantom). (B) shows the mean subharmonic amplitude ± standard deviation as a function of IAO (arrow: optimum IAO; real-time subharmonic amplitude may also be obtained at any other IAO, besides the IAO selected by the algorithm, should this be required). (C) displays the real-time subharmonic amplitude as a function of time at the selected IAO level from (B). (D) displays the average FFT of the received pulses in real-time (dotted lines indicate the bandwidth around the theoretical subharmonic frequency over which the subharmonic amplitude is averaged).
During the determination of optimal IAO, the display on Fig. 2 (panel B) is updated after data acquisition at each IAO level. The platform processes the subharmonic signals, creates a plot of the optimization curve (panel B), selects the optimal IAO level (based on equation 1), and displays the subharmonic amplitude in real-time.
The validity of data obtained using the customized interface and optimization of other transmit parameters was performed in vitro.
B. In Vitro Experimental Setup
The acoustic pressure levels from the ultrasound transducers (SA4–2/PA7–4, B K Ultrasound) were measured using a 0.5 mm calibrated needle hydrophone (Precision Acoustics, Dorchester, UK) in a static water tank setup. A closed-loop flow system (Fig. 3) consisting of an acrylic cylindrical chamber, roller pump (Sarns, S10K II, Ann Arbor, MI) a Doppler flow phantom (CIRS, Norfolk, VA, USA), and flexible PVC tubes was utilized for this study (similar to the setup used in previous studies [23]–[24]). Briefly, 750 mL of isotonic diluent was circulated through the lumen of the Doppler flow phantom (3 mm diameter). Two different commercial UCAs were selected for this study. Sonazoid (GE Healthcare, Oslo, Norway) was selected because a previous study by our group established that Sonazoid was the UCA most sensitive to changes in hydrostatic pressure out of the 5 UCAs examined [23]. Among the FDA approved UCAs studied, Definity (Lantheus Medical Imaging Inc, N Billerica, MA, USA) was the most sensitive to changes in hydrostatic pressure [23]. Both UCAs were activated as per the manufacturers’ recommendations. For Definity, the vials were warmed to room temperature and mixed using VIALMIX (Lantheus Medical Imaging Inc) for 45 seconds. For Sonazoid, the vials were injected with 2 mL of sterile water, provided by GE Healthcare, and shaken for 60 seconds. The activated UCA was mixed with 750 mL isotonic diluent. A magnetic stirrer was used to ensure uniform mixing.
Fig. 3.
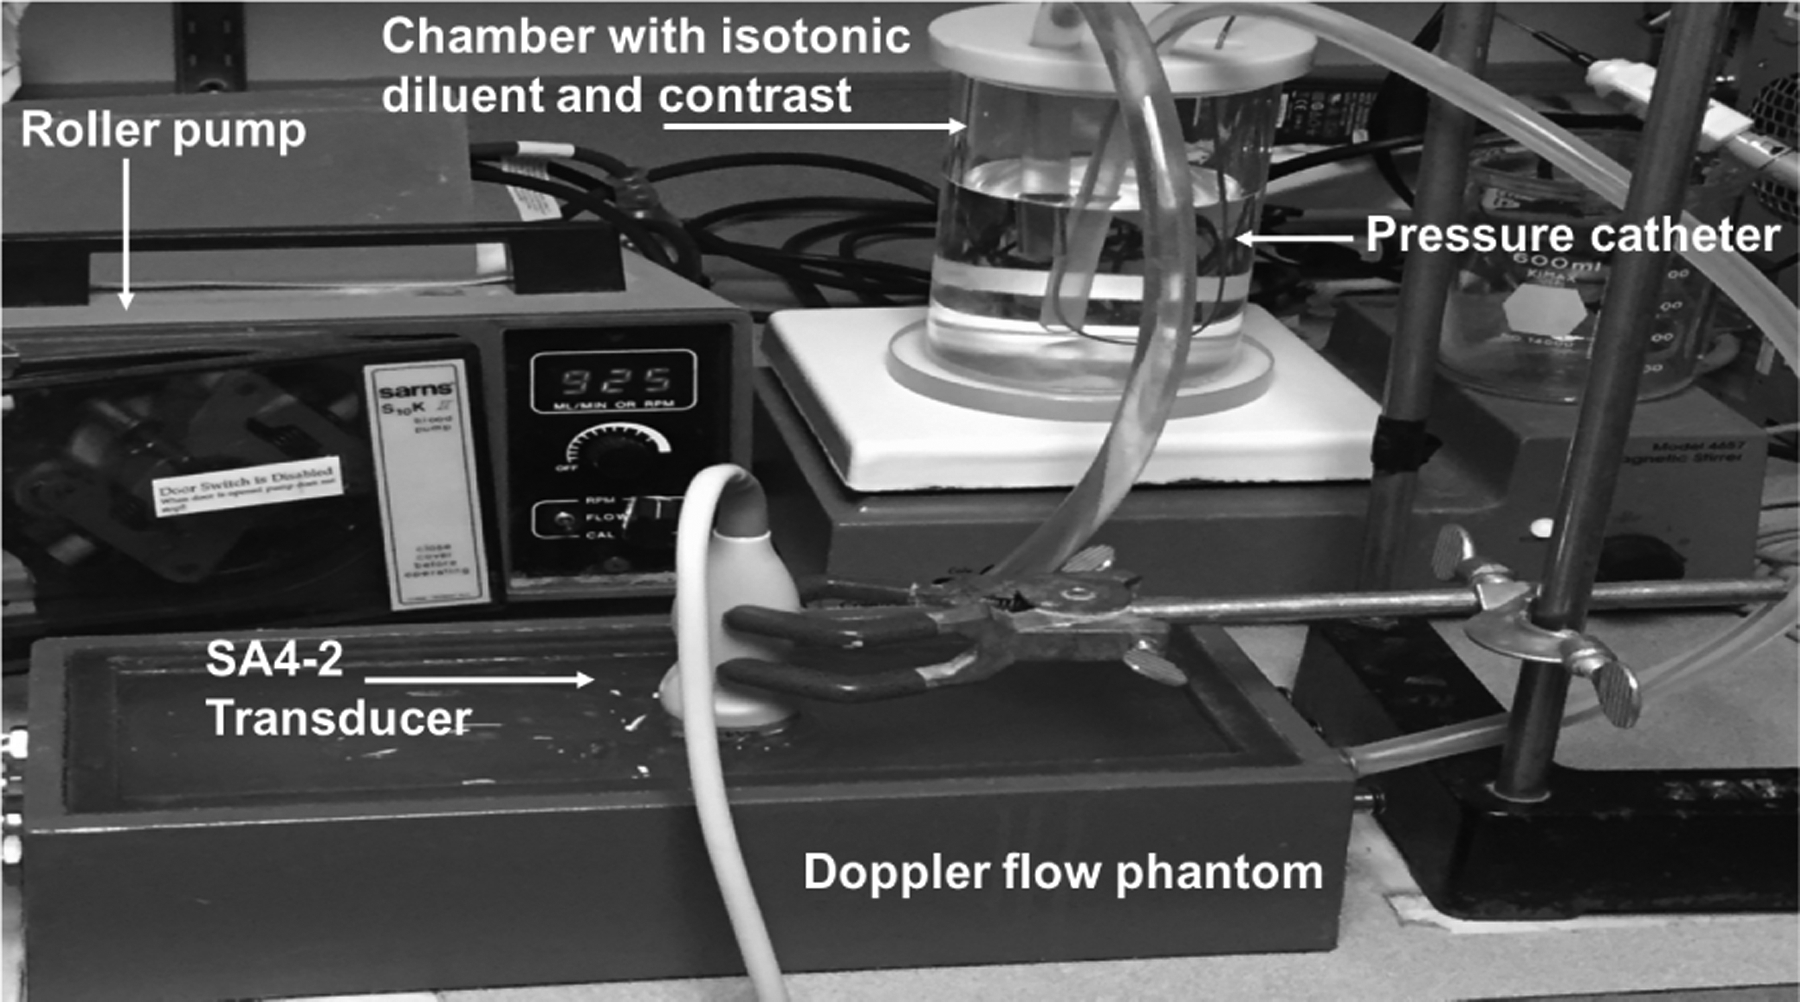
The closed-loop flow system utilized for data acquisition.
In order to acquire simultaneous ambient pressure measurements, a calibrated Mikro-tip pressure catheter (SPR-350S Millar Inc., Houston, TX, USA) was inserted into the lumen of the vessel in the Doppler flow phantom and the pressure catheter signals were observed on a digital oscilloscope (9350AM; Teledyne LeCroy, Chestnut Ridge, NY, USA). The catheter pressure signals were extracted from the oscilloscope using LabVIEW (National Instruments, Austin, TX, USA). This provided the reference pressure values from the phantom.
For SHAPE data acquisition, a pulsed Doppler gate was placed within the lumen of the vessel and the SHAPE algorithm was initiated. Data acquisition parameters were set to acquire data for 10 seconds at each IAO and to extract the subharmonic signal in a 0.5 MHz bandwidth around the subharmonic frequency. This bandwidth was selected based on our prior study [24]. In order to determine optimal transmit parameters, 4 transmit frequencies were investigated– 2.5, 3.0, 3.5 and 4.0 MHz. These transmit frequencies were selected based on the 2–4 MHz bandwidth of the phased array probe (SA4–2) utilized for adult cardiac ultrasound imaging [9]. In addition to the transmit frequencies, 2 pulse shaping options were selected – square wave (1.63 μs duration) and chirp down wave (2.07 μs duration; 4.5 MHz bandwidth) – based on a previous study that examined the effect of pulse shaping on SHAPE [26]. The concentration of Definity (15 to 22.5 μL microspheres; corresponding to 0.1 to 0.15 mL) and Sonazoid microbubbles (0.4 to 1.2 μL microspheres; corresponding to 0.05 to 0.15 mL) were also varied during the experiments.
Simultaneous RF and ambient pressure data were obtained (for all IAO levels) for all the combinations of UCAs (Definity and Sonazoid at the different concentrations), transmit frequencies and pulse shaping options over a 16-month period. For each iteration, data acquisition was acquired in triplicate.
C. Data and Statistical Analysis
In order to determine the validity of the data processing implemented on the customized interface, we compared the real-time processing output (displayed on the ultrasound scanner screen – c.f., Fig. 2C; performed in C/C++) with post processing output (following the steps shown in the flowchart c.f., Fig. 1). Post-processing was done in MATLAB (The Mathworks Natick, MA, USA). For this validation, a subset of data was used – 3 IAO levels ranging from low to high were selected (low: 2, medium: 5, and high: 12). Correlation coefficients were computed between the real-time processing output and the post-processing output for validation.
For determining the optimal parameters for SHAPE, a factorial analysis of variances (ANOVAs) was performed - the objective was to examine the impact of transmit frequency, pulse shape and UCA concentration on the correlation between SHAPE and pressure catheter data. Alpha-value was set at 0.05 a priori and an ANOVA with post-hoc Bonferroni corrections for multiple comparisons were used to identify significant differences. All statistical analyses were performed with SPSS (version: 24, IBM, Armonk, NY, USA).
III. Results
A. Verifying Real-Time Functionality
For validation of real-time processing, a subset of data was used – 3 IAO levels ranging from low to high were selected (low: 2, medium: 5, and high: 12). Correlation coefficient was computed between the real-time processing output and the post-processing output for validation. Results are depicted in Fig. 4. When the C++ and MATLAB data were superimposed on the same plot, the relationship between the data is clear and confirmed by the linear correlation coefficient values (r ≥ 0.75).
Fig. 4.
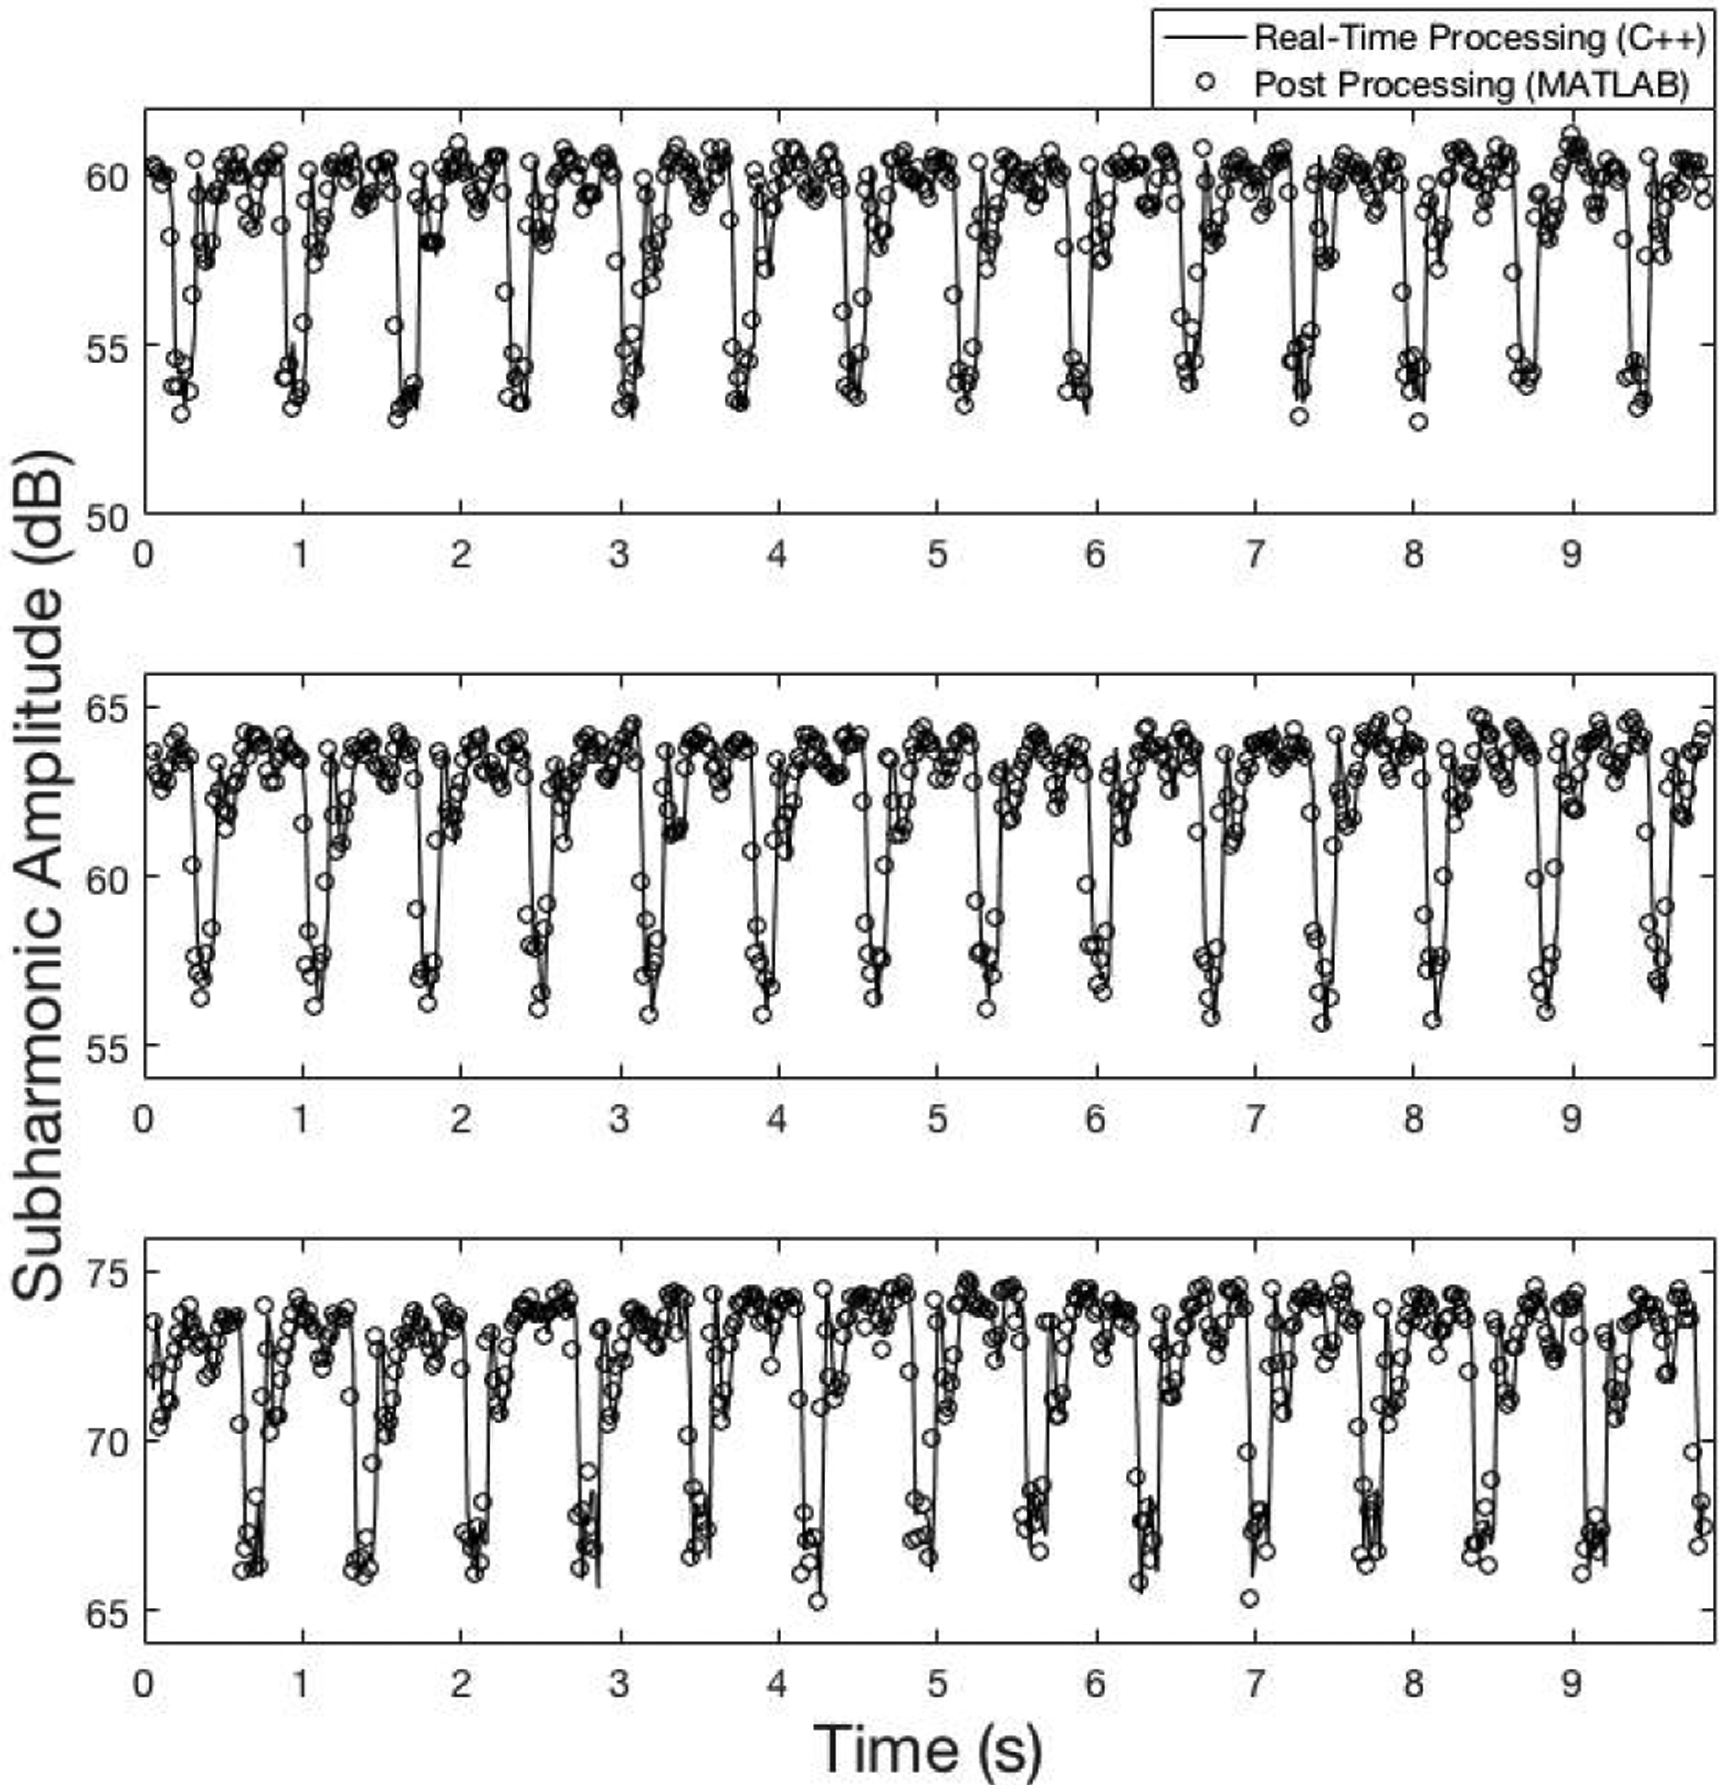
Real-time processing (−) and post processing (o) of radiofrequency data to verify real-time functionality at 3 IAO levels (IAO: 2 (301 kPapeak–to–peak), r=0.80; IAO: 5 (430 kPapeak–to–peak), r=0.82; and IAO: 12 (992 kPapeak–to–peak), r=0.75).
B. Optimal parameters for Definity microbubbles
The linear correlation coefficient values to determine the optimal parameters for intra-cardiac SHAPE using Definity are shown in Fig. 5. The linear correlation coefficient values are negative indicating the inverse relationship between subharmonic signal amplitude and ambient pressure values (also, reported in previous studies [9]–[11], [23])An ANOVA revealed that there was a significant main effect of transmit frequency on the correlation between SHAPE and pressure catheter data (p = 0.015). A post-hoc test with Bonferroni corrections revealed that the main effect of transmit frequency at 3.0 MHz was significantly larger (p = 0.013) than at 3.5 MHz.
Fig. 5.
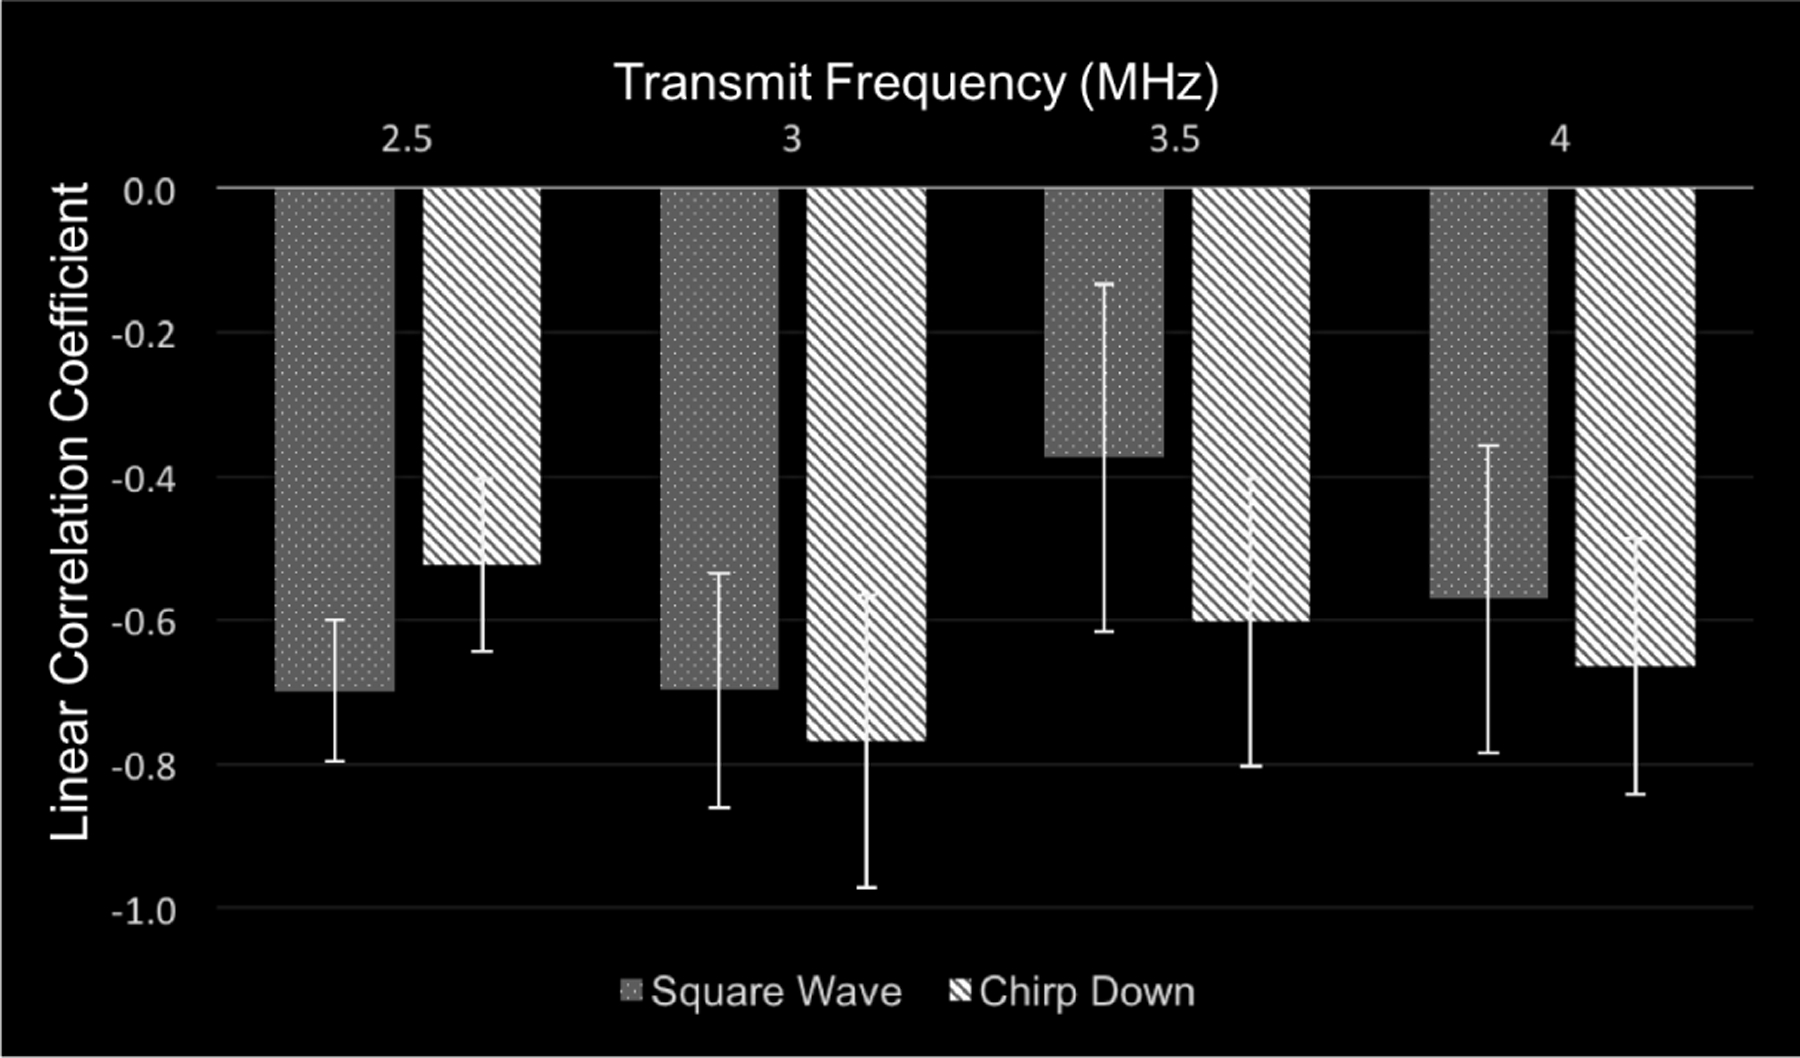
The average linear correlation coefficient values using Definity for the square wave and chirp down pulse while varying the transmit frequency from 2.5 to 4.0 MHz.
The linear correlation coefficient values at 2.5 and 4 MHz were not significantly different than at 3.0 MHz (p ≥ 0.065). At 3.0 MHz, the linear correlation coefficient for the chirp down pulse (r = −0.77 ± 0.2) was not significantly greater (p = 0.5) than the linear correlation coefficient for the square wave pulse (r = −0.70 ± 0.2). Based on these results, a combination of 3.0 MHz transmit frequency and a chirp down pulse revealed the highest correlation coefficient values between the subharmonic and the ambient pressure data. Additionally, with these parameters, the importance of acquiring data at the optimal IAO is depicted in Fig. 6 relative to data acquired at IAO levels below and above the optimal IAO.
Fig. 6.
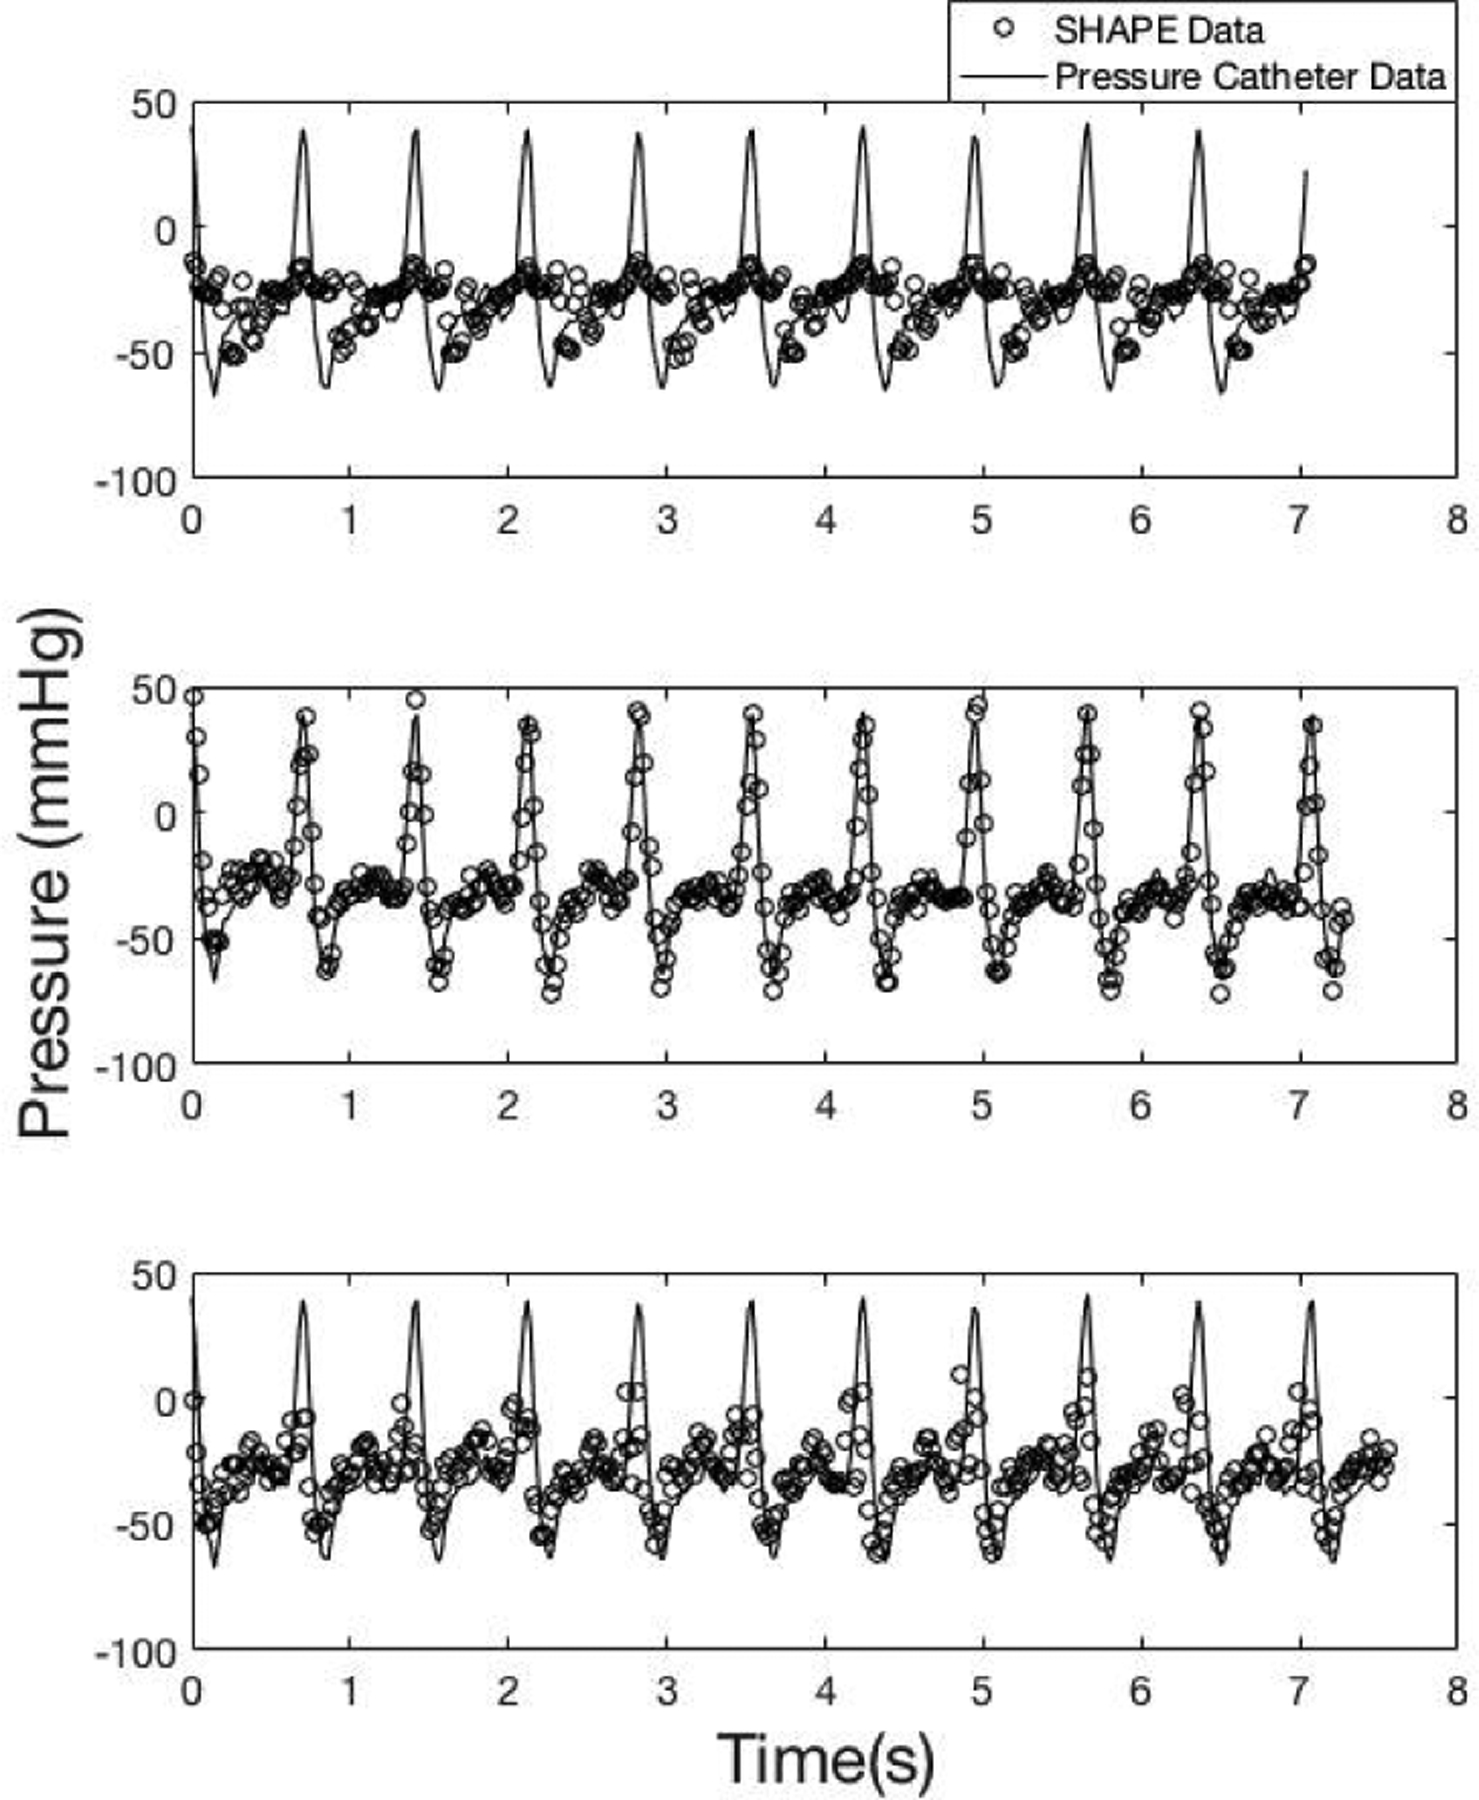
An example of data acquired using Definity at 3.0 MHz transmit frequency and a chirp down pulse. Data acquired below (31 kPapeak–to–peak;top panel, r= −0.4), at (77 kPapeak–to–peak;middle panel, r= −0.9) and above (256 kPapeak–to–peak ;bottom panel, r= −0.5) the optimal IAO (o markers: SHAPE data; solid line: pressure catheter data).
C. Optimal parameters for Sonazoid microbubbles
The average linear correlation coefficient values while varying frequency and pulse type using Sonazoid are shown in Fig. 7.
Fig. 7.
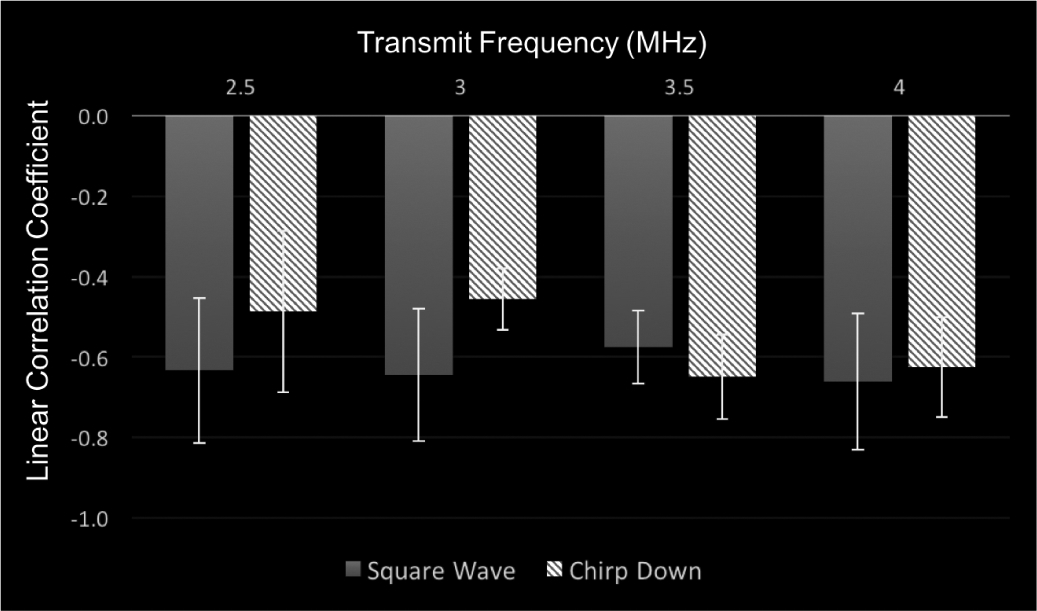
The average linear correlation coefficient values using Sonazoid for the square wave and chirp down pulse while varying the transmit frequency from 2.5 to 4.0 MHz.
There was a significant main effect of pulse type on the correlation between SHAPE and catheter data (p = 0.033). Because the mean linear correlation coefficient values, using the square wave pulse, were so similar (r = −0.63 and −0.64, at 2.5 MHz and 3.0 MHz, respectively), the analysis was split by concentration. This revealed that the highest correlation coefficient values were obtained at 2.5 MHz transmit frequency (r = −0.72 ± 0.2). Therefore, the optimal parameters for Sonazoid were found to be a square wave pulse at a transmit frequency of 2.5 MHz. Once again, an example of SHAPE and pressure catheter data acquired, using the optimal parameters, below, at, and above the optimal IAO is shown in Fig 8. This highlights the necessity of acquiring data at the optimal IAO.
Fig. 8.
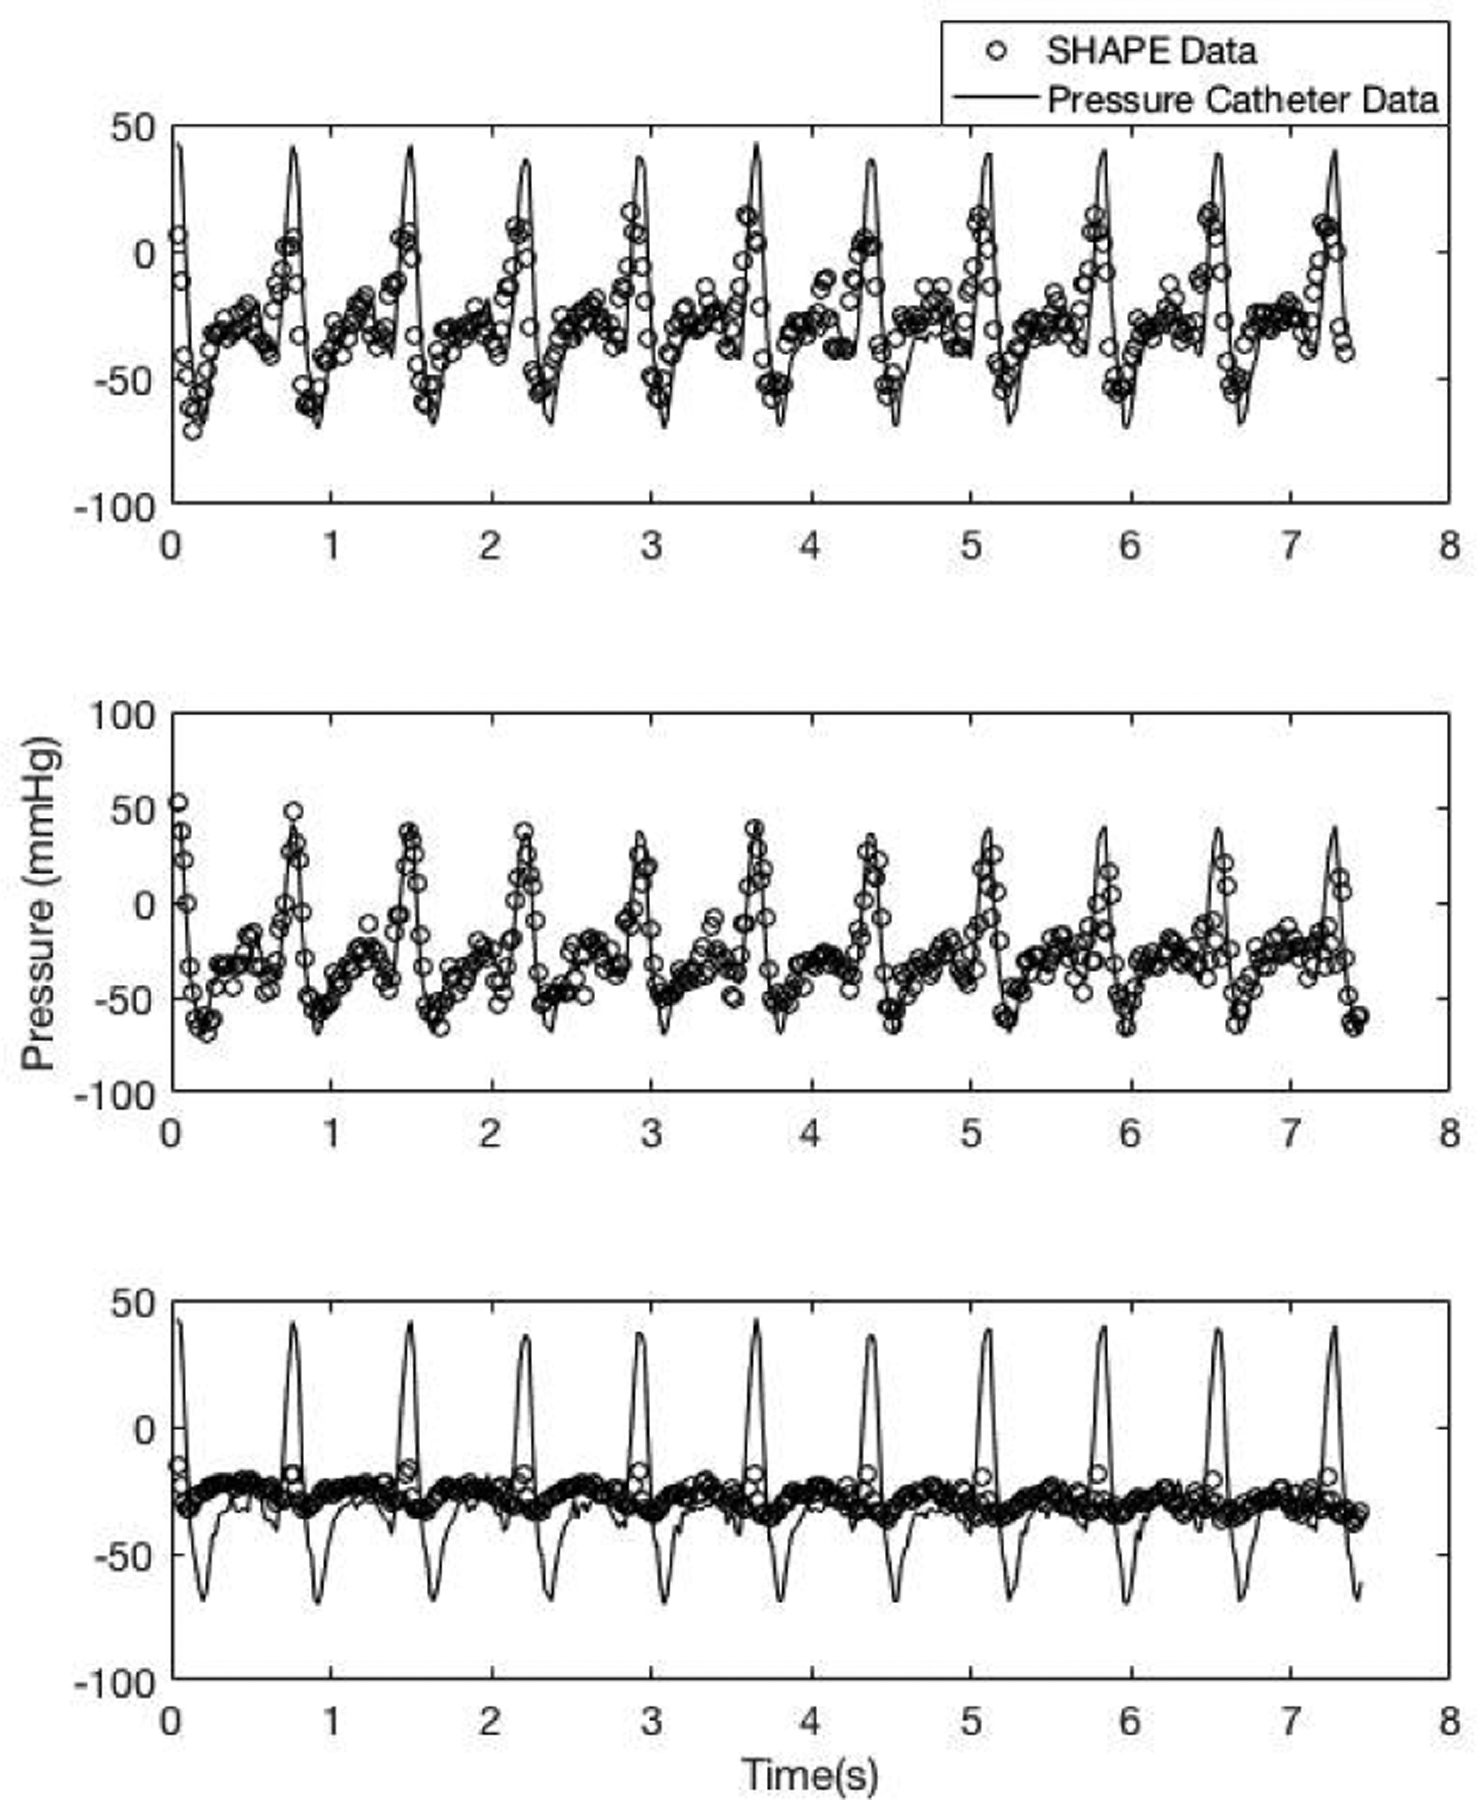
An example of data acquired using Sonazoid at 2.5 MHz transmit frequency and a square wave pulse. Data acquired below (1.3 MPapeak–to–peak;top panel, r= −0.7), at (1.4 MPapeak–to–peak ;middle panel, r= −0.8) and above (1.6 MPapeak–to–peak ;bottom panel, r= −0.2) the optimal IAO (o markers: SHAPE data; solid line: pressure catheter data).
IV. Discussion
In this study, a customized interface for intra-cardiac SHAPE has been developed and validated, and the optimal parameters for intra-cardiac SHAPE using Definity and Sonazoid was examined in vitro. The customized interface reduces time needed for data acquisition due to the real-time processing implemented on the SonixTablet scanner. This study addresses a critical limitation encountered in previous studies [9] – [11], in which data was not necessarily acquired at the optimum IAO. Specifically, in the pilot study [9] this was due to concerns that a large increase in data acquisition time for SHAPE will affect patient care. Based on this study, implementing the IAO algorithm with 10 seconds of data acquisition at each of the 16 possible IAOs and determining the optimal IAO in real-time now requires 160 seconds.
Previously, data had to be acquired at each IAO and then processed offline to determine optimum IAO. Further, the real-time subharmonic amplitude variations (cf. Fig. 2 panel C) mimic the pressure variations in the flow phantom (cf. solid line in Figs. 6 and 8). Thus, this will allow for visual confirmation during SHAPE data acquisition of the comparison of the subharmonic signal variation as the pressure varies.
Finally, the need to operate at the optimal IAO is re-iterated in Figs. 6 and 8, where subharmonic data acquired at other IAO levels does not correlate as well with the pressure catheter data. The successful determination of real-time optimum IAO will help in translating SHAPE from a research technique to a clinical realization.
Also, in this study, the optimal parameters for intra-cardiac SHAPE using Definity and Sonaziod were established. These results indicate that Definity had a higher correlation coefficient (−0.77 ± 0.2) than Sonazoid (−0.72 ± 0.2) while comparing subharmonic amplitude to data acquired from the pressure catheter - this is unlike previous results that showed Sonazoid was the most sensitive to changes in hydrostatic pressure [23]. This result could be due to the differences in optimal parameters for Definity and Sonazoid [23], [25].
Two pulse shapes (chirp down and square wave) were examined to find the optimal parameter for intra-cardiac SHAPE for both Definity and Sonazoid. The square wave pulse at frequency 2.5 MHz had relatively higher linear correlation coefficient values for real-time intra-cardiac SHAPE using Sonazoid microbubbles. In a different study, Gupta et al. concluded that the Gaussian windowed binomial filtered square wave was optimal for SHAPE [26]. Other studies indicate a chirp down pulse exudes a higher subharmonic signal [26]–[28]. The differences in the current study are most likely due to a combination of the differences in UCA used (Sonazoid versus Definity) and the ultrasound scanner used for data acquisition (SonixTablet).
A limitation of this study is that data was acquired at room temperature. The in vivo SHAPE data will be acquired at body temperature. Since shell properties of these microbubbles are sensitive to temperature, the subharmonic generation thresholds are expected to differ in vivo. Additionally, it should be noted that due to the limited bandwidth of the transducer the realization of an ideal square wave pulse is constrained.
V. Conclusion
In conclusion, an interface was developed and validated for real-time intra-cardiac SHAPE. The optimal parameters for utilizing Definity (chirp down pulse with transmit frequency of 3.0 MHz) and Sonazoid (square wave pulse with transmit frequency of 2.5 MHz) microbubbles for noninvasive real-time intra-cardiac pressure estimation using the SHAPE technique have been determined. This interface and optimal parameters will be used to acquire data in patients for real-time noninvasive intra-cardiac SHAPE.
Acknowledgments
This work was supported in part by the American Heart Association (15SDG25740015) and the National Institutes of Health (R21 HL130899). Definity and Sonazoid were supplied by Lantheus Medical Imaging and GE Healthcare respectively.
Biographies

Cara Esposito was born in New York, NY on September 23, 1993. She graduated in 2015 with her B.S. in physics from Saint Joseph’s University in Philadelphia, Pennsylvania. During her bachelors, she participated in a summer research program at Saint Joseph’s University and a research experience for undergraduates at Triangle Universities Nuclear Laboratory in Durham North Carolina, was a teaching assistant for General Physics Lab I and II, and was a research intern at the Nicholas Institute of Sports Medicine and Athletic Trauma (NISMAT) in New York, NY.
She went on to do her masters in biomedical engineering from Drexel University, where she was awarded the Dean’s Fellowship. In 2020 she completed her Ph.D. in the School of Biomedical Engineering, Science and Health Systems at Drexel University with her research project under Dr. Jaydev Dave’s supervision at Thomas Jefferson University. She is currently a post-doctoral fellow at Thomas Jefferson University in Philadelphia, Pennsylvania. Cara is a member of the American Institute of Ultrasound Medicine and IEEE.

Kris Dickie started his involvement in the ultrasound field when he joined Ultrasonix Medical corporation in 2000 as a software engineer. He quickly became acquainted with ultrasound technology and the field of medical research. He has vast experience in managing research and business, with several academic/university collaborations. Kris holds a B.Tech. degree in computer systems from the British Columbia Institute of Technology, Burnaby, Canada. He has been working in the ultrasound industry for 20 years now and has helped develop multiple ultrasound devices including various research tools. He current position title is VP Research & Development at Clarius Mobile Health.

Flemming Forsberg was born in Copenhagen, Denmark on October 20, 1961. He received an M.Sc. in Electronic Engineering and a Ph.D. in Biomedical Engineering from the Technical University of Denmark, Lyngby, Denmark in 1987 and 1990, respectively.
From 1987 to 1990 he worked on Doppler ultrasound signal processing at the Electronics Institute, Technical University of Denmark before becoming a post-doctoral research fellow at King’s College, London, England (1990–91). After a year in private industry, developing an intravascular imaging system, he went to the department of Radiology, Thomas Jefferson University, Philadelphia, USA in 1992 as an Ultrasound Physicist. Dr. Forsberg is currently a Professor of Radiology and his research focuses on ultrasound contrast agents, subharmonic imaging, quantitative contrast measurements and novel clinical imaging modes.
Dr. Forsberg is a senior member of the Institute of Electrical and Electronic Engineers (IEEE) and a fellow of the American Institute of Ultrasound in Medicine (AIUM) as well as the American Institute for Medical and Biological Engineering (AIMBE). He is a member of the Editorial Board of “Ultrasonic Imaging” as well as a Deputy Editor for Basic Science of the “Journal of Ultrasound in Medicine.” In 2015 he received the Joseph H. Homes Pioneer Award in basic science from the AIUM and in 2018 he presented the New Horizons lecture at the Annual Meeting of the Radiological Society of North America.

Jaydev Dave was born in Mumbai, India, in 1984. He earned his B.E. degree in Biomedical Engineering from Mumbai University, India, in 2006, and his M.Sc. and PhD degrees in Biomedical Engineering from Drexel University, Philadelphia, PA, in 2008 and 2012, respectively. He is currently an Associate Professor of Radiology at the Thomas Jefferson University in Philadelphia, PA. Jaydev is actively involved in ultrasound research with focus of applications of contrast agents, signal and image processing algorithms, and in applied physics research with focus on the interplay between radiation dose and image quality.
He is currently a member of the IEEE and IEEE Ultrasonics, Ferroelectrics, and Frequency Control Society, the American Institute of Ultrasound in Medicine, the International Contrast Ultrasound Society, the American Association of Physicists in Medicine, the American College of Radiology, the Society of Photo-Optical Instrumentation Engineers and the American Heart Association. He enjoys research, clinical service, and teaching. In 2020, he received the “Young Alumni - Emerging Leader Award” from Drexel University, Philadelphia, PA.
Contributor Information
C. Esposito, Department of Radiology at Thomas Jefferson University, Philadelphia, PA 19107, USA and the School of Biomedical Engineering, Science and Health Systems at Drexel University, Philadelphia, PA 19104, USA.
K. Dickie, Clarius Mobile Health, Burnaby, BC, Canada
References
- [1].Benjamin EJ, Blaha MJ, Chiuve SE, Cushman M, Das SR, Deo R, de Ferranti SD, Floyd J, Fornage M, Gillespie C, Isasi CR, Jiménez MC, Jordan LC, Judd SE, Lackland D, Lichtman JH, Lisabeth L, Liu S, Longenecker CT, Mackey RH, Matsushita K, Mozaffarian D, Mussolino ME, Nasir K, Neumar RW, Palaniappan L, Pandey DK, Thiagarajan RR, Reeves MJ, Ritchey M, Rodriguez CJ, Roth GA, Rosamond WD, Sasson C, Towfighi A, Tsao CW, Turner MB, Virani SS, Voeks JH, Willey JZ, Wilkins JT, Wu JHY, Alger HM, Wong SS, and Muntner P, “Heart Disease and Stroke Statistics—2018 Update: A Report From the American Heart Association,” Circ J, 2018. [DOI] [PMC free article] [PubMed] [Google Scholar]
- [2].Fairbank WM and Scully MO, “A New Noninvasive Technique for Cardiac Pressure Measurement: Resonant Scattering of Ultrasound from Bubbles,” IEEE IEEE Trans. Bio-Med. Eng *, vol. BME-24, no. 2, 107–110, 1977. [DOI] [PubMed] [Google Scholar]
- [3].Hök B, “A new approach to noninvasive manometry: interaction between ultrasound and bubbles,” Med Biol Eng Comput, vol. 19, no. 1, 35–39, 1981. [DOI] [PubMed] [Google Scholar]
- [4].Miwa H, “Pressure measuring system with ultrasonic wave,” Patent 4483345 United States of America 1984, Filed: August 4, 1982. [Google Scholar]
- [5].Shankar PM, Chapelon JY, and Newhouse VL, “Fluid pressure measurement using bubbles insonified by two frequencies,” Ultrasonics, vol. 24, no. 6, 333–336, 1986. [Google Scholar]
- [6].Bouakaz A, Frinking PJA, de Jong N, and Bom N, “Noninvasive measurement of the hydrostatic pressure in a fluid-filled cavity based on the disappearance time of micrometer-sized free gas bubbles,” Ultrasound Med Biol, vol. 25, no. 9, 1407–1415, 1999. [DOI] [PubMed] [Google Scholar]
- [7].Pickering TG, Hall JE, Appel LJ, Falkner BE, Graves J, Hill MN, Jones DW, Kurtz T, Sheps SG, Roccella EJ, and Subcommittee of Professional and Public Education of the American Heart Association Council on High Blood Pressure, “Recommendations for Blood Pressure Measurement in Humans and Experimental Animals: Part 1: Blood Pressure Measurement in Humans: A Statement for Professionals From the Subcommittee of Professional and Public Education of the American Heart Association Council on High Blood Pressure Research,” Hypertension, vol. 45, no. 1, 142–161, 2005. [DOI] [PubMed] [Google Scholar]
- [8].Shi W, Forsberg F, Raichlen J, Needleman L, and Goldberg B, “Pressure dependence of subharmonic signals from contrast microbubbles,” Ultrasound Med Biol, vol. 25, no. 2, 275–283, 1999. [DOI] [PubMed] [Google Scholar]
- [9].Dave JK, Kulkarni S, Pangaonkar P, Stanczak M, McDonald M, Cohen I, Mehrotra P, Savage M, Wallinsky P, Ruggiero II N, Fischman D, Ogilby D, VanWhy C, Lombardi M, and Forsberg F„ “Noninvasive Intracardiac Pressure Measurements Using Subharmonic Aided Pressure Estimation: Proof Of Concept In Humans,” Ultrasound Med Biol, vol. 43, no. 11, 2718–2724, 2017. [DOI] [PMC free article] [PubMed] [Google Scholar]
- [10].Dave JK, Halldorsdottir VG, Eisenbrey JR, Raichlen JS, Liu J-B, McDonald M, Dickie K, Wang S, Leung C, and Foresberg F, “Noninvasive LV Pressure Estimation Using Subharmonic Emissions From Microbubbles,” JACC Cardiovasc. Imaging, vol. 5, no. 1, 87–92, 2012. [DOI] [PMC free article] [PubMed] [Google Scholar]
- [11].Dave JK, Halldorsdottir VG, Eisenbrey JR, Raichlen JS, Liu J-B, McDonald M, Dickie K, Wang S, Leung C, and Foresberg F, “Subharmonic microbubble emissions for noninvasively tracking right ventricular pressures,” Am J Physiol-Heart C, vol. 302, no. 13, H126–H132, 2012. [DOI] [PMC free article] [PubMed] [Google Scholar]
- [12].Dastgheyb S and Eisenbrey J, “Microbubble Applications in Biomedicine,” ed: William Andrew, Incorporated, 2014, pp. 253–277. [Google Scholar]
- [13].Lyshchik A, Specialty Imaging: Fundamentals of CEUS, 1st ed. Elsevier, pp. 8–12, 112, 2019. [Google Scholar]
- [14].Goldberg B, Raichlen J, and Forsberg F, Ultrasound contrast agents:Basic principles and clinical applications. United Kingdom: Martin Dunitz, 2001, pp. 34–35. [Google Scholar]
- [15].Eller A and Flynn HG, “Generation of Subharmonics of Order One-Half by Bubbles in a Sound Field,” JASA, vol. 46, no. 3B, pp. 722–727, 1969. [Google Scholar]
- [16].Frinking PJA, Gaud E, Brochot J, and Arditi M, “Subharmonic scattering of phospholipid-shell microbubbles at low acoustic pressure amplitudes,” IEEE T ULTRASON FERR, vol. 57, no. 8, pp. 1762–1771, 2010. [DOI] [PubMed] [Google Scholar]
- [17].Marmottant PGM et al. , “A model for large amplitude oscillations of coated bubbles accounting for buckling and rupture,” JASA, vol. 118, no. 6, pp. 3499–3505, 2005. [Google Scholar]
- [18].Marmottant P, Bouakaz A, Jong N. d., and Quilliet C, “Buckling resistance of solid shell bubbles under ultrasound,” JASA, vol. 129, no. 3, pp. 1231–1239, 2011. [DOI] [PubMed] [Google Scholar]
- [19].Nio AQX et al. , “Optimal Control of SonoVue Microbubbles to Estimate Hydrostatic Pressure,” IEEE T ULTRASON FERR, vol. 67, no. 3, pp. 557–567, 2020. [DOI] [PMC free article] [PubMed] [Google Scholar]
- [20].Dave JK, Halldorsdottir VG, Eisenbrey JR, and Forsberg F, “Processing of Subharmonic Signals from Ultrasound Contrast Agents to Determine Ambient Pressures,” Ultrason. Imaging, vol. 34, no. 2, 81–92, 2012. [DOI] [PubMed] [Google Scholar]
- [21].Eisenbrey JR, Dave JK, Halldorsdottir VG, Merton DA, Miller C, Gonzalez JM, Machado P, Park S, Dianis S, Chalek CL, Kim CE, Baliff JP, Thomenius KE, Brown DB, Navarro V, and Forsberg F “Chronic liver disease: noninvasive subharmonic aided pressure estimation of hepatic venous pressure gradient,” Radiology. vol. 268, 581–588, 2013. [DOI] [PMC free article] [PubMed] [Google Scholar]
- [22].Halldorsdottir VG, Dave JK, Marshall A, Forsberg AI, Fox TB, Eisenbrey JR, Machado P, Liu J-B, Merton DA, and Forsberg F. “Subharmonic-Aided Pressure Estimation for Monitoring Interstitial Fluid Pressure in Tumors: Calibration and Treatment with Paclitaxel in Breast Cancer Xenografts,” Ultrasound Med Biol. vol. 43, no.3, 1401–1410, 2017. [DOI] [PMC free article] [PubMed] [Google Scholar]
- [23].Halldorsdottir VG, Dave JK, Leodore LM, Eisenbrey JR, Park S, Hall AL, Thomenius K, and Forsberg F., “Subharmonic Contrast Microbubble Signals for Noninvasive Pressure Estimation under Static and Dynamic Flow Conditions,” Ultrason. Imaging, vol. 33, no. 3, 153–164, 2011. [DOI] [PMC free article] [PubMed] [Google Scholar]
- [24].Dave JK, Halldorsdottir VG, Eisenbrey JR, Liu JB, McDonald ME, Dickie K, Leung C, and Forsberg F, “Noninvasive estimation of dynamic pressures in vitro and in vivo using the subharmonic response from microbubbles,” IEEE Transactions on IEEE Trans. Ultrason., Ferroelectr., Freq. Control, vol. 58, no. 10, 2056–2066, 2011. [DOI] [PubMed] [Google Scholar]
- [25].Dave JK, Halldorsdottir VG, Eisenbrey JR, Merton DA, Liu JB, Machado P, Zhao H, Park S, Dianis S, Chalek CL, Thomenius KE, Brown DB and Forsberg F, “On the implementation of an automated acoustic output optimization algorithm for subharmonic aided pressure estimation.” Ultrasonics, vol. 53, no. 4, 880–888, 2013. [DOI] [PMC free article] [PubMed] [Google Scholar]
- [26].Gupta I, Eisenbrey J, Stanczak M, Sridharan A, Dave JK, Liu J-B, Hazard C, Wang X, Wang P, Li H, Wallace K, and Forsberg F., “Effect of Pulse Shaping on Subharmonic Aided Pressure Estimation In Vitro and In Vivo,” J. Ultrasound Med, vol. 36, no. 1, 3–11, 2017. [DOI] [PMC free article] [PubMed] [Google Scholar]
- [27].Zhang D, Gong Y, Gong X, Liu Z, Tan K, and Zheng H, “Enhancement of subharmonic emission from encapsulated microbubbles by using a chirp excitation technique,” Phys. Med. Biol, vol. 52, no. 18, 5531–5544, 2007. [DOI] [PubMed] [Google Scholar]
- [28].Shekhar H and Doyley MM, “Improving the sensitivity of high-frequency subharmonic imaging with coded excitation: A feasibility study,” Med Phys, vol. 39, no. 4, 2049–2060, 2012. [DOI] [PMC free article] [PubMed] [Google Scholar]