Background: Stress during the coronavirus disease 2019 (COVID-19) pandemic may increase substance use.
Objective: To assess national household retail sales of alcohol and tobacco.
Methods and Findings: Nielsen National Consumer Panel is a longitudinal household cohort that collects retail and e-commerce purchase data. The sample uses stratified random probability sampling (1) based on head of household. Noncontiguous states (Alaska and Hawaii) and persons in resident hotels, homes for the elderly, and prisons are excluded. Online recruitment is supplemented by door-to-door recruitment for minority populations that may have limited internet access. Accuracy aligns with government-commissioned national data sets with independent data validation.
Retail purchases of alcohol (wine; liquor; and beer, malt beverages, and cider) and tobacco (cigarettes, smokeless tobacco, e-cigarettes, and cigars) in U.S. dollars were captured by household, aggregated by demographic and geographic category. Nielsen provides national weighted measurements using sample weights to reflect U.S. Census data in 9 demographic and 61 geographic targets in the United States (2). Weights incorporate the complex survey design and undersampling when present and are updated annually to reflect changes in the population.
We selected 1 April to 30 June 2020 as the study period because starting on 1 April provided a washout period for differing state lockdown timing and initial hoarding behavior in March 2020 (3) and because 3-month periods provided sufficient sample size for each demographic cell.
To assess prepandemic secular trends, we collected April-to-June sales data for prepandemic years (2017 to 2019) compared with such data during the pandemic (2020).
To estimate consumer behavior shifts from on-premise (such as restaurants and bars) to off-premise (that is, home) consumption, as well as other pandemic-related purchasing behavior not specific to substance misuse (for example, hoarding, consumer confidence changes, and income or employment changes), we repeated all analyses using purchases of nonalcoholic beverages excluding bottled water and total purchases of any item by a non–alcohol purchaser, which would be expected to increase with on-premise closures. To account for purchasing at different prices (such as discounted items) and tax or tariff changes, we also assessed units (1 unit = 1 barcode scan) instead of dollars. Finally, to account for possible mixed demographics within households, we repeated analyses restricted to single-member households.
The unweighted April-to-June 2020 cohort included 71 502 households: 31 296 (44%) recorded at least 1 unit of alcohol, and 11 265 (16%) recorded at least 1 unit of tobacco.
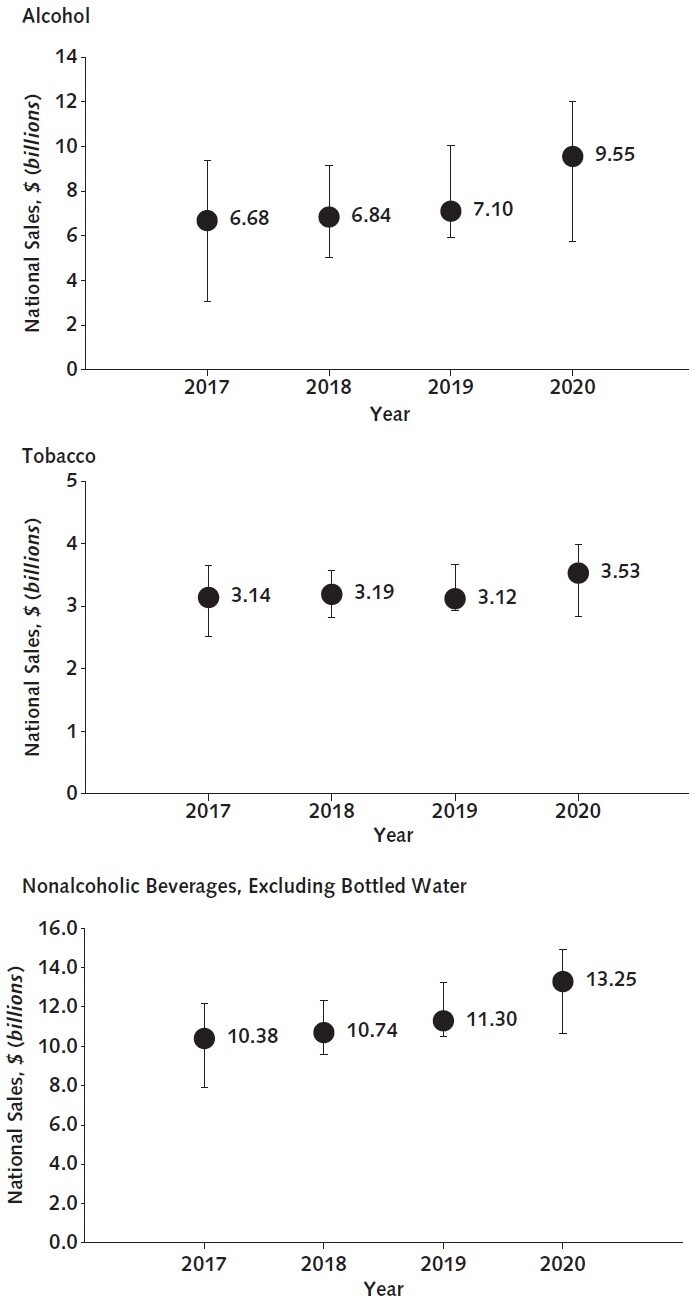
Total weighted sales from April to June increased from $7.10 billion in 2019 to $9.55 billion in 2020 (relative change, +34.4%) for alcohol (Figure, top) and from $3.12 billion in 2019 to $3.53 billion in 2020 (relative change, +13.2%) for tobacco (Figure, middle).
Figure. Weighted national estimates of retail sales.

Point estimates (circles) with 95% CIs (error bars). Top. Alcohol. Middle. Tobacco. Bottom. Nonalcoholic beverages, excluding bottled water.
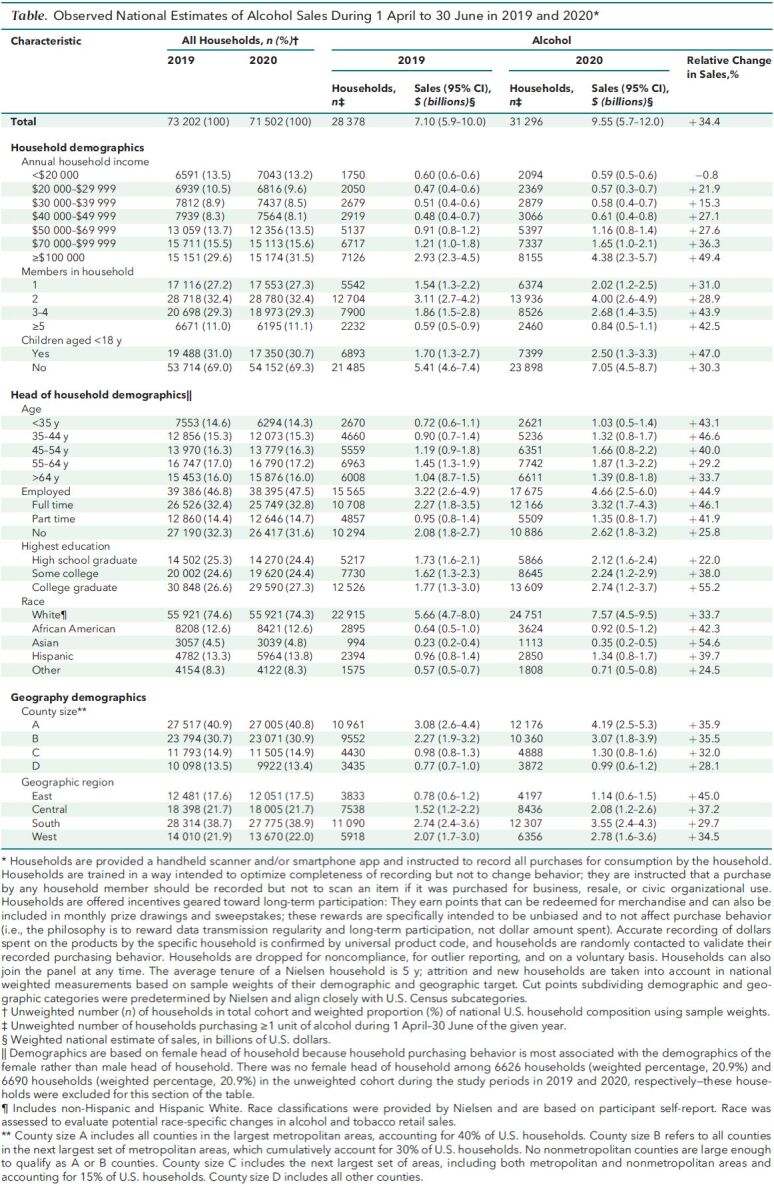
National weighted alcohol and tobacco sales increased in all demographic and geographic categories comparing 2019 versus 2020 (April to June), except among households with an annual income less than $20 000 for alcohol sales (relative change, −0.8%) (Table). Relative increases in alcohol sales were higher among higher-income households, younger adults, larger households, households with children younger than 18 years, and ethnic minorities; relative increases in tobacco sales were higher among these demographics as well (data not shown). Relative increases in sales were higher for liquor (+49.2%) than for wine (+29.1%) or beer, malt beverages, and cider (+30.2%) (data not shown).
Table. Observed National Estimates of Alcohol Sales During 1 April to 30 June in 2019 and 2020*.

In analyses to assess confounding, purchases of nonalcoholic beverages excluding bottled water increased from $11.3 billion to $13.3 billion (relative change, +17.7%) (Figure, bottom) and total purchases of any item by a non–alcohol purchaser increased from $88.4 billion to $90.7 billion (relative change, +2.6%) (data not shown) in 2019 to 2020 (April to June). Results using units instead of dollars were consistent with the primary analyses, suggesting that results are independent of any pricing differences or changes in taxes or tariffs during the study period. Results from the data set of single-member households were consistent with primary analyses, suggesting that results are independent of mixed-household demographics.
Discussion: Retail alcohol and tobacco sales increased 34% and 13%, respectively, early during the COVID-19 pandemic compared with the same period in the year prior. The greater increase in alcohol sales unlikely reflects bar and restaurant closures alone because alcohol sales increased more (+34.4%) than nonalcoholic beverage sales (+17.7%) or total sales by a non–alcohol purchaser (+2.6%). Previous estimates (4) were that 22% growth of off-premise alcohol sales would be needed to fully offset on-premise losses from closures—in our analysis, alcohol sales increased 34%.
Alcohol and tobacco purchases increased in all geographic and almost all demographic categories. Relative increases were higher in the same demographic subgroups reported to have increased stress and anxiety during the pandemic (5). However, aggregated data limit conclusions regarding individual consumption patterns and whether increases are due to increased drinking versus purchases for other uses (such as baking and cooking).
Further research should explore whether increased alcohol and tobacco sales may be associated with increased health threats from substance use, which would require the attention of health professionals and policymakers.
Footnotes
This article was published at Annals.org on 2 March 2021.
References
- 1.Harris JM. Using Nielsen Homescan data and complex survey design techniques to analyze convenience food expenditures. Presented at American Agricultural Economics Association Annual Meeting, Providence, Rhode Island, 24–27 July 2005.
- 2.Einav L, Leibtag E, Nevo A. On the accuracy of Nielsen Homescan data. U.S. Department of Agriculture Economic Research Service; 2008. Economic Research Report no. 69.
- 3.Suthivarakom G. Don't overdo the coronavirus stockpiling. New York Times. 31 March 2020. Accessed at www.nytimes.com/2020/03/31/smarter-living/wirecutter/dont-overdo-the-coronavirus-stockpiling.html on 20 August 2020.
- 4.Nielsen. Rebalancing the ‘COVID-19 effect' on alcohol sales. 7 May 2020. Accessed at https://nielseniq.com/global/en/insights/2020/rebalancing-the-covid-19-effect-on-alcohol-sales on 20 August 2020.
- 5. Czeisler MÉ , Lane RI , Petrosky E , et al. Mental health, substance use, and suicidal ideation during the COVID-19 pandemic — United States, June 24-30, 2020. MMWR Morb Mortal Wkly Rep. 2020;69:1049-1057. [PMID: ] doi: 10.15585/mmwr.mm6932a1 [DOI] [PMC free article] [PubMed] [Google Scholar]


