Abstract
Eye-tracking research on social attention in infants and toddlers has included heterogeneous stimuli and analysis techniques. This allows measurement of looking to inner facial features under diverse conditions but restricts across-study comparisons. Eye-mouth index (EMI) is a measure of relative preference for looking to the eyes or mouth, independent of time spent attending to the face. The current study assessed whether EMI was more robust to differences in stimulus type than percent dwell time (PDT) toward the eyes, mouth, and face. Participants were typically developing toddlers aged 18 to 30 months (N = 58). Stimuli were dynamic videos with single and multiple actors. It was hypothesized that stimulus type would affect PDT to the face, eyes, and mouth, but not EMI. Generalized estimating equations demonstrated that all measures including EMI were influenced by stimulus type. Nevertheless, planned contrasts suggested that EMI was more robust than PDT when comparing heterogeneous stimuli. EMI may allow for a more robust comparison of social attention to inner facial features across eye-tracking studies.
Keywords: Eye-tracking, social attention, eye-mouth index, EMI, typically developing, toddlers, stimuli, stimulus
Introduction
Eye movements are one of the first observable behavioral responses in infants (Feng, 2011) and can provide insight into cognitive development through eye-tracking (Boardman & Fletcher-Watson, 2017). A common focus of infant eye-tracking research is social cognition—gaze in the context of goal-directed behaviors. Such studies address factors that influence attention to facial features. For example, attentional cues such as eye contact draw infants’ attention to the eyes (Senju & Csibra, 2008), while child-directed speech draws attention to the mouth (Frank, Vul & Saxe, 2012). Preferences for attending to the eyes or mouth change across age (Lewkowicz & Hansen-Tift, 2012), dependent on characteristics including language and joint attention skills (Schietecatte, Roeyers & Warreyn, 2012).
Low levels of task demands make eye-tracking suitable for studying neurodevelopmental disorders (Venker & Kover, 2015) such as autism spectrum disorder (ASD), associated with atypical social cognition (Zwaigenbaum, Bryson & Garon, 2013). Research suggests that atypical visual attention to the eyes may play a causal role in this abnormality (Bird, Press & Richardson, 2011). Therefore, eye-tracking has the potential to highlight diagnostic markers of ASD.
A confound within infant eye-tracking research is heterogeneity of stimulus type, which range in complexity: static faces (Shic, Chawarska, Bradshaw & Scassellati, 2008) including inverted faces and affective expressions (Oakes & Ellis, 2011), single actors addressing the camera (Chawarska, Macari & Shic, 2012) or simulating interactive games (Jones, Carr & Klin, 2008), and multiple actors interacting (Shic, Bradshaw, Klin, Scassellati & Chawarska, 2011). Papagiannopoulou, Chitty, Hermens, Hickie and Lagopoulos (2014) reviewed infant eye-tracking studies investigating ASD, and argued that:
“a lack of consistency in the approaches to data collection, analysis, and subsequently, interpretation … has led to a number of contradictory findings and the lack of an overall consensus on the interpretation of these changes” (p. 613).
While children with ASD reliably look less at actors’ eyes than controls, the authors argue that it is not possible to make conclusions about attention toward the mouth due to methodological inconsistencies.
Frank, Vul and Saxe (2012) presented varying stimulus types to typically developing children between three and 30 months old; they found interactions between stimulus type and age. In a face-only condition, young children attended more to the eyes, and older children more to the mouth. In the whole-person and multiple-people conditions, older children looked more toward the hands. Gaze was less predictable in multiple versus single actor conditions. Similarly, Libertus, Landa and Haworth (2017) found that static stimuli revealed a stronger preference for attending to faces in infants’ first year. For dynamic stimuli this preference appeared during the second year. Evidently, infants’ gaze is transient across development, contingent on stimulus type.
Stimulus effects are often interpreted as effects of social context on visual attention. However, they may reflect physical properties such as the size of actors’ faces relative to the screen. Indeed, researchers have been unable to make comparisons across stimuli for this reason (Chevallier et al., 2015). In the current study, we ask whether specific eye gaze measures are better than others for comparison across stimuli.
Typically, eye-tracking studies include areas of interest (AOIs) to encompass inner facial features. The Percent Dwell Time (PDT) measure reflects the proportion of total time during which gaze dwells on an AOI. Alternatively, fixation frequency or duration can be calculated using spatial and temporal parameters. PDT and fixation measures are highly correlated when using the same eye-tracking procedure (Vansteenkiste, Cardon, Philippaerts & Lenoir, 2015). Both approaches appear sensitive to stimulus effects (e.g., Cassidy, Mitchell, Chapman & Ropar, 2015; Frank et al., 2012).
Eye-mouth index (EMI) is a measure indicating relative preference for looking to the eyes or mouth (Merin, Young, Ozonoff & Rogers, 2007). EMI is therefore not contingent on overall looking to the face; likely to vary across stimuli. There is evidence that EMI reveals important effects. Shic, Macari and Chawarska (2014) measured EMI in six-month-old infants with static faces, and videos of actors smiling or speaking. EMI was highest during the static, then the affective, then the speech condition. This suggests that attention to the mouth is influenced by its relevance in providing communicative cues. Chawarska and Shic (2009) demonstrated that high EMI predicts impaired facial recognition in infants with ASD and argue that abnormal attention toward the mouth causes ineffective coding of facial features. In stimuli involving child-directed speech, EMI in infancy negatively predicts expressive language competency at 24 months (Young, Merin, Rogers & Ozonoff, 2009) and 36 months (Elsabbagh et al., 2014). EMI appears sensitive to context, group differences, and individual characteristics.
Because EMI does not depend on time spent attending to the face, it may be a more stable measure of attention to inner facial features than PDT. Indeed, Kwon, Moore, Barnes, Cha and Pierce (2019) argue that ratios of relative attention may better reflect gaze than fixation measures. The aim of the current study was to measure the robustness of EMI to stimulus effects. Naturalistic stimuli were presented to typically developing toddlers. We tested two hypotheses: first, that PDT toward the face, eyes, and mouth would be influenced by stimulus type; and second, that EMI would be robust to stimulus type.
Method
Design
The current study had an experimental design. The proportion of time participants spent attending to several AOIs under five stimulus conditions was measured. It was predicted that condition would significantly affect PDT to these AOIs, but would not affect EMI. The key metrics, their calculation, and their role are summarised in Table 1. Output for each metric was measured on the ratio level.
Table 1.
Summary of metrics, their calculation, and their role in analysis.
| Metric | Calculation | Role |
|---|---|---|
| Areas of Interest | Hand drawn on the SensoMotoric Instruments BeGaze software. | Quantifying looking time towards facial features. |
| Percent Dwell Time | The percentage of valid looking time towards a given area of interest. Calculated on Microsoft Excel using raw data from BeGaze. | A raw measure of looking time. |
| Eye-Mouth Index | Looking time to eyes area of interest/ (Looking time to eyes area of interest + looking time to mouth area of interest). | An indexed measure of looking to inner facial features |
| Precise Area of Interest Size | Measured in pixels of the screen, exported through BeGaze. | Displaying exact area of interest size. |
| Relative Area of Interest Size | % of the screen covered by each area of interest, exported through BeGaze. | Comparing the size of areas of interest. |
| Tracking Ratio | % of trial time during which gaze was successfully tracked. | Determining eligibility of trials for analysis (eligible if above 50%). |
Participants
We recruited toddlers who were not born prematurely (before 37 weeks), did not have uncorrected hearing or vision impairments, and did not have first-degree relatives with ASD. Sixty-four toddlers from ages 18 to 30 months participated. The primary caregiver completed the Modified Checklist for Autism in Toddlers, an instrument that classifies toddlers as low-, medium-, or high-risk for ASD. Four participants scored medium- or high-risk and were excluded from analysis. Two participants did not engage with the eye-tracking stimuli and were also excluded. The final sample included 58 toddlers with a mean age of 24.21 months (SD = 3.62).
Apparatus
Eye-tracking data was collected using a SensoMotoric Instruments (SMI) iView X™ Remote Eyetracking Device (RED) at a sampling rate of 120 Hz. Stimuli were presented on a 55.88 cm monitor with a 25.9° × 40.2° visual angle. The system detects blinks as points in the gaze stream with vertical and horizontal position both equalling zero (SMI, 2014, p. 295). Blink events are discarded if the duration is less than 70 ms. The system recovers from lost gaze within 135 ms and from blinks within 16 ms (SMI, 2014, p. 167).
Stimuli
We re-created stimuli described in previous infant eye-tracking studies (see Table 2).
Table 2.
Summary of stimuli and gaze measures as described in previous studies.
| Study | Stimulus content | Measure of looking to areas of interest |
|---|---|---|
| Chawarska et al. (2012; 2013) | Single actor in conditions of dyadic bid, moving toys, joint attention, and sandwich making. | Total valid looking time. |
| Chevallier et al. (2015) | Static, dynamic, and interactive visual exploration tasks, including a mix of single and multiple actors. | Total fixation duration. |
| Elsabbagh et al. (2014) | A single actor’s face displaying communicative signals. | Eye-mouth index. |
| Frank et al. (2012) | Live action TV clips; face only, whole-person, multiple people, and objects. | Percent dwell time. |
| Jones et al. (2008) | A single actor looking to the camera, engaging in childhood games (e.g., pat-a-cake). | Fixation duration. |
| Norbury et al. (2009) | Videos of 2–3 characters speaking. | Fixation count and duration. |
| Shic et al. (2011) | A video of a child and adult playing with a puzzle, including vocalizations. | Total valid looking time. |
| Shic et al. (2014) | Whole-face stimuli; static image, video of actor smiling, and reciting a nursery rhyme. | Total valid looking time, and eye-mouth index. |
| von Hofsten et al. (2009) | Conditions of visible motion, occluded motion, 2 adults conversing, turn-taking objects. | Fixation duration. |
Stimuli were naturalistic dynamic videos, divided into single and multiple actor categories.
1 –. Single Actor
The first stimulus category included single actors presenting eye contact and speech toward the camera.
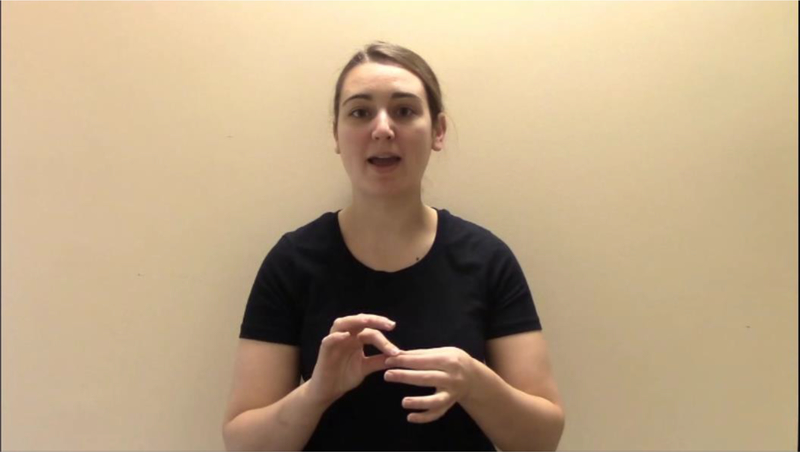
1a.
The 1a condition reflected previous stimuli involving simulated caregiver interactions (e.g., Elsabbagh et al., 2014; Jones et al., 2008; Shic, Macari & Chawarska, 2014). This involved a single actor reciting nursery rhymes accompanied by hand movements and eye contact across three 15-second trials: ‘itsy bitsy spider’, ‘I’m a little teapot’, and ‘pat-a-cake.’ See Figure 1.
Figure 1.
Still frame from the 1a condition.
1b.
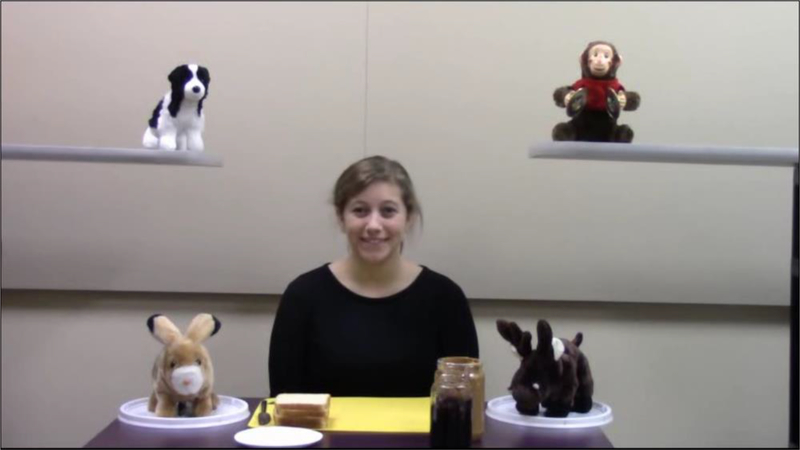
The 1b condition was a replication of a stimulus used by Chawarska, Macari and Shic (2012, 2013). This was a 3-minute and 11-second video in which an actor sat at a table surrounded by four toys, with the materials for making a sandwich in front of her, engaging in four activities; dyadic bid, joint attention, moving toys, and sandwich making.
Gaze during the dyadic bid portions of the stimulus was analyzed. There were 11 6-second dyadic bid trials, wherein the actor addressed the camera with phrases including “Aren’t these toys fun? I love toys, the puppy is my favourite. I like her floppy ears.” See Figure 2. The joint attention, moving toys, and sandwich making included minimal or no attentional cues. These conditions were therefore less social than dyadic bid and were not analyzed.
Figure 2.
Still frame from a ‘dyadic bid’ portion of the 1b condition.
2 –. Multiple Actors
The second category involved multiple actors interacting, giving no attention to the camera.
2a.
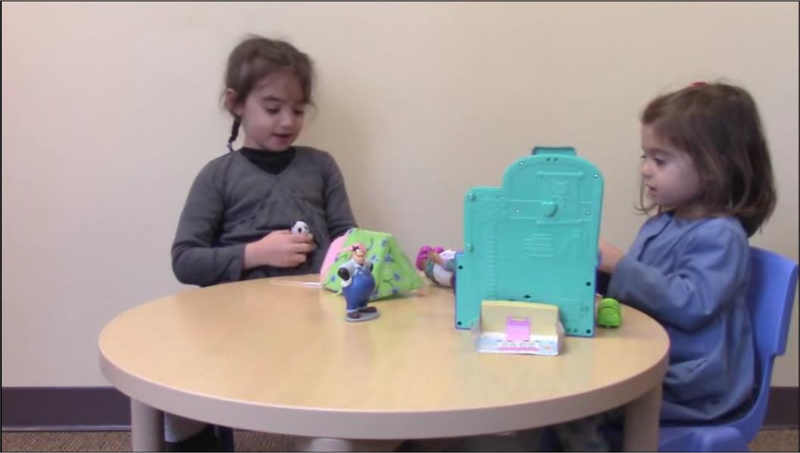
The 2a condition involved two children playing together with toys while conversing (e.g., Chevallier et al., 2015). Three 15-second trials were presented including the same actors. See Figure 3.
Figure 3.
Still frame from the 2a condition.
2b.
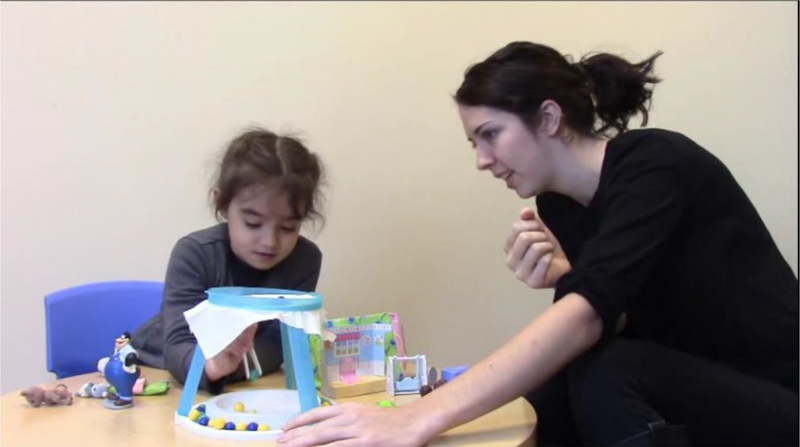
The 2b condition displayed one adult and one child playing an interactive game while conversing (e.g., Frank et al., 2012; Shic et al., 2011). Three 15-second trials were presented including the same actors. See Figure 4.
Figure 4.
Still frame from the 2b condition.
2c.
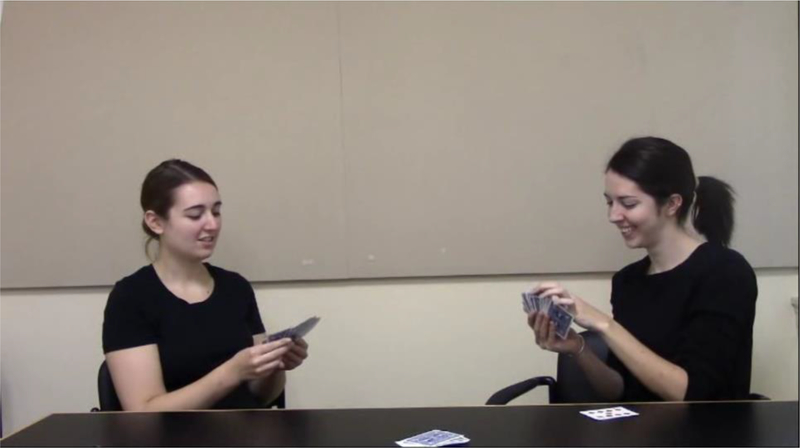
The 2c condition displayed two adults playing a card game (‘go fish’) while conversing (e.g., Norbury et al., 2009; von Hofsten, Uhlig, Adell & Kochukhova, 2009). Three 15-second trials were presented including the same actors. See Figure 5.
Figure 5.
Still frame from the 2c condition.
Participants also viewed 36 ‘whole-face’ stimuli involving faces of varying affect and orientation. The current analysis focused on social attention in naturalistic dynamic social scenes; therefore, the whole-face stimuli were excluded. See Table 3 for a summary of conditions.
Table 3.
Summary of stimulus conditions.
| Category | Condition | Description |
|---|---|---|
| Single actor | 1a | A single actor reciting nursery rhymes while looking at the camera, with accompanying hand movements. |
| 1b | A single actor sat at a table surrounded by toys, looking at and speaking to the camera. | |
| Multiple Actors | 2a | Two children sat at a table, interactively playing with toys while conversing. |
| 2b | One adult and one child sat a table, playing an interactive game while conversing. | |
| 2c | Two adults sat a table, playing an interactive card game while conversing. |
The single and multiple actor categories were not factored into the data analysis. Rather, the distinction between them permits interpretation of the results of planned contrasts described below.
Procedure
Participants sat in a highchair 65 cm from the eye-tracker and screen. Parents sat behind, out of range of the eye-tracker and were encouraged to direct their child’s attention back to the “video” in cases where they became distracted. Parents were asked to avoid directing participants’ attention to specific aspects of the stimuli through explicit prompts such as “look at that face/toy” or through gestures such as pointing, in order to minimize the effect of the parent on gaze.
Participants completed a five-point calibration involving an animated cartoon tiger. Each calibration point was 2.8 cm in length and width, consisting of 19,566 pixels and covering 5.01% of the screen. The system required detection of gaze on a given calibration point before the next was presented.
A validation procedure was used to confirm calibration quality. This reflects the average measurement accuracy of the calibration procedure, by determining degrees of deviation in the X and Y directions (SMI, 2014, p.73). We ensured that each participant had less than one degree of deviation in either direction before beginning. Throughout the presentation of the eye-tracking stimuli, the experimenter continuously conducted a qualitative assessment of eye-tracking data quality, ensuring that the gaze cursor remained relatively stable. On occasions where the gaze cursor began to move erratically or did not appear to reflect the participant’s eye movements (compared to the video display of participants’ eyes visible to the experimenter through iView), re-calibration and validation were conducted. Regrettably, validation values were only recorded for the final 28 participants. On average, this yielded deviation of .714° in the X direction, and .861° in the Y direction. There was no significant difference between the full dataset and participants with recorded validation, for any dependent variable in any condition. The data sets with and without these participants produced comparable inferential statistics.
Forty-nine trials were presented with a running time of approximately eight minutes. As noted above, the current analysis focuses on 13 of these trials that depict social scenes (combined running time 6 minutes 11 seconds). Stimulus order was pseudorandomized. If the participant became disinterested, or the system was unable to detect their eyes, re-calibration was manually inserted, and participants were given a break if required.
Data Analysis
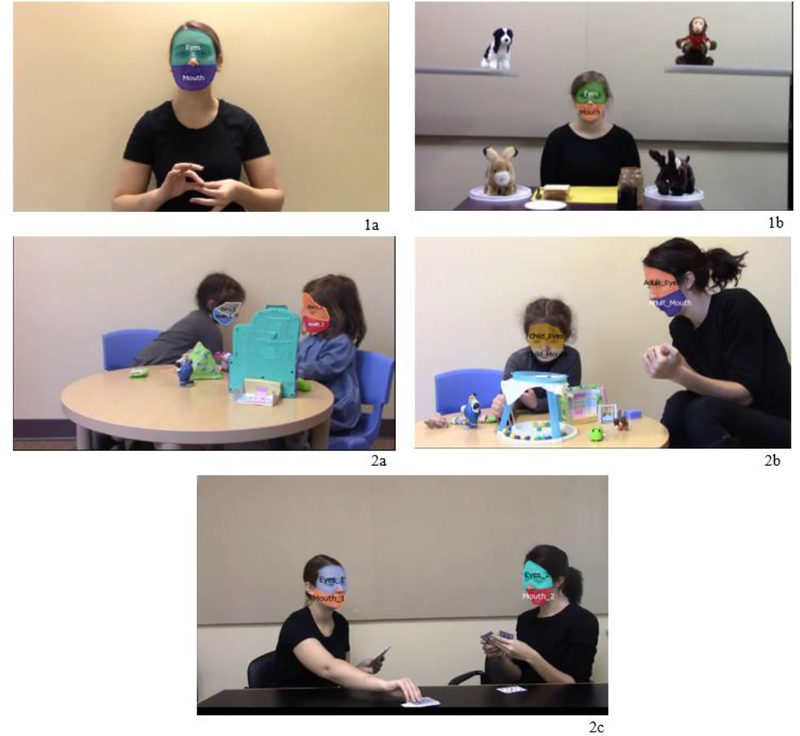
Areas of interest (AOIs) were defined for eyes and mouth; constituting the upper and lower halves of the face, respectively, with the nose excluded. In analysis a face AOI was created, a composite of eyes and mouth. AOI limits were drawn precisely around relevant features and changed in shape, size and position with the actors’ movements. See Figure 6.
Figure 6.
Screenshots of the AOIs used in the 1a (top left), 1b (top right), 2a (middle left), 2b (middle right), and 2c (bottom) conditions.
Precise and relative sizes of AOIs across conditions are displayed in Table 4. As AOIs changed in size over time, average sizes are reported. For multiple actor conditions (2a, 2b, 2c), the size of both actors’ features combined are reported. For conditions including three trials (1a, 2a, 2b, 2c), ‘i’, ‘ii’ and ‘iii’ refer to the first, second and third trials, respectively.
Table 4.
The size of the calibration point and areas of interest in pixels and their % screen coverage for each trial and averages within condition (in bold).
| Size (pixels) | Coverage (%) | |||||
|---|---|---|---|---|---|---|
| Calibration point | 19566 | 5.0 | ||||
| Stimulus | Eyes | Mouth | Face | Eyes | Mouth | Face |
| 1ai | 6107 | 4355 | 10462 | 1.6 | 1.1 | 2.7 |
| 1aii | 5882 | 4023 | 9905 | 1.5 | 1 | 2.5 |
| 1aiii | 5319 | 3524 | 8843 | 1.4 | 0.9 | 2.3 |
| 1a (average) | 5769 | 3967 | 9737 | 1.5 | 1 | 2.5 |
| 1b | 2050 | 1088 | 3138 | 0.5 | 0.3 | 0.8 |
| 2ai | 3392 | 1962 | 5354 | 0.9 | 0.5 | 1.4 |
| 2aii | 6528 | 2488 | 9016 | 1.7 | 0.6 | 2.3 |
| 2aiii | 5147 | 2376 | 7523 | 1.3 | 0.6 | 1.9 |
| 2a (average) | 5022 | 2275 | 7298 | 1.3 | 0.6 | 1.9 |
| 2bi | 5756 | 3520 | 9276 | 1.5 | 0.9 | 2.4 |
| 2bii | 6482 | 3599 | 10081 | 1.7 | 0.9 | 2.6 |
| 2biii | 5875 | 3571 | 9446 | 1.6 | 0.9 | 2.5 |
| 2b (average) | 6038 | 3563 | 9601 | 1.6 | 0.9 | 2.5 |
| 2ci | 3705 | 2052 | 5757 | 0.9 | 0.5 | 1.4 |
| 2cii | 4032 | 2027 | 6059 | 1 | 0.5 | 1.5 |
| 2ciii | 4176 | 2204 | 6380 | 1.1 | 0.6 | 1.7 |
| 2c (average) | 3971 | 2094 | 6065 | 1 | 0.5 | 1.5 |
Attention toward the screen was measured using tracking ratio (TR), the percentage of each trial during which the eye-tracker located the participant’s gaze. Trials with a TR below 50% were excluded. Participant data for a condition was analyzed if the TR was above 50% for at least one trial. Data from the 1b condition was included if the TR for its single trial was above 50%. Table 5 presents, for each condition, the number of participants (out of 58) with at least one eligible trial, the percentage of trials that yielded usable data, and average TR.
Table 5.
Descriptive statistics for included trials and tracking ratio across conditions.
| 1a | 1b | 2a | 2b | 2c | |
|---|---|---|---|---|---|
| Included participants (N) | 57 | 51 | 56 | 57 | 54 |
| Included trials (%) | 85.38 | N/A | 88.10 | 84.21 | 81.76 |
| Average tracking ratio (%) | 82.64 | 81.06 | 81.33 | 84.35 | 79.39 |
We considered two measures: percent dwell time (PDT), and eye-mouth index (EMI). PDT was calculated as the time spent attending to a given AOI as a percentage of total tracked looking time. This metric was derived from participants’ locus of gaze at each frame. PDT was used instead of fixation duration/frequency as PDT does not rely on predefined parameters. PDT to each AOI was averaged across the three trials within the 1a, 2a, 2b and 2c conditions, and across the 11 dyadic bid portions of the 1b condition. To support averaging, intraclass correlation coefficients (ICCs) were calculated across trials for PDT to each AOI within conditions. A two-way random model was used to look for absolute agreement between cases, with average measures interpreted. ICCs ranged from .575 to .947 (mean = .703, SD = .137), indicating moderate to excellent agreement between trials (Koo & Mae, 2016). In order to allow for modelling using a binomial distribution and a logit link function, PDT values were transformed from percentages to proportions (between 0 and 1) for analysis.
EMI was calculated with the formula:
A value between 0 and 0.5 indicates a preference for looking to the mouth, a value between 0.5 and 1 indicates a preference for the eyes.
Results
A preliminary analysis assessed whether participant age had any effect. Spearman rank correlation tests were used to look for an association between age and each dependent variable in each condition. No coefficients approached significance; ranging from −.157 to .130. Age was not considered in further analyses.
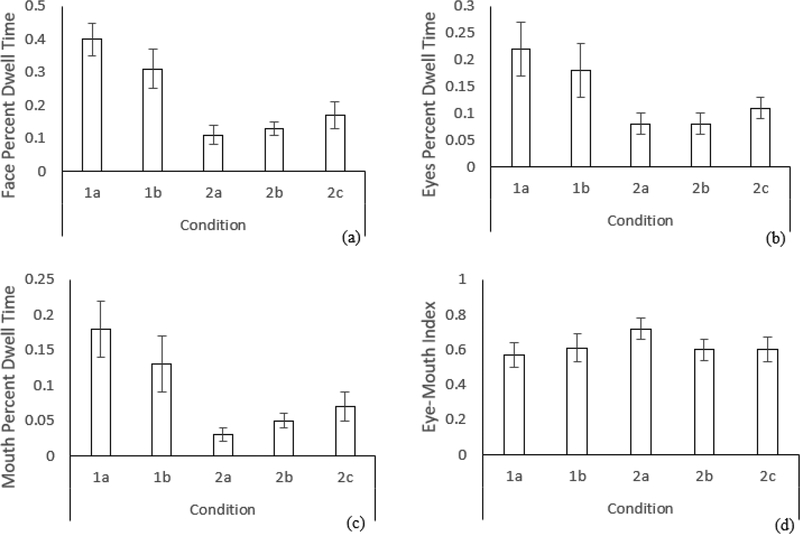
Hypothesis 1 predicted that face, eyes, and mouth PDT would be affected by stimulus type. Hypothesis 2 predicted that EMI would be robust to stimulus type. See Figure 7 for bar charts of model-based means of dependent variables across conditions, with 95% confidence interval error bars.
Figure 7:
Bar charts with 95% confidence interval error bars for dependent variables across conditions for (a) face percent dwell time, (b) eyes percent dwell time, (c) mouth percent dwell time, and (d) eye-mouth index, N = 58.
Shapiro-Wilk tests demonstrated that face, eyes and mouth PDT, and EMI, were non-normally distributed in all but two cases. The data was imported into R Version 3.6.1 for statistical analysis. Generalized estimating equations (GEE) were used to model PDT towards the face, eyes, and mouth, and EMI, as a function of participant within each condition. A separate cell means model was estimated for each outcome variable. Condition was included as a fixed effects term in the model and the within-subject correlation was modelled with a compound symmetry correlation matrix structure. To satisfy the assumption of normality, a binomial distribution with a logit link was applied to each model. See Appendix A for all model parameter estimates.
Pairwise comparisons between conditions were conducted via orthogonal contrasts using the emmeans function. The Holm test was used to adjust the p-values for multiple comparisons in order to maintain the two-tailed family-wise alpha at 0.05 at the time of analysis. Pairwise comparisons with adjusted p-values are reported in Table 6.
Table 6.
Pairwise comparisons comparing dependent variables across conditions. Odd ratios are reported as a metric of effect size for each comparison. * denotes a significant difference after Holm correction. Note: N = 57 for 1a, 57 for 1b, 56 for 2a, 57 for 2b, and 54 for 2c.
| Comparison | Face percent dwell time | Eyes percent dwell time | Mouth percent dwell time | Eye-mouth index |
|---|---|---|---|---|
| 1a – 1b | OR=1.44, Z = 3.18, p = .003* | OR=1.25, Z = 1.64, p = .20 | OR=1.44, Z = 2.46, p = .01* | OR=0.83, Z = − 1.05, p = .99 |
| 1a – 2a | OR=5.29, Z = 12.76, p < .001* | OR=3.33, Z = 8.35, p < .001* | OR=6.48, Z = 13.87, p < .001* | OR=0.50, Z = − 4.17, p < .001* |
| 1a – 2b | OR=4.39, Z = 12.96, p < .001* | OR=3.23, Z = 8.49, p < .001* | OR=4.10, Z = 11.52, p < .001* | OR=0.87, Z = − 0.85, p = .99 |
| 1a – 2c | OR=3.15, Z = 10.28, p < .001* | OR=2.39, Z = 5.96, p < .001* | OR=2.99, Z = 7.76, p < .001* | OR=0.87, Z = − 0.75, p = .99 |
| 1b – 2a | OR=3.68, Z = 9.08, p < .001* | OR=2.66, Z = 6.13, p < .001* | OR=4.51, Z = 10.99, p < .001* | OR=0.60, Z = − 3.43, p = .005* |
| 1b – 2b | OR=3.05, Z = 8.34, p < .001* | OR=2.58, Z = 6.48, p < .001* | OR=2.85, Z = 6.97, p < .001* | OR=1.05, Z = 0.34, p = .99 |
| 1b – 2c | OR=2.19, Z = 6.41, p < .001* | OR=1.91, Z = 4.68, p < .001* | OR=2.08, Z = 4.39, p < .001* | OR=1.05, Z = 0.28, p = .99 |
| 2a – 2b | OR=0.83, Z = − 1.70, p = .09 | OR=0.97, Z = − 0.21, p = .83 | OR=0.63, Z = − 3.56, p = .001* | OR=1.74, Z = 4.25, p < .001* |
| 2a – 2c | OR=0.59, Z = − 4.78, p < .001* | OR=0.72, Z = − 2.16, p = .09 | OR=0.46, Z = − 6.26, p < .001* | OR=1.73. Z = 2.80, p = .04* |
| 2b – 2c | OR=0.72, Z = − 3.33, p = .003 | OR=0.74, Z = − 2.47, p = .054 | OR=0.73, Z = − 2.68, p = .01 | OR=0.99, Z = − 0.40, p = .99 |
| Total sig. (N) | 8 | 6 | 9 | 4 |
Results of the GEE and pairwise comparisons suggested that, in accordance with Hypothesis 1, face PDT, eyes PDT, and mouth PDT were significantly different across conditions. Comparisons were statistically significant in eight out of ten cases for face PDT, six out of then cases for eyes PDT, and nine out of ten cases for mouth PDT. Contrary to Hypothesis 2, EMI was significantly affected by condition. However, far fewer of the EMI pairwise comparisons (four out of ten) were significant for this dependent variable.
Discussion
Previous eye-tracking research has used heterogenous stimuli to measure children’s attention toward inner facial features. The current study examined the robustness of eye-mouth index (EMI) to stimulus type. EMI is a metric of relative time spent looking to the eyes and mouth, not contingent on overall looking time to the face. EMI was compared to percent dwell time (PDT) toward the face, eyes, and mouth areas of interest (AOIs) during dynamic naturalistic stimuli across five conditions including single and multiple actors. Hypothesis 1 predicted that face, eyes, and mouth PDT would be significantly affected by condition, while Hypothesis 2 predicted that EMI would not.
In line with Hypothesis 1, PDT toward the face, eyes and mouth were significantly affected by condition. Contrary to Hypothesis 2, EMI was also affected by condition. However, it could be argued that EMI was more robust than PDT. Pairwise comparisons between conditions (see Table 6) demonstrate that PDT toward the face, eyes and mouth was different in most comparisons. Conversely, effects of condition on EMI were driven only by relatively high EMI in the 2a condition.
When comparing across the two single actor stimuli, face and mouth PDT were significantly different, while eyes PDT and EMI were not. The 1a and 1b stimuli both involved a single actor displaying eye contact and child-directed speech but were otherwise different; the former involving nursery rhymes against a blank background, and the latter child-directed speech while surrounded by toys. In line with the current findings, previous research has demonstrated that eye contact reliably elicits attention toward the eyes (Senju & Csibra, 2008). Therefore, when comparing such stimuli, PDT may be a sufficiently stable metric of gaze towards actors’ eyes. Differences between conditions for PDT towards actors’ mouths and faces suggests that EMI may be a relatively stable metric of gaze to these features when making comparisons between single actor stimuli.
Within the multiple actors category, mouth PDT and EMI were affected by condition in two of three comparisons. Conversely, face PDT was different in one comparison, and eyes PDT was not affected in any. The stimuli within this category were considerably heterogenous. Furthermore, evidence suggests that infants’ gaze becomes more inconsistent when multiple actors are presented (Franchak, Heeger, Hasson & Adolph, 2016). Despite this, EMI was affected to a higher degree than PDT towards the eyes or face. Though this appears to have occurred due to relatively high EMI in the 2a condition, this provides evidence of susceptibility to stimulus effects. Within this category EMI may not be more stable than PDT.
Comparing single and multiple actor stimuli reveals the robustness of EMI. Significant differences were seen for face, eyes, and mouth PDT for all six across-category comparisons. EMI only showed differences between the 1a and 2a stimuli, and between the 1b and 2a stimuli. This is notable given the heterogeneity of the single and multiple actor stimuli, which varied in content and social complexity. Previous stimuli have involved a mix of single (e.g., Chawarska et al., 2012; Jones et al., 2008) and multiple actors (e.g., Chevallier et al., 2015; Frank et al., 2012), making it difficult to make comparisons. As a relatively robust measure, EMI may prove useful in comparing gaze across studies while reflecting group differences (Chawarska & Shic, 2009) and individual characteristics (Young et al., 2009). Kwon et al. (2019) suggest that fixations to actors’ eyes are insufficient for characterizing gaze abnormalities in ASD, and “an index of competition between faces and external distractors” may be superior (p. 1004). We similarly suggest that adopting EMI as a single index of attention to inner facial features will support characterization of typical and atypical gaze when comparing across heterogeneous stimuli.
Limitations
Both single actor stimuli included the direct attentional cues of eye contact and child-directed speech. These were absent in the multiple actors stimuli. This was done to replicate stimuli from previous research, and to present naturalistic social situations. However, we cannot conclude whether differences across the single and multiple actor stimuli were due to social complexity or the presence of attentional cues.
One explanation for EMI being less affected by condition than PDT is increased variability. Transforming EMI and PDT to the same scale revealed that the standard deviation for EMI was considerably larger than each PDT measure. This may have decreased power to detect condition effects. The current results should therefore be interpreted cautiously. Despite this, ICCs revealed that the average trial-by-trial reliability of EMI (.670) was comparable to eyes (.712), mouth (.669) and face PDT (.762), suggesting that this increased variability had not led to less reliable recording.
Conclusions
Our results support the use of EMI as a relatively robust metric of social attention. As demonstrated by a significant condition effect, EMI is not infallible. However, EMI appears more robust than PDT toward inner facial features when making comparisons across heterogenous stimuli. EMI appeared more robust than PDT when comparing across single actor stimuli, and when comparing single to multiple actor stimuli, but not when comparing across multiple actor stimuli. A significant proportion of infant eye-tracking studies utilize single actor stimuli (see Table 2), so this finding still has important theoretical implications for comparing outcomes of single actor stimuli to each other and to those involving multiple actors. Using EMI, future infant eye-tracking research may achieve better consensus about attention toward inner facial features across development, which may assist in understanding markers of abnormal social attention.
Acknowledgements
Thank you to Rebecka Henry for her assistance with study design, Madeline Saunders and Molly Atkinson for their assistance with data collection, Alicia Reifler, Marisa Curtis and Kayla MacKay for their assistance with stimuli creation, Julia Mertens for her guidance in the treatment of eye-tracking data, Sophie Edwards and Kaya LeGrand for their assistance with the reporting of technical information, and Janine Molino for her guidance and assistance in performing statistical analysis.
Funding
The author(s) disclosed receipt of the following financial support for the research, authorship, and/or publication of this article: Research reported in this publication was supported by Emerson College through a Faculty Advancement Fund Grant to Rhiannon J. Luyster and by the National Institute on Deafness and Other Communication Disorders of the National Institutes of Health under award number R01DC016592 awarded to Sudha Arunachalam. The content is solely the responsibility of the authors and does not necessarily represent the official views of the National Institutes of Health.
Appendix A. Parameter estimates for all generalized estimating equation models.
| Face Percent Dwell Time | ||||
|---|---|---|---|---|
| Estimate | 95% Confidence Intervals | Wald statistic | p-value | |
| Intercept | −0.42 | (−0.66, −0.18) | 13.1 | .0003 |
| 1b | −0.36 | (−0.58, −0.14) | 10.1 | <.002 |
| 2a | −1.67 | (−1.92, −1.42) | 162.9 | <.0001 |
| 2b | −1.48 | (−1.70, −1.26) | 168.0 | <.0001 |
| 2c | −1.15 | (−1.37, −0.93) | 105.8 | <.0001 |
| Eyes Percent Dwell Time | ||||
| Estimate | 95% Confidence Intervals | Wald statistic | p-value | |
| Intercept | −1.26 | (−1.51, −1.01) | 99.4 | <.0001 |
| 1b | −0.23 | (−0.50, 0.04) | 2.7 | 0.1 |
| 2a | −1.20 | (−1.47, −0.93) | 69.7 | <.0001 |
| 2b | −1.17 | (−1.44, −0.90) | 72.1 | <.0001 |
| 2c | −0.87 | (−1.16, −0.58) | 35.5 | <.0001 |
| Mouth Percent Dwell Time | ||||
| Estimate | 95% Confidence Intervals | Wald statistic | p-value | |
| Intercept | −1.54 | (−1.83, −1.25) | 102.4 | <.0001 |
| 1b | −0.36 | (−0.65, −0.07) | 6.06 | 0.01 |
| 2a | −1.87 | (−2.14, −1.60) | 192.3 | <.0001 |
| 2b | −1.41 | (−1.65, −1.17) | 132.7 | <.0001 |
| 2c | −1.10 | (−1.37, −0.83) | 60.2 | <.0001 |
| Eye-Mouth Index | ||||
| Estimate | 95% Confidence Intervals | Wald statistic | p-value | |
| Intercept | 0.27 | (−0.04, 0.58) | 2.8 | 0.1 |
| 1b | 0.19 | (−0.16, 0.54) | 1.1 | 0.3 |
| 2a | 0.69 | (0.36, 1.02) | 17.4 | <.0001 |
| 2b | 0.14 | (−0.17, 0.45) | 0.72 | 0.4 |
| 2c | 0.14 | (−0.23, 0.51) | 0.57 | 0.5 |
References
- Bird G, Press C, & Richardson DC (2011). The role of alexithymia in reduced eye-fixation in autism spectrum conditions. Journal of Autism and Developmental Disorders, 41, 1556–1564. [DOI] [PubMed] [Google Scholar]
- Boardman JP, & Fletcher-Watson S (2017). What can eye-tracking tell us? Archives of Disease in Childhood, 102, 301–302. [DOI] [PubMed] [Google Scholar]
- Cassidy S, Mitchell P, Chapman P, & Ropar D (2015). Processing of spontaneous emotional responses in adolescents and adults with autism spectrum disorder: effect of stimulus type. Autism Research, 8(5), 534–544. [DOI] [PMC free article] [PubMed] [Google Scholar]
- Chawarska K, Macari S, & Shic F (2012). Context modulates attention to social scenes in toddlers with autism. Journal of Child Psychology and Psychiatry, 53(8), 1–10. [DOI] [PMC free article] [PubMed] [Google Scholar]
- Chawarska K, Macari S, & Shic F (2013). Decreased spontaneous attention to social scenes in 6-month-old infants later diagnosed with ASD. Biological Psychiatry, 74(3), 195–203. [DOI] [PMC free article] [PubMed] [Google Scholar]
- Chawarska K, & Shic F (2009). Looking but not seeing: atypical visual scanning and recognition of faces in 2 and 4-year-old children with autism spectrum disorder. Journal of Autism and Developmental Disorders, 39, 1663–1672. [DOI] [PMC free article] [PubMed] [Google Scholar]
- Chevallier C, Parish-Morris J, McVey A, Rump KM, Sasson NJ, Herrington JD, & Schultz RT (2015). Measuring social attention and motivation in autism spectrum disorder using eye-tracking: stimulus type matters. Autism Research, 8(5), 620–628. [DOI] [PMC free article] [PubMed] [Google Scholar]
- Elsabbagh M, Bedford R, Senju A, Charman T, Pickles A, Johnson MH, & The BASIS Team. (2014). What you seen is what you get: contextual modulation of face scanning in typical and atypical development. Social Cognitive and Affective Neuroscience, 9(4), 583–543. [DOI] [PMC free article] [PubMed] [Google Scholar]
- Feng G (2011). Eye tracking: a brief guide for developmental researchers. Journal of Cognition and Development, 12(1), 1–11. [Google Scholar]
- Frank MC, Vul E, & Saxe R (2012). Measuring the development of social attention using free-viewing. Infancy, 17(4), 355–375. [DOI] [PubMed] [Google Scholar]
- Franchak JM, Heeger DJ, Hasson U, & Adolph KE (2016). Free viewing gaze behavior in infants and adults. Infancy, 21(3), 262–287. [DOI] [PMC free article] [PubMed] [Google Scholar]
- Jones WJ, Carr K, & Klin A (2008). Absence of preferential looking to the eyes of approaching adults predicts level of social disability in 2-year-old toddlers with autism spectrum disorder. Archives of General Psychiatry, 65(8), 946–954. [DOI] [PubMed] [Google Scholar]
- Koo TK, & Mae YL (2016). A guideline of selecting and reporting intraclass correlation coefficients for reliability research. Journal of Chiropractic Medicine, 15(2), 155–163. [DOI] [PMC free article] [PubMed] [Google Scholar]
- Kwon MK, Moore A, Barnes CC, Cha D, & Pierce K (2019). Typical levels of eye-region fixation in toddlers with autism spectrum disorder across multiple contexts. Journal of the American Academy of Child and Adolescent Psychiatry, 58, 1004–1014. [DOI] [PubMed] [Google Scholar]
- Lewkowicz DJ, & Hansen-Tift AM (2012). Infants deploy selective attention to the mouth of a talking face when learning speech. Proceedings of the National Academy of Sciences of the United States of America, 109(5), 1431–1436. [DOI] [PMC free article] [PubMed] [Google Scholar]
- Libertus K, Landa RJ, & Haworth JL (2017). Development of attention to faces during the first 3 years: influences of stimulus type. Frontiers in Psychology, 8(1976), 1–9. [DOI] [PMC free article] [PubMed] [Google Scholar]
- Merin N, Young GS, Ozonoff S, & Rogers SJ (2007). Visual fixation patterns during reciprocal social interaction distinguish a subgroup of 6-month-old infants at-risk for autism from comparison infants. Journal of Autism and Developmental Disorders, 37(1), 108–121. [DOI] [PubMed] [Google Scholar]
- Norbury C,F, Brock J, Cragg L, Einav S, Griffiths H, & Nation K (2009). Eyemovement patterns are associated with communicative competence in autistic spectrum disorders. Journal of Child Psychology and Psychiatry, 50(7), 834–842. [DOI] [PubMed] [Google Scholar]
- Oakes LM, & Ellis AE (2011). An eye-tracking investigation of developmental changes in infants’ exploration of upright and inverted human faces. Infancy, 18(1), 134–148. [DOI] [PMC free article] [PubMed] [Google Scholar]
- Papagiannopoulou EA, Chitty KM, Hermens DF, Hickie IB, & Lagopoulos J (2014). A systematic review and meta-analysis of eye-tracking studies in children with autism spectrum disorders. Social Neuroscience, 9(6), 610–632. [DOI] [PubMed] [Google Scholar]
- Schietecatte I, Roeyers H, & Warreyn P (2012). Can infants’ orientation to social stimuli predict later joint attention skills? British Journal of Developmental Psychology, 30, 267–282. [DOI] [PubMed] [Google Scholar]
- Senju A, & Csibra G (2008). Gaze following in human infants depend on communicative signals. Current Biology, 18, 668–671. [DOI] [PubMed] [Google Scholar]
- SensoMotoric Instruments. (2014). iView X™ System Manual: Version 2.8. Boston: Author. [Google Scholar]
- Shic F, Bradshaw J, Klin A, Scassellati B, & Chawarska K (2011). Limited activity monitoring in toddlers with autism spectrum disorder. Brain Research, 1380, 246–254. [DOI] [PMC free article] [PubMed] [Google Scholar]
- Shic F, Chawarska K, Bradshaw J, & Scassellati B (2008). Autism, eye-tracking, entropy. 2008 7th IEEE International Conference on Development and Learning, Monterey, CA, 2008, 73–78. [Google Scholar]
- Shic F, Macari S, & Chawarska K (2014). Speech disturbs face scanning in 6-monthold infants who develop autism spectrum disorder. Biological Psychiatry, 75(3), 231–237. [DOI] [PMC free article] [PubMed] [Google Scholar]
- Vansteenkiste P, Cardon G, Philippaerts R, & Lenoir M (2015). Measuring dwell time percentage from head-mounted eye-tracking data – comparison of a frame-by-frame and a fixation-by-fixation analysis. Ergonomics, 58(5), 712–721. [DOI] [PubMed] [Google Scholar]
- Venker CE, & Kover ST (2015). An open conversation on using eye-gaze methods in studies of neurodevelopmental disorders. Journal of Speech, Language, and Hearing Research, 58, 1719–1732. [DOI] [PMC free article] [PubMed] [Google Scholar]
- von Hofsten C, Uhlig H, Adell M, & Kochukhova O (2009). How children with autism look at events. Research in Autism Spectrum Disorder, 3, 556–569. [Google Scholar]
- Young GS, Merin N, Rogers S, & Ozonoff S (2009). Gaze behavior and affect at 6-months: predicting clinical outcomes and language development in typically developing infants and infants at-risk for autism. Developmental Science, 12(5), 798–814. [DOI] [PMC free article] [PubMed] [Google Scholar]
- Zwaigenbaum L, Bryson S, & Garon N (2013). Early identification of autism spectrum disorders. Behavioural Brain Research, 251, 133–146. [DOI] [PubMed] [Google Scholar]


