

Abstract
Laboratory executive function (EF) constructs, such as response inhibition, are often conceptually linked with self-report measures of impulsivity, yet their empirical correlations are low. We examined, in two twin studies (Ns=749 and 761 individuals with EF data), the phenotypic and genetic overlap of three EF latent variables (a Common EF factor predicting response inhibition, working memory updating, and mental set shifting tasks, and Updating- and Shifting-specific factors) with five impulsivity dimensions (negative and positive urgency, lack of premeditation and perseverance, and sensation seeking). In both samples, impulsivity dimensions only modestly correlated phenotypically (rs= −.20–.11) and genetically (rAs= −.44–.04) with Common EF. In both samples, Common EF and multiple impulsivity dimensions, particularly negative urgency, independently predicted Externalizing psychopathology, and multiple impulsivity dimensions, but not Common EF, predicted Internalizing psychopathology. These results suggest that EFs and self-reported impulsivity tap different aspects of control that are both relevant for psychopathology.
Keywords: Cognitive control, executive control, self-control, UPPS-P
The ability to control one’s thoughts and behaviors to achieve goals is an important individual difference that contributes to health and success (Moffitt et al., 2011). Aspects of this ability are measured with self-report questionnaires of self-regulation, self-control, and impulse control (impulsivity), and with laboratory behavioral tasks of impulsivity and executive functions (EFs), particularly response inhibition. Self-reports and tasks are often considered to assess a common construct (Hofmann, Schmeichel, & Baddeley, 2012), with some researchers suggesting that their common variance is key for predicting real-world behavior such as externalizing problems (Venables et al., 2018). Yet, accumulating evidence suggests that self-report and task measures of self-control and impulsivity have small correlations (Cyders & Coskunpinar, 2011; Duckworth & Kern, 2011; Harden et al., 2017; Sharma, Markon, & Clark, 2014; Stahl et al., 2014). Here, we evaluate several interpretations of these small correlations within the context of two large twin studies.
Interpretations of Low Correlations Between Self-reports and Tasks
One interpretation of these low correlations is that tasks and/or self-reports have low validity. Some argue that EF tasks have low ecological validity because they test control in highly structured environments (Barkley & Fischer, 2011); others argue that self-reports have low validity because individuals have poor insight into their control abilities (Necka, Lech, Sobczyk, & Śmieja, 2012).
A second interpretation is that they assess different constructs (Sharma et al., 2014; Toplak, West, & Stanovich, 2013). For example, as mentioned, EF tasks are given in controlled and structured environments, with goals clearly laid out in the instructions. In contrast, questionnaires ask about characteristic behavior in multiple contexts. Thus, EF tasks may measure optimal performance, whereas questionnaires may measure typical behavior (Sharma et al., 2014; Toplak et al., 2013). Some have suggested that both may be relevant for everyday behavior (Sharma et al., 2014), whereas others have suggested that self-reported control ability might be more relevant to outcomes associated with psychopathology, particularly attention-deficit/hyperactivity disorder (Barkley & Fischer, 2011).
A third interpretation is that domain-specific method variance masks commonality (Venables et al., 2018). In particular, EF tasks are known to be impure and sometimes unreliable measures, a problem alleviated with latent variables (Friedman & Miyake, 2017). For example, Venables et al. (2018) examined a hierarchical factor model of self-report and lab-based behavioral and neural measures of inhibitory control. Although the correlations of the self-report measures with the task scores were small (median r=.15), latent variables for self-report and lab-based measures loaded significantly on a higher-order cross-domain factor, and factor scores for this cross-domain factor predicted measures of externalizing psychopathology. However, these relations with the cross-domain factor scores may have been driven by the self-report factor: When they extracted separate factor scores for each domain, they found that externalizing psychopathology measures did not significantly relate to the task factor, but robustly related to the self-report factor.
A related possibility is that there are environmental differences between self-report and task measures, but they share genetic influences. A meta-analysis of impulsivity measures (both self-report and individual tasks) suggested a broad-sense heritability of .50, with no heterogeneity due to assessment method (Bezdjian, Baker, & Tuvblad, 2011). However, at the level of latent variables, individual differences in EFs are primarily genetic (Friedman et al., 2016), so EFs may show stronger relations with self-report measures at the genetic than the phenotypic level. That is, self-reported impulsivity and EF tasks may actually tap the same genetic variance, but differ environmentally.
Only a few studies have examined the link between task-based EF and questionnaire-based self-control constructs at the latent-variable and/or genetic levels. Necka, Gruszka, Orzechowski, Nowak, and Wójcik (2018) found no relation (r= −.01) between a self-control latent variable based on four questionnaires and an EF latent variable based on four tasks in an adult sample. Harden et al. (2017) found that a self-reported premeditation factor did not significantly correlate with a behavioral Cognitive Dyscontrol latent variable (which included a gambling task, delay discounting, and a tower planning task) at the phenotypic, genetic, or environmental levels in a sample of 13- to 20-year-old twins. In a sample of 7- to 15-year-old twins, Malanchini, Engelhardt, Grotzinger, Harden, and Tucker-Drob (2018) found small but significant correlations of a hierarchical Common EF factor (predicting inhibiting, switching, updating, and working memory factors) with an impulse control factor based on six questionnaire items (r= .25) and a conscientiousness factor (r= .27). Malanchini et al. also described the genetic and nonshared environmental relations of Common EF with impulse control and conscientiousness as not substantial, and found that both independently predicted academic achievement, controlling for fluid intelligence and processing speed. However, it remains to be seen whether these constructs show the same relation in an adult sample, and whether they independently predict psychopathology.
The Current Study
These interpretations have very different implications in terms of the theoretical and clinical utility of these measures, so deciding between them is of both academic and practical importance. Of course, these possibilities are not mutually exclusive, and more than one may explain the low correlations between self-reports and tasks. We investigate these explanations by leveraging two large twin samples with multiple EF latent variables, multiple impulsivity dimensions, and measures of psychopathology and substance use disorders, to answer three questions: 1) How do multiple EF components relate to impulsivity dimensions? 2) Do EFs and impulsivity dimensions show more commonality at the genetic level? And 3) do EFs and impulsivity dimensions predict independent variance in psychopathology?
The answers to these questions speak to whether EFs and impulsivity represent genetically distinct constructs, and if so, whether both are valid measures relevant for understanding behavioral problems. Specifically, by evaluating the phenotypic relations between multiple impulsivity and EF constructs (at the level of latent variables for the latter), question 1 comprehensively evaluates the possibility that self-reported impulsivity and laboratory EF tasks assess fundamentally different constructs. By extending this analysis to the genetic level, question 2 addresses the related possibility that different environmental influences mask similarities due to common genetic influences. And by testing whether impulsivity dimensions and EFs predict independent variance in psychopathology, question 3 addresses the possibility that self-reported impulsivity and EF tasks show low correlations because one or both have low validity. This last analysis also addresses another possibility: that even though self-reported impulsivity and EF tasks show low correlations, it is their common variance that predicts clinically relevant individual differences. That is, given that both impulsivity and EFs are related to psychopathology (Berg, Latzman, Bliwise, & Lilienfeld, 2015; Friedman & Miyake, 2017), examining their relations in the context of internalizing and externalizing psychopathology allows us to examine their convergent and discriminant validity.
We focus on impulsivity because it is a frequently examined construct across different domains of psychology that has been shown to be relevant for important outcomes such as psychopathology and substance use (e.g., Berg et al., 2015; Dick et al., 2010; Sharma et al., 2014), as have EFs (Snyder, Miyake, & Hankin, 2015). Although impulsivity is multidimensional (Evenden, 1999), it can generally be defined as the tendency to act without premeditation and without control. As such, it has clear conceptual links to the general definition of EFs as processes that enable individuals to control their thoughts and actions in the service of goals (Friedman & Miyake, 2017). Indeed, Nigg (2017) defined impulsivity as mediated by top-down EF processes of goal-directed attention and response inhibition, in addition to bottom-up reward-related processes, and Bickel, Jarmolowicz, Mueller, Gatchalian, and McClure (2012) reviewed evidence that impulsivity and EF dysfunction are associated with the same brain regions. Thus, the notion that EFs and impulsivity are closely related (perhaps even antipodes, meaning that they should be strongly negatively correlated; Bickel et al., 2012) is common in the literature.
Measures.
Impulsivity is a term used to describe a number of behaviorally and neuropsychologically separable factors (Evenden, 1999), and the measure of impulsivity we use recognizes this multidimensionality. The UPPS-P Impulsive Behavior Scale (Lynam, Whiteside, Smith, & Cyders, 2006) was developed to integrate numerous models into a single instrument; it samples items from other impulsivity questionnaires and personality inventories to create five subscales: positive urgency, negative urgency, (lack of) premeditation, (lack of) perseverance, and sensation seeking. These five dimensions differentially predict psychopathology and personality (Berg et al., 2015; Gustavson et al., 2019) and may also differentially involve the EFs examined in this study (Hofmann et al., 2012).
EFs are also multidimensional (Friedman & Miyake, 2017). When the most commonly studied EFs (response inhibition, working memory updating/maintenance, and mental set switching) are measured as latent variables, they show both unity (they moderately correlate), and diversity (those correlations are not 1.0). In our bifactor model (Figure 1), the unity is directly captured with a Common EF latent variable predicting all EF tasks, and the diversity is captured with orthogonal Updating-specific and Shifting-specific latent variables that capture remaining covariance among the updating and shifting tasks, respectively. Results from several independent datasets suggest that the Common EF factor captures all the covariance among the response inhibition tasks, so there is no inhibiting-specific factor; i.e., Common EF is isomorphic with inhibiting (Friedman & Miyake, 2017). In one of the samples used in the current study, we have found that lower Common EF ability, but not lower Updating-specific or Shifting-specific ability, is related to higher levels of behavioral problems and psychopathology, including both internalizing and externalizing problems (Friedman & Miyake, 2017; Friedman, duPont, Corley, & Hewitt, 2018; Gustavson, Stallings, et al., 2017b; Hatoum, Rhee, Corley, Hewitt, & Friedman, 2018).
Figure 1.
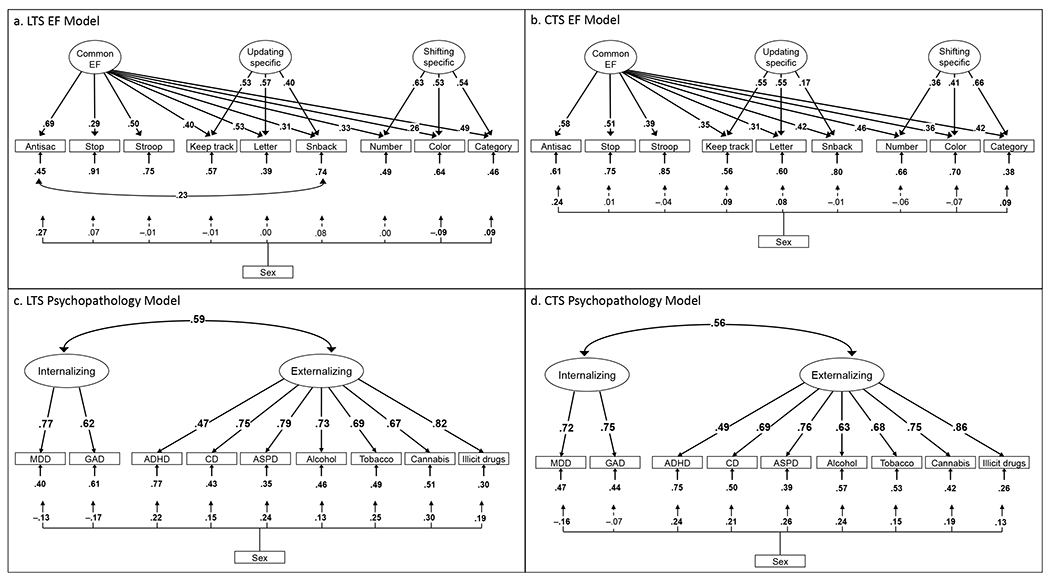
Longitudinal Twin Study (LTS) and Community Twin Sample (CTS) confirmatory factor analysis models of executive functions (EFs, Panels a and b; N=749 for LTS and N=761 for CTS) and psychopathology (Panels c and d; N=763 for LTS and N=1743 for CTS). Numbers on arrows are standardized factor loadings, those under the smaller arrows are residual variances, and the one on the curved double-headed arrow is a residual correlation. Numbers on arrows from sex variable are standardized paths from a categorical sex variable (males higher) predicting the indicators. Antisac=antisaccade, Stop=stop-signal, Letter=letter memory, Snback=spatial n-back, Number=number-letter, Color=color–shape, Category=category-switch; MDD=major depressive disorder; GAD=generalized anxiety disorder; ADHD=attention-deficit/hyperactivity disorder; CD=conduct disorder; ASPD=antisocial personality disorder. Boldface type and solid lines indicate p<.05, corrected for nonindependence of twin pairs; dashed lines indicate p>.05.
Predictions.
Common EF is thought to capture individual differences in the ability to actively maintain goals and use them to bias lower-level processing, which is necessary for success on all EF tasks and may be particularly important in the context of stimuli with prepotent responses (as in the inhibition tasks; Friedman & Miyake, 2017). As such, we expect that Common EF will be the EF most consistently negatively related to impulsivity, particularly urgency and lack of premeditation. Updating-specific is thought to tap individual differences in the accuracy of gating working memory; we do not expect this factor to relate to impulsivity. Shifting-specific is thought to capture the speed with which no-longer relevant goals can be cleared from working memory. In our prior work, it sometimes shows a trade-off with Common EF, such that behaviors that negatively relate to Common EF, like attention problems and poor self-restraint, positively relate to Shifting-specific (Herd et al., 2014). This trade-off may occur because poor goal maintenance and implementation of one goal makes shifting to a new goal easier. Thus, we expected that if Shifting-specific is related to impulsivity, those relations would be positive.
Sensation seeking is the most different dimension of impulsivity, both in terms of its weak or negative associations with the other UPPS-P subscales and its differential associations with external constructs (e.g., Berg et al., 2015; Harden et al., 2017; MacKillop et al., 2016). This differentiation is consistent with dual-systems conceptions in which bottom-up reward-related processes are separable from top-down control processes (Shulman et al., 2016). Thus, we do not expect it to negatively relate to EFs; moreover, sensation seeking sometimes shows positive correlations with general cognitive ability (Harden et al., 2017), so we may find positive associations with Common EF and Updating-specific, which are both related to intelligence (Friedman & Miyake, 2017).
Method
To ascertain the robustness of our results, we conduct parallel analyses in two twin samples. The Colorado Longitudinal Twin Study (LTS) participants were followed from birth, with EFs assessed in late adolescence and early adulthood; we focus on the adult EF (age 23) assessment, as it was completed at the same time as the UPPS-P and psychopathology/substance use interviews.1
The Community Twin Sample (CTS) was followed longitudinally beginning at ages 12-19 with measures of substance use and psychopathology behavior. A subsample selected to be enriched for externalizing behaviors was tested on EFs at mean age 21. CTS participants completed the UPPS-P scale and psychopathology/substance use interviews at a separate wave of assessment at mean age 27. Although these samples differ somewhat in ascertainment and age, they completed measures of the same constructs in adulthood, allowing us to examine the robustness of our results.
Participants
All research protocols were reviewed and approved by the University of Colorado’s Institutional Review Board. Informed consent was obtained from each participant at each assessment.
LTS.
Participants were 765 individual twins (403 female) from the ongoing LTS with data for EFs (n=749), impulsivity (n=755), and/or psychopathology and substance use disorder symptoms (n=763) during young adulthood. These individuals were from 393 same-sex twin pairs (210 monozygotic [MZ] and 183 dizygotic [DZ]), though data were included for 21 individuals whose co-twins did not provide data. The LTS includes families identified by the Colorado Department of Health’s Division of Vital Statistics as having same-sex twins born between 1984 and 1990 (Rhea, Gross, Haberstick, & Corley, 2006); these twins have been included in a number of studies of emotional and cognitive development, beginning when they were age 14 months and continuing through the present day (as they are entering their 30’s). The data for the current study include psychopathology measures collected at the third wave of a three-wave study conducted by the Center for Antisocial Drug Dependence (CADD) at the University of Colorado, and EF measures collected during a separate study run concurrently. The EF tasks, online impulsivity questionnaire, and telephone diagnostic interviews were completed in separate testing sessions at mean age 22.8 years (SD=1.3, range=21.1 to 28.0), typically within a 3-week period (the largest mean age difference between sessions was for the in-person EF and telephone interview assessments: M=0.05 years, SD=0.2, range= −0.90 to 3.35). The sample was 92.3% White, 1.0% American Indian, 0.3% Native Hawaiian/Pacific Islander, 5.2% multiracial, and 1.2% unknown/not reported; 9.2% were Hispanic. Zygosity was determined through repeated tester ratings combined with genotyping.
CTS.
Participants were 1784 individual twins (976 female) from the CTS with data for EFs (n=761), impulsivity (n=1691), and/or psychopathology and substance use disorder symptoms (n=1743) during young adulthood. These individuals were from 935 families (433 MZ, 244 same-sex DZ, and 258 opposite-sex DZ), though data were included for 88 individuals whose co-twins did not provide data, as well as 2 individuals who were triplets of pairs in the sample (these 2 individuals were not included in the twin analyses). Of these 1784 participants, 761 had EF data (402 female; from 199 MZ, 92 same-sex DZ, and 101 opposite-sex DZ families; 25 individuals’ co-twins did not have EF data, and 2 individuals were triplets). The full sample of 1784 individuals was 84.9% White, 2.0% Black/African American, 1.7% Asian, 1.0% American Indian, 0.1% Native Hawaiian/Pacific Islander, 8.4% multiracial, and 2.0% unknown/not reported; 9.4% were Hispanic. Zygosity was determined through repeated tester ratings combined with genotyping.
The CTS includes families identified by the Colorado Department of Health’s Division of Vital Statistics as having twins born after 1982 (Rhea et al., 2006); twins who were between 12 and 18 years of age were enrolled in the first wave of the CADD until a criterion of 1002 pairs was reached. The data for the current study include UPPS-P, psychopathology, and substance use disorder measures collected at the third wave of the CADD, and EF measures collected during a separate study run concurrently with the second wave of the CADD (approximately 5.5 years earlier). The online impulsivity questionnaire and telephone diagnostic interviews were completed in separate testing sessions at mean age 26.7 years (SD=2.3, range=21.3 to 34.7), typically within a 1-week period. The in-person EF testing was completed at mean age 21.0 years (SD=1.7, range=17.6 to 25.4). The 761 individuals who completed the EF assessment were tested as part of a separate study of EFs and behavioral disinhibition. Specifically, 612 individuals were tested from 307 pairs in which at least one member of the pair reported substance use or at least one DSM-IV ADHD or CD symptom at CADD wave 1 (at age 12 to 18). An additional 149 individuals were tested from 73 families in which neither twin reported any of these symptoms at the first wave of the CADD.
Measures
EF tasks.
Participants completed nine computerized tasks designed to assess response inhibition, working memory updating, or mental set shifting. The versions of the tasks differed slightly across samples. The LTS measures were the “Wave 2” EF battery (Friedman et al., 2016), whereas the CTS measures were the “Wave 1” battery. The changes from Wave 1 to Wave 2 were designed to improve variability and reliability while maintaining the key task requirements. Because task methods were fully described in a prior publication (Friedman et al., 2016), we do not reproduce all details here, but briefly describe the key requirements of the tasks below. Descriptive statistics and reliability information for both samples are presented in supplementary Table S1.
Inhibiting.
The three response inhibition tasks required participants to avoid dominant or automatic responses. In the antisaccade task, participants saw a cue flash on one side of the screen and had to look in the opposite direction (overriding the tendency to saccade to the cue) in time to see a target stimulus before it was masked (dependent measure [DM]: accuracy of target identification). In the stop-signal task, participants performed a well-practiced two-choice categorization, but had to withhold the response on 25% of trials during which a signal occurred (DM: stop-signal reaction time). In the Stroop task, participants named the font colors of strings of asterisks or color words rather than reading the words (DM: mean response time [RT] on incongruent word trials minus mean RT on asterisk trials).
Updating.
The three updating tasks required participants to continuously add and delete information in working memory. In each trial of the keep-track task, participants saw a series of words from 6 categories and had to remember the most recently presented words belonging to 2 to 5 target categories (DM: accuracy of recalling target words). In the letter memory task, participants saw series of letters that were unpredictable in length, and had to continuously rehearse aloud the last 4 letters they had seen (DM: accuracy of rehearsal). In the spatial n-back task, participants saw 12 squares on the screen that flashed one at a time, and after each flash, indicated whether it was the same location that flashed n-trials (either 2 or 3 trials) before (DM: accuracy of both yes and no responses across the 2-back and 3-back conditions).
Shifting.
The three set shifting tasks required participants to switch between two subtasks that used the same two button-box responses, according to a cue that appeared just before the stimulus and remained on the screen with the stimulus until they responded. Half the trials required repeating the task from the prior trial, and half required switching tasks (DM for all three tasks was the local switch cost: the average RT for switch trials minus the average RT for repeat trials within mixed blocks). In the number–letter task, participants categorized the number in a number-letter pair as even or odd, or the letter as a consonant or vowel, depending on the location on the screen (top or bottom). In the color–shape task, participants categorized the color of a shape on a colored square as red or green, or the shape as circle or triangle, depending on a cue letter (C or S) that appeared above it. In the category-switch task, participants categorized a word as describing something that is smaller or bigger than a soccer ball, or living or nonliving, depending on a cue symbol (crossed arrows or heart) that appeared above it.
Impulsivity.
Impulsivity was assessed with 35 of the 59 items of the UPPS-P Impulsive Behavior Scale (Lynam et al., 2006), condensed to accommodate time restrictions. This shorted UPPS-P scale included five subscales: 7 items assessing negative urgency (e.g., When I am upset I often act without thinking), 7 items assessing positive urgency (e.g., When I am really ecstatic, I tend to get out of control), 8 items assessing lack of premeditation (e.g., I usually think carefully before doing anything), 6 items assessing lack of perseverance (e.g., I tend to give up easily), and 7 items assessing sensation seeking (e.g., I quite enjoy taking risk). Participants rated each item on a scale of 1 to 4 (disagree strongly, disagree some, agree some, and agree strongly), and before scoring, relevant items were reversed so that higher values indicated greater impulsivity.
Psychopathology and Substance Use Disorder Symptoms.
Psychopathology and substance use disorder symptoms were assessed via phone interviews. Lifetime symptoms of major depressive disorder (MDD), generalized anxiety disorder (GAD), attention-deficit/hyperactivity disorder (ADHD), conduct disorder (CD), and antisocial personality disorder (ASPD) were obtained with the respective modules of the Diagnostic Interview Schedule (DIS; Robins et al., 2000), a structured clinical interview based on the diagnostic criteria found in the fourth edition of the Diagnostic and Statistical Manual of Mental Disorders (American Psychological Association, 1994). Lifetime substance abuse and dependence symptoms were obtained with a computerized administration of the Composite International Diagnostic Interview-Substance Abuse Module (CIDI-SAM; Cottler, Robins, & Helzer, 1989) for 11 substances (tobacco, alcohol, cannabis, cocaine, hallucinogens, inhalants, opioids, PCP, sedatives, amphetamines, and club drugs). These data were used to create four symptom count variables: (a) alcohol, (b) tobacco, (c) cannabis, and (d) illicit substances, using the substance with the highest number of symptoms endorsed across all illicit substances used by a given individual.
Diagnosis and symptom count variables are not normally distributed, so we created ordinal symptom count variables and estimated the underlying liability based on the frequencies within each category (i.e., a threshold model), which decreases the potential for biased parameter estimates compared to other potential transformations of such skewed symptom count data (Derks, Dolan, & Boomsma, 2004). We used the same bins we have used in prior work (Gustavson, du Pont, et al., 2017a). Specifically, for MDD, GAD, ADHD, CD, ASPD, and tobacco dependence: 0=no symptoms; 1=symptoms but no diagnosis; 2=diagnosis according to DSM–IV criteria, except for diagnosis of ASPD, which did not include the criterion for evidence of CD before age 15. For the substance use variables (except tobacco, which does not include abuse symptoms), we added abuse and dependence symptoms and considered more levels of severity when possible, which is more consistent with DSM-V. For alcohol, 0=no symptoms; 1=1 symptom; 2=2-3 symptoms; 3=4-5 symptoms; 4=6 or more symptoms. For cannabis, 0=no symptoms; 1=1 symptoms; 2=2 or more symptoms. For illicit drugs, 0=no symptoms; 1=1 or more symptoms for the illicit drug with the highest number of symptoms. There were fewer bins for cannabis and illicit substances because of the relatively low endorsement.
Statistical Analysis
Missing data.
Of the 749 LTS and 761 CTS participants with usable EF data, 30 LTS and 91 CTS participants were missing data for one or more EF tasks because of color blindness, equipment malfunction, failure to understand or follow task instructions, or chance-level accuracy. Where appropriate (i.e., for the antisaccade, stop-signal, n-back, and shifting tasks), the criterion for chance performance for each task was calculated as the binomial probability that the participant would have obtained that score by chance, with p<.01. An additional 2 LTS participants’ EF data were unusable because one had problems completing the tasks due to brain surgery and the other fell asleep during multiple tasks; and an additional 6 CTS participants’ EF data were excluded because they had a history of brain injury (n=2), or the participants’ data were suspect because of repeated chance-level performance (on at least four individual tasks; n=2), clear fatigue (n=1), or evidence of marijuana use that day (n=1).
Data transformation and trimming.
EF data trimming and transformation were identical to those used in all prior publications (Friedman et al., 2016). Specifically, for the CTS EF tasks, which were identical to the Wave 1 LTS tasks, we used the arcsine of the proportion correct for all accuracy measures, which showed evidence of ceiling effects. For the LTS Wave 2 data, an arcsine transformation was only needed for the spatial 2-back and 3-back accuracy measures. RT measures depending on mean RTs (all except stop signal) were subjected to within-subject trimming robust to nonnormality (Wilcox & Keselman, 2003) to obtain the best measures of central tendency. RTs for error trials and RTs<200 ms were eliminated, and for the three shifting tasks, RTs for trial following errors were also eliminated (because the correct set might not have been achieved on the previous trial, making it ambiguous whether the current trial was a switch or repeat trial). To reduce the influence of extreme scores at the between-subject level, we replaced observations farther than 3 SDs from the group mean with values 3 SDs from the mean. This procedure affected no more than 2% of the observations for any measure in either sample. Average accuracy was greater than 92% in all RT tasks in both samples. After these transformations and trimming, the variables showed acceptable skewness and kurtosis (see supplementary Table S1). The data for the UPPS-P scales were reasonably normally distributed without transformation or trimming. In all analyses, the directionality of the RT measures was reversed so that for all measures, higher scores indicated better performance.
Model estimation and parameterization.
Structural equation modeling was conducted using Mplus 8.1 (Muthén & Muthén, 2017). All analyses were conducted on raw data, rescaled to avoid ill-scaled covariance matrices.
Phenotypic models used the TYPE=COMPLEX option to cluster data by family, which uses a weighted likelihood function and a sandwich estimator to obtain a scaled chi-square (χ2) and standard errors corrected for non-independence; prior studies demonstrate that it adequately corrects for nonindependence of twin data (Rebollo, De Moor, Dolan, & Boomsma, 2006).
Models without the ordinal psychopathology and substance use disorder variables used full-information maximum likelihood, which treats missing data as missing at random and uses all available data to compute parameter estimates. Models with the ordinal measures used the means and variance adjusted weighted least squares (WLSMV) estimation method, for which the only missing data option in Mplus is pairwise deletion. We supplemented the χ2 with the comparative fit index (CFI) and the root mean square error of approximation (RMSEA). A CFI>.95 and RMSEA<.06 indicate good fit (Hu & Bentler, 1998). Parameter significance was determined with standard errors for phenotypic models, but chi-square difference (Δχ2) tests for genetic models, as standard errors in genetic models are not invariant to model parameterization whereas difference tests are (Neale, Heath, Hewitt, Eaves, & Fulker, 1989).
Correction for multiple testing.
In our effort to comprehensively assess the phenotypic and genetic/environmental relations between EFs and impulsivity dimensions, we conduct many tests across two independent samples. One option to reduce false positives is a simple Bonferroni correction for the number of primary phenotypic tests: for relations of EFs to impulsivity dimensions, 5 impulsivity scales x 3 EF factors=15 tests, leading to an adjusted alpha of .0033 in each sample; for relations of psychopathology factors to EFs and impulsivity dimensions, 5 impulsivity scales+3 EF factors=8 tests per correlated psychopathology factor, leading to an adjusted alpha of .00625 in each sample. However, this correction may be too conservative for three reasons: First, as reviewed earlier, most of the phenotypic associations we investigate have already been supported in existing meta-analyses. (The twin models merely decompose those associations into genetic and environmental components, so we do not consider those to be independent tests.) Second, given the very small correlations between EFs and impulsivity scales in these meta-analyses, our focus is on understanding why these correlations are small; lowering the alpha increases the chance of false negatives. Third, we report the same analyses for two independent samples, so we can directly assess which associations replicate rather than relying only on p-values.
Given these considerations, we took the following approach to correcting for multiple testing for the primary tests: 1) we report significance both in terms of nominal (alpha=.05) and Bonferroni-corrected thresholds (alpha=.0033 for relations of EFs to impulsivity dimensions [15 tests per sample]; alpha=.00625 for relations of psychopathology to EFs and impulsivity dimensions [8 tests per sample]) so that readers can decide which thresholds they prefer; and 2) we focus our discussion on associations that are at least nominally significant across both samples. We maintain a standard alpha of .05 for other tests that are incidental to the primary tests (e.g., significance of ACE variances).
Phenotypic models.
All models included sex as a covariate that was allowed to predict all indicators, significant or not. The EF model was identical to that presented in prior studies, except that each task was regressed on sex within the model (see Figure 1). In the LTS sample, as well as an independent sample of adults completing these tasks (Ito et al., 2015), a residual correlation between antisaccade and spatial n-back was found to improve model fit, perhaps because both of these tasks involve rapid eye movements between spatial locations on the screen. This residual correlation has been included in all publications using these data because in addition to improving fit, it aids convergence for genetic models (where it is modeled as a residual genetic correlation); its inclusion has little influence on correlations between the EF constructs and other measures of interest. The LTS Wave 1 model does not include this residual correlation (Friedman et al., 2016), so we do not include it in the CTS EF model, which used the same EF battery.
Age was unrelated to the UPPS-P scales in the LTS (standardized β= −.07 to .04, all p>.118) and showed similar effects sizes for the UPPS-P scales in the CTS (standardized β= −.09 to .03, p=.001 to .913), though two associations (positive urgency and sensation seeking) reached significance in CTS given the large sample size. Age was inconsistently related to EF task performance in LTS (Friedman et al., 2016), and showed only one statistically significant association in CTS (with spatial n-back, standardized β= .12, p=.004). Age was also inconsistently related to the psychopathology and substance use variables (standardized β= .03 to .17, ps= .000 to .472 in LTS, and standardized β= .01 to .10, ps= .001 to .875 in CTS), with significant relations of age to MDD, CD, ASPD, alcohol, and tobacco in LTS, and with ASPD, alcohol, and tobacco in the CTS. Given these small effects and inconsistent relations across measures and samples, age was not included as a covariate in the current study.
Twin models.
Standard twin models decompose a measure’s variance into three components: additive genetic (A) influences, which represent the sum of additive effects of large number of genetic variants; shared environmental (C) influences, which lead individuals raised together to be similar; and nonshared environmental (E) influences, which lead individuals raised together to be uncorrelated. The A factors correlate 1.0 in MZ twins, because they share 100% of their alleles, but 0.5 for DZ twins because on average they share 50% of their alleles identical by descent. The C factors correlate 1.0 for both MZ and DZ twins, because both types are reared together. The E factors do not correlate across twins, by definition.
Twins were randomly assigned to twin1 and twin2 for the genetic models, using the same random assignment used in all prior studies using the LTS EF data (Friedman et al., 2016). In the CTS, twins were randomly assigned to twin1 and twin2 for the genetic models, except that for opposite-sex DZ pairs, twin1 was the male. The opposite-sex and same-sex DZ twins were included in one DZ group, as there were not enough of each type to examine sex-limitation models. Sex was phenotypically regressed out of the continuous indicators and included as a covariate of ordinal psychopathology indicators in the genetic models.
Genetic and environmental relations between EFs and the impulsivity scales were modeled with a series of Cholesky decompositions, shown in supplementary Figure S12. Note that because the EF factors are orthogonal to each other, there are no genetic or environmental paths between different EF factors, but each was allowed to predict impulsivity. Specifically, each EF’s variance was decomposed into genetic (A), shared environmental (C), and nonshared environmental (E) variances; variance explained is obtained by squaring the paths from these variables (e.g., aEF, cEF, and eEF for Common EF). The EF ACE variance components that were not zero or close to zero were allowed to also predict variance in the UPPS-P scale (paths a1-e3), and the remaining variance in the UPPS-P scale was decomposed into genetic and environmental sources (paths a4 and e4). Relations of variance components that were close to zero (i.e., C components for EFs in LTS and CTS and the E component for Updating-Specific in LTS) were not modeled, as they could not account for much covariance and removing them increased power for the remaining variance components. To aid model convergence, we did not include specific C components for the EF tasks, which were close to zero and did not reduce model fit when dropped in the LTS sample, Δχ2(9)=0.76, p>.999, and the CTS sample, Δχ2(9)=0.27, p>.999. Similar Cholesky decompositions were used to obtain genetic and environmental correlations of the psychopathology factors with UPPS-P scales (five models per sample) and EFs (one model per sample).
In a standardized solution, the genetic correlation (rA) between Common EF and the UPPS-P scale can be derived as follows: (a1*aEF)/sqrt(aEF2*(a12+a42)); other genetic and nonshared environmental (rE) correlations are obtained with analogous formulas. We derived these variables with the Mplus Model Constraint command to obtain confidence intervals. The phenotypic correlations due to these genetic and environmental correlations (bivariate heritability and environmentality) are the numerators of these equations: aEF*a1 and eEF*e1, and the sum of the bivariate heritability and environmentality provides an estimate of the phenotypic correlation.
Results and Discussion
Preliminary analyses
Measurement models for EFs and psychopathology.
Descriptive statistics for the EF tasks and UPPS-P scales for the LTS and CTS samples are presented in supplementary Table S1. Frequencies for the psychopathology and substance use disorder binned variables are available in supplementary Table S2. Zero-order correlations for all measures are available in supplementary Table S3.
Figure 1 depicts the measurement models for the EF and psychopathology and substance use disorder data in the LTS and CTS. Figure 1a depicts the LTS EF bifactor model, χ2(20)=39.59, p=.006, CFI=.983, RMSEA=.036, which is identical to that presented in prior studies (Friedman et al., 2016), except that each task was regressed on sex within the model. Figure 1b depicts the CTS EF bifactor model. χ2(22)=65.18, p<.001, CFI=.950, RMSEA=.051. Alternative models with correlated Inhibiting, Updating, and Shifting factors for each sample are shown in supplementary Figure S2.3
Consistent with prior literature (e.g., Caspi et al., 2014), the psychopathology and substance use disorder measures clustered into correlated Internalizing and Externalizing factors, as shown in Figure 1c for LTS, χ2(26)=45.70, p=.010, CFI=.991, RMSEA=.032, and Figure 1d for CTS, χ2(26)=115.13, p<.001, CFI= 983, RMSEA=.044. Although the chi-square for the CTS model was large, the sample size for these measures (N=1743) was over twice that in the LTS model, and the RMSEA and CFI both indicated good fit. The factor loadings and factor correlations were very similar across samples.
Genetic models for impulsivity and EFs.
Univariate ACE models for the UPPS-P scales in both samples and the EF tasks in the CTS are available in supplementary Table S4. In the LTS, heritability was moderate and significant for positive urgency, negative urgency, lack of premeditation, and lack of perseverance (a2=27% to 44%), all Δχ2(1)>6.88, ps< 009, but heritability for sensation seeking did not reach significance (a2=29%), Δχ2(1)=3.07, p=.080. In the CTS, heritability was moderate and significant for positive urgency, negative urgency, lack of premeditation, and sensation seeking (a2= 30% to 45%), all Δχ2(1)>5.19, ps<023, but heritability for lack of perseverance was not significant (a2= 21%), Δχ2(1)=2.53, p=.112, In both samples, shared environmental variance was not significant for any scale, and estimated at zero for all but sensation seeking in the LTS (c2=16%), Δχ2(1)=1.26, p=.262, and positive urgency and lack of perseverance in the CTS (c2=4% to 7%), both Δχ2(1)<0.45, ps>.503. Nonshared environmental variance, which includes measurement error for these manifest variables, was moderate (e2=55% to 72%).
Supplementary Figure S3 depicts the genetic EF models for both samples. The LTS genetic model for EFs with sex regressed out of all tasks, χ2(320)=419.80, p<.001, CFI=.945, RMSEA=.040, was almost identical to the model without sex regressed reported by (Friedman et al., 2016). The CTS genetic model for EFs with sex regressed out of all tasks, χ2(322)=380.74, p=.013, CFI=.952, RMSEA=.031, was quite similar to the LTS model. Specifically, these data replicated the high heritability of the EF latent variables, (a2=82% to 86%), all Δχ2(1)>7.88, ps<.006, as well as the finding that the unity and diversity of EFs is primarily genetic in origin (Friedman et al., 2008): The Updating-specific and Shifting-specific factors each showed significant genetic influences that were independent of those for the Common EF factor. Moreover, like the LTS young adult model, Common EF in the CTS young adults showed small but significant nonshared environmental influences at the latent level (e2=17%), Δχ2(1)=13.59, p=.002, whereas Updating-specific did not show significant nonshared environmental influences (e2=14%), Δχ2(1)= 1.61, p=.205. However, nonshared environmental influences for Shifting-specific, which were significant in LTS, did not reach significance in CTS (e2=18%), Δχ2(1)=2.52, p=.113, Shared environmental influences were estimated at zero for all three latent variables.
Question 1: How do multiple EF components relate to impulsivity dimensions?
Table 1 shows correlations of the EF latent variables and the UPPS-P subscale manifest variables4 in each sample. In the LTS, χ2(50)=78.29, p=.006, CFI=.985, RMSEA=.027, no correlations of EFs with impulsivity scales were significant after multiple testing correction (p>.0033), though Common EF showed nominally significant negative correlations with positive urgency, lack of premeditation, and lack of perseverance (r= −.10 to −.13, p<.036), and a nominally significant positive correlation with sensation seeking (r=.11, p=.029). In the CTS, χ2(52)=113.90, p<001, CFI=.977, RMSEA=.026, Common EF showed small negative correlations with positive urgency and negative urgency (r=−.20, p< 002), which were significant after multiple testing correction, and a nominally significant correlation with lack of premeditation (r=−.13, p=.019).
Table 1.
Correlations of EF Latent Variables with UPPS-P Scales in the LTS and CTS
| Variable | 1 | 2 | 3 | 4 | 5 | 6 | 7 | 8 |
|---|---|---|---|---|---|---|---|---|
| A. LTS | ||||||||
| 1. Common EF | ||||||||
| 2. Updating-specific | -- | |||||||
| 3. Shifting-specific | -- | -- | ||||||
| 4. Positive Urgency | −.10* [−.20, −.01] | −.14* [−.25, −.03] | .09 [−.01, .20] | |||||
| 5. Negative Urgency | −.07 [−.17, .02] | −.10 [−.21, .02] | .00 [−.09, .09] | .61** [.55, .66] | ||||
| 6. Lack of Premeditation | −.10* [−.19, −.01] | .05 [−.06, .16] | .05 [−.06, .16] | .34** [.27, .42] | .32** [.24, .39] | |||
| 7. Lack of Perseverance | −.13* [−.22, −.03] | .09 [−.03, .20] | .02 [−.09, .13] | .31** [.24, .38] | .32** [.25, .39] | 39** [.33, .46] | ||
| 8. Sensation Seeking | .11* [.01, .21] | .00 [−.12, .11] | −.11* [−.22, −.01] | 19** [.13, .26] | .08* [.01, .15] | .18** [.10, .25] | −.10* [−.18, −.02] | |
| B. CTS | ||||||||
| 1. Common EF | ||||||||
| 2. Updating-specific | -- | |||||||
| 3. Shifting-specific | -- | -- | ||||||
| 4. Positive Urgency | −20** [−.33, −.08] | −.01 [−.14, .13] | .09 [−.03, .22] | |||||
| 5. Negative Urgency | −.20** [−.31, −.08] | .03 [−.09, .15] | .04 [−.08, .16] | .61** [.58, .64] | ||||
| 6. Lack of Premeditation | −.13* [−.24, −.02] | .03 [−.11, .16] | .18** [.06, .30] | .35** [.30, .39] | .33** [.28, .38] | |||
| 7. Lack of Perseverance | −.01 [−.11, .08] | .00 [−.12, .12] | .15* [.04, .27] | .33** [.28, .38] | .31** [.27, .36] | .36** [.31, .41] | ||
| 8. Sensation Seeking | .11 [−.01, .22] | .03 [−.10, .16] | .03 [−.10, .16] | .22** [.17, .27] | .04 [−.01, .09] | 17** [.11, .22] | −.08** [−.13, −.03] |
Note. Partial correlations, controlling for sex, from confirmatory factor analysis models in the Longitudinal Twin Study (LTS) and Community Twin Sample (CTS); total N=760 for LTS and total N=1743, N=761 for EF battery for CTS. Numbers in brackets are 95% confidence intervals. Executive function (EF) variables were latent variables modeled as shown in Figure S2, and UPPS-P scales were manifest variables. All EF tasks and UPPS-P scales were regressed on sex. Dashes indicate no correlations among orthogonal EF factors.
p<05 and
p<.0033, adjusted for non-independence of twin pairs.
Boldface type indicates p<.05 in both samples.
Across both samples, Common EF showed nominally significant negative correlations with positive urgency and lack of premeditation. Although the magnitude and direction of Common EF’s correlation with sensation seeking in the CTS was the same as that observed in LTS, it did not reach nominal significance in CTS (r=.11, p=.067).
In both samples, Updating-specific ability was largely unrelated to impulsivity, with no correlations significant correlations after multiple testing correction, and no correlations that were nominally significant in both samples. Shifting-specific ability also showed few consistent relations to impulsivity, with only one correlation (with lack of premeditation, r=.18, p=.003) in CTS significant after multiple testing correction, and no correlations that were nominally significant in both samples.
Answer. Considering results across both samples, the answer to question 1 is as follows: EFs and impulsivity dimensions tap largely distinct constructs, with only small correlations. Common EF is slightly negatively related to urgency and lack of premeditation. Shifting-specific and Updating-specific abilities are not consistently related to impulsivity.
Question 2: Do EFs and impulsivity show more commonality at the genetic level?
Table 2 presents the genetic and nonshared environmental correlations (rA and rE) between each UPPS-P subscale and EF latent variable. The table also shows bivariate heritability and environmentality, which quantify the phenotypic correlations due to these A and E correlations. These sum to the total predicted phenotypic correlation and can be used to characterize the proportion of the phenotypic correlation due to genetic and environmental covariance, although we do not discuss these values in detail. All models fit acceptably, all LTS χ2(402)<512.14, ps>.002, CFIs>.940, RMSEAs< 038; all CTS χ2(403)<482.68, ps>.003, CFIs>.939, RMSEAs<022.
Table 2.
Genetic and Nonshared Environmental Correlations of EF Latent Variables and UPPS-P Scales in the LTS and CTS
| LTS Common EF A=80%*, C= 4%, E=16%* |
LTS Updating-specific A=99%*, C= 0%, E=1% |
LTS Shifting-specific A=79%*, C=0%, E=21%* |
||||||||||
|---|---|---|---|---|---|---|---|---|---|---|---|---|
| LTS UPPS-P Scale | rA | rE | Biv A | Biv E | rA | rE | Biv A | Biv E | rA | rE | Biv A | Biv E |
| 1. Positive Urgency A=32%*, C= 0%, E=68%* |
−.07 [−.29, .15] | −.22* [−.44, −.01] | −.04 | −.07* | −.24* [−.43, −.06] | -- | −.14* | -- | .14 [−.10, .38] | .08 [−.17, .33] | .07 | .03 |
| 2. Negative Urgency A=40%*, C= 0%, E=60%* |
.02 [−.19, .23] | −.27* [−.48, −.06] | .01 | −.08* | −.18* [−.35, .00] | -- | −.11* | -- | −.07 [−.29, .15] | .12 [−.13, .38] | −.04 | .04 |
| 3. Lack of Premeditation A=27%*, C= 0%, E=73%* |
−.16 [−.42, .09] | −.04 [−.26, .19] | −.07 | −.01 | .05 [−.15, .26] | -- | .03 | -- | −.02 [−.29, .25] | .12 [−.14, .38] | −.01 | .05 |
| 4. Lack of Perseverance A=44%*, C= 0%, E=56%* |
−.15 [−.35, .06] | −.14 [−.36, .08] | −.08 | −.04 | .11 [−.06, .27] | -- | .07 | -- | −.01 [−.22, .20] | .06 [−.20, .32] | −.01 | .02 |
| 5. Sensation Seeking A=29%, C= 16%, E=55%* |
.15 [−.10, .39] | .20 [−.01, .41] | .07 | .06 | −.05 [−.26, .17] | -- | −.02 | -- | −.25 [−.55, .05] | −.02 [−.27, .23] | −.12 | −.01 |
| CTS Common EF A=83%*, C= 0%, E=17%* |
CTS Updating-specific A=86%*, C= 0%, E=14% |
CTS Shifting-specific A=82%*, C=0%, E=18% |
||||||||||
| CTS UPPS-P Scale | rA | rE | Biv A | Biv E | rA | rE | Biv A | Biv E | rA | rE | Biv A | Biv E |
| 1. Positive Urgency A=30%*, C= 4%, E=66%* |
−.44** [−.74, −.15] | .03 [−.24, .30] | −.23** | .01 | −.07 [−.35, .21] | .17 [−.23, .56] | −.04 | .05 | .21 [−.07, .50] | .02 [−.33, .37] | .11 | .01 |
| 2. Negative Urgency A=41%*, C= 0%, E=59%* |
−.35** [−.56, −.14] | .03 [−.29, .34] | −.21** | .01 | .01 [−.23, .25] | .06 [−.36, .48] | .01 | .02 | .09 [−.16, .34] | .01 [−.39, .41] | .06 | .00 |
| 3. Lack of Premeditation A=32%*, C= 0%, E=68%* |
−.09 [−.33, .15] | −.27 [−.58, .04] | −.05 | −.09 | −.21 [−.49, .06] | .47* [−.08, 1.0] | −.11 | .14* | .02 [−.26, .30] | .46* [.03, .89] | .01 | .17* |
| 4. Lack of Perseverance A=21%, C= 7%, E=72%* |
.04 [−.25, .33] | −.08 [−.37, .20] | .02 | −.03 | −.02 [−.34, .30] | .06 [−.32, .44] | −.01 | .02 | .19 [−.16, .53] | .27 [−.11, .65] | .08 | .10 |
| 5. Sensation Seeking A=45%*, C= 0%, E=55%* |
−.03 [−.24, .17] | .44* [.15, .72] | −.02 | .14* | .17 [−.05, .39] | −.30 [−.77, .17] | .11 | −.08 | .14 [−.09, .38] | −.19 [−.59, .22] | .09 | −.06 |
Note. Each UPPS-P scale modeled separately (i.e., five models). Numbers in brackets are 95% confidence intervals for the genetic and environmental correlations. Percentages are ACE variances taken from separate analyses for the EF model and each UPPS-P variable modeled alone (see supplementary material); path estimates changed negligibly in multivariate models. C correlations were not estimated because of zero or near-zero C variances for EFs and UPPS-P scales. E correlations (indicated with dashes) with Updating-specific ability in the LTS were also not modeled because of the Updating-specific factor’s near-zero variance. EF=executive function; LTS= Longitudinal Twin Study; CTS= Community Twin Sample; A=additive genetic variance; C=shared environmental variance; E=nonshared environmental variance; rA=genetic correlation; rE=nonshared environmental correlation; Biv A=bivariate heritability—the phenotypic correlation explained by the genetic correlation; Biv E=bivariate nonshared environmentality—the phenotypic correlation explained by the environmental correlation. For each pair of variables, Biv A + Biv E equals the model phenotypic correlations, which are very close to those in Table 1.
p<.05 and
p<.0033, determined with chi-square difference tests.
Boldface type indicates p<.05 in both samples.
As shown in Table 2, in the LTS, Common EF did not significantly genetically correlate with any UPPS-P scale, all Δχ2(1)<2.11, ps>.146, but Common EF nominally significantly environmentally correlated with positive urgency and negative urgency (rE= −.22 to −.27), both Δχ2(1)>3.99, ps<.047. In the CTS, Common EF significantly genetically correlated with both positive urgency and negative urgency (rAs= −.35 to −.44), both Δχ2(1)>10.40, ps<001, with nonshared environmental correlations close to zero for both scales, both Δχ2(1)>0.02, ps>. 868. Common EF also showed a nominally significant positive nonshared environmental correlation with sensation seeking (rE=.44), Δχ2(1)=8.58, p=.003, accounting for all of the marginally significant phenotypic correlation.
There were few genetic and environmental correlations of the UPPS-P scales with the Updating-specific and Shifting-specific factors, consistent with the phenotypic results. None were significant after multiple testing correction in each sample, nor nominally significant in both samples.
Answer. Considering results across both samples, the answer to question 2 is as follows: EFs and impulsivity dimensions are not necessarily more closely related at the genetic than the phenotypic levels. Genetic correlations were inconsistent across samples, and when present, were only moderate.
Question 3: Do EFs and impulsivity dimensions predict independent variance in psychopathology?
Table 3 presents standardized regression coefficients for multiple regression structural equation models in which the three EFs and five UPPS-P scales simultaneously predicted the Internalizing and Externalizing psychopathology latent variables in each sample. For comparison, Table 3 also presents correlations from statistically equivalent confirmatory factor analyses in which Internalizing and Externalizing factors were correlated with EFs and impulsivity rather than being regressed on them (i.e., not accounting for overlapping variance across UPPS-P scales and EFs). The LTS model fit well, χ2(186)=245.84, p=.002, CFI=.981, RMSEA=.021. Despite a large chi-square statistic for the CTS model due to the large sample size, the RMSEA and CFI suggested adequate fit, χ2(188)=441.93, p<.001, CFI=.964, RMSEA=.028.
Table 3.
Correlations and Standardized Regression Coefficients for Psychopathology Factors in the LTS and CTS
| Regression Coefficients for | Correlations with | |||
|---|---|---|---|---|
| Independent Variables | Internalizing | Externalizing | Internalizing | Externalizing |
| A. LTS | ||||
| Common EF | −.04 [−.20, .12] | −.17** [−.27, −.06] | −.07 [−.22, .09] | −.20** [−.32, −.09] |
| Updating-specific | −.11 [−.28, .06] | −.10 [−.21, .02] | −.14 [−.31, .03] | −.12* [−.24, .00] |
| Shifting-specific | .01 [−.16, .17] | −.02 [−.11, .08] | −.01 [−.17, .15] | −.03 [−.14, .08] |
| Positive Urgency | −.03 [−.18, .13] | −.04 [−.13, .06] | .20** [.09, .31] | .34** [.26, .42] |
| Negative Urgency | .31** [.16, .46] | .37** [.28, .46] | .32** [.22, .43] | .47** [.39, .54] |
| Lack of Premeditation | −.11 [−.24, .02] | .13** [.05, .20] | .04 [−.07, .15] | .32** [.25, .40] |
| Lack of Perseverance | .14* [.01, .27] | .12** [.04, .21] | .18** [.07, .28] | .28** [.19, .36] |
| Sensation Seeking | .05 [−.08, .19] | .18** [.10, .27] | .03 [−.09, .14] | .19** [.11, .27] |
| B. CTS | ||||
| Common EF | −.07 [−.23, .09] | −.13* [−.25, −.01] | −.14 [−.28, .01] | −.19** [−.31, −.08] |
| Updating-specific | −.04 [−.21, .12] | −.11 [−.23, .02] | −.04 [−.21, .13] | −.10 [−.23, .04] |
| Shifting-specific | .07 [−.11, .26] | .10 [−.04, .24] | .12 [−.06, .30] | .16* [.03, .29] |
| Positive Urgency | .09 [−.01, .19] | .05 [−.03, .12] | .30** [.23, .37] | .34** [.29, .39] |
| Negative Urgency | .25** [.16, .33] | .26** [.19, .34] | .36** [.29, .42] | .38** [.33, .43] |
| Lack of Premeditation | −.08 [−.17, .00] | .09* [.02, .15] | .13** [.05, .20] | .28** [.23, .33] |
| Lack of Perseverance | .21** [.13, .28] | .07* [.01, .14] | .30**[.23, .37] | .21** [.15, .26] |
| Sensation Seeking | −.03 [−.13, .06] | .18** [.11, .25] | −.03 [−.11, .05] | .18** [.13, .24] |
Note. Standardized regression coefficients, controlling for sex, from structural equation models in the Longitudinal Twin Study (LTS; total N=765), and Community Twin Sample (CTS; total N=1784, but only 761 individuals contributed to the EF model and its correlations). Correlations from confirmatory factor analyses (i.e., relations without controlling for correlated predictors) are also presented for comparison. Numbers in brackets are 95% confidence intervals. Executive function (EF) and psychopathology variables were latent variables modeled as shown in Figure 1, and UPPS-P scales were manifest variables. All indicators were regressed on sex. All independent variables were allowed to correlate, except for the orthogonal EF latent factors. The residual variances for the two dependent psychopathology latent variables were also allowed to correlate. Model estimated with the means and variance adjusted weighted least squares (WLSMV) estimator to account for the ordinal psychopathology and substance use disorder symptom data.
p<.05 and
p<.00625, adjusted for non-independence of twin pairs.
Boldface type indicates p<.05 in both samples.
In the LTS, Externalizing psychopathology correlated significantly and positively with all five UPPS-P scales, and significantly negatively correlated with Common EF (right side of Table 3) after multiple testing correction (p<.00625). When controlling for the intercorrelations among EFs and impulsivity dimensions in the multiple regression (left side of Table 3), Externalizing psychopathology remained significantly (p<.00625) related to Common EF, and all of the UPPS-P scales except for positive urgency.
CTS Externalizing psychopathology showed a similar pattern. After multiple testing correction, Externalizing psychopathology correlated significantly and positively with all five UPPS-P scales, and significantly negatively correlated with Common EF. When controlling for the intercorrelations among these EFs and impulsivity dimensions in the multiple regression, Externalizing psychopathology remained nominally significantly related to Common EF (β= −.13, p=.037) and all of the UPPS-P scales (βs>.07, ps<.023) except for positive urgency, with the relations to negative urgency and sensation seeking significant after multiple testing correction.
In the LTS, Internalizing psychopathology did not significantly correlate with any EFs in the confirmatory factor analysis, but correlated significantly and positively with positive urgency, negative urgency, and lack of perseverance after multiple testing correction. In the multiple regression, Internalizing psychopathology remained significantly related to negative urgency (β=.31, p<.001) and nominally significantly related to lack of perseverance (β=.14, p=.038). In the CTS, Internalizing psychopathology also did not significantly correlate with EFs in the confirmatory factor analysis, but correlated significantly after multiple testing correction with positive urgency, negative urgency, lack of perseverance, and lack of premeditation. Just as in the LTS, in the multiple regression, CTS Internalizing psychopathology remained significantly related to negative urgency (β=.25, p<001) and lack of perseverance (β=.21, p<.001). Thus, although Internalizing psychopathology was not significantly related to EFs in these analyses, Internalizing psychopathology’s relations to the UPPS-P scales to some extent reflected independent variances.
Twin models suggest that these relations to psychopathology are primarily genetic. Table 4 decomposes the associations of the psychopathology latent variables with the UPPS-P subscales and EF latent variables into genetic and nonshared environmental correlations (see supplementary Figure S4 for ACE models for the psychopathology latent variables and supplementary Table S4 for univariate ACE estimates for each psychopathology indicator). All models fit acceptably, all LTS χ2 ps>.004, CFIs>.953, RMSEAs<.028; all CTS χ2 ps>.003, CFIs>.987, RMSEAs<.020.
Table 4.
Genetic and Nonshared Environmental Correlations of Psychopathology Latent Variables with EFs and UPPS-P Scales in the LTS and CTS
| LTS Internalizing Factor A=53%*, C= 28%, E=19% |
LTS Externalizing Factor A=81%*, E=19%* |
|||||||
|---|---|---|---|---|---|---|---|---|
| LTS Measure | rA | rE | Biv A | Biv E | rA | rE | Biv A | Biv E |
| 1. Positive Urgency A=32%*, C= 0%, E=68%* |
.32 [−.14, .78] | .21 [−.15, .58] | .13 | .08 | .55** [.37, .72] | .18 [.00, .36] | .27** | .07 |
| 2. Negative Urgency A=40%*, C= 0%, E=60%* |
.53** [.00, 1.1] | .29 [−.09, .67] | .24** | .10 | .57** [.41, .73] | .41** [.21, .62] | .32** | .14** |
| 3. Lack of Premeditation A=27%*, C= 0%, E=73%* |
.47* [−.09, 1.0] | −.39* [−.79, .01] | .17* | −.15* | .57** [.38, .75] | .18 [−.02, .37] | .25** | .07 |
| 4. Lack of Perseverance A=44%**, C= 0%, E=56%* |
.47** [−.03, .97] | −.11 [−.44, .22] | .21** | −.04 | .44** [.27, .62] | .05 [−.18, .29] | .25** | .02 |
| 5. Sensation Seeking A=29%, C= 16%, E=55%* |
−.42 [−1.1, .26] | .52* [−.05, 1.1] | −.15 | .17* | .28* [−.10, .65] | .21 [−.01, .43] | .12* | .07 |
| 6. Common EF A=80%*, C= 4%, E=16%* |
−.17 [−.52, .18] | .29 [−.71, 1.3] | −.12 | .04 | −.35** [−.52, −.19] | .61* [−.18, 1.4] | −.30** | .09* |
| 7. Updating-Specific A=99%*, C= 0%, E=1% |
−.17 [−.46, .11] | -- | −.12 | -- | −.13 [−.28, .01] | -- | −.12 | -- |
| 8. Shifting-Specific A=79%*, C=0%, E=21%* |
−.35* [−.76, .05] | .79* [−.01, 1.6] | −.21* | .20* | −.19* [−.36, −.01] | .30 [−.03, .63] | −.14* | .08 |
| CTS Internalizing Factor A=41%, C= 22%, E=38%* |
CTS Externalizing Factor A=63%*, C= 13%, E=24%** |
|||||||
| CTS Measure | rA | rE | Biv A | Biv E | rA | rE | Biv A | Biv E |
| 1. Positive Urgency A=30%*, C= 4%, E=66%* |
.56** [.09, 1.0] | .16 [−.02, .35] | .22** | .08 | .58** [.38, .77] | .14 [−.01, .30] | .28** | .06 |
| 2. Negative Urgency A=41%*, C= 0%, E=59%* |
.58** [.14, 1.0] | .25* [.06, .44] | .24** | .12* | .65** [.44, .86] | .11 [−.04, .27] | .33** | .04 |
| 3. Lack of Premeditation A=32%*, C= 0%, E=68%* |
.05 [−.22, .31] | .22* [.03, .40] | .02 | .11* | .46** [.26, .66] | .19* [.05, .33] | .20** | .08* |
| 4. Lack of Perseverance A=21%, C= 7%, E=72%* |
.65** [.16, 1.1] | .15 [−.02, .31] | .23** | .07 | .50** [.30, .70] | −.04 [−.20, .12] | .22** | −.02 |
| 5. Sensation Seeking A=45%*, C= 0%, E=55%* |
−.02 [−.24, .21] | −.07 [−.25, .12] | −.01 | −.03 | .31** [.14, .47] | .05 [−.12, .22] | .16** | .02 |
| 6. Common EF A=83%*, C= 0%, E=17%* |
−.02 [−.34, .28] | −.39 [−1.0, .23] | −.02 | −.11 | −.30* [−.52, −.07] | .16 [−.35, .67] | −.21* | .04 |
| 7. Updating-Specific A=86%*, C= 0%, E=14% |
−.34 [−.81, .14] | .52 [−.25, 1.3] | −.19 | .15 | −.21 [−.46, .04] | .17 [−.40, .74] | −.15 | .04 |
| 8. Shifting-Specific A=82%*, C=0%, E=18% |
.02 [−.36, .40] | .37 [−.53, 1.3] | .01 | .10 | .12 [−.12, .36] | .26 [−.44, .96] | .08 | .06 |
Note. Each UPPS-P scale modeled separately (i.e., five models). Numbers in brackets are 95% confidence intervals for the genetic and environmental correlations. Percentages are ACE variances taken from separate analyses for the psychopathology model, the EF model, and each UPPS-P variable modeled alone (see supplementary material); path estimates changed negligibly in multivariate models. To aid model convergence, C parameters were dropped for all variables except LTS Internalizing and sensation seeking and CTS Internalizing and Externalizing. C correlations were not estimated because of zero or near-zero C variances for EFs and UPPS-P scales. E correlations (indicated with dashes) with Updating-specific ability in the LTS were also not modeled because of the Updating-specific factor’s near-zero variance. EF=executive function; LTS= Longitudinal Twin Study; CTS= Community Twin Sample; A=additive genetic variance; C=shared environmental variance; E=nonshared environmental variance; rA=genetic correlation; rE=nonshared environmental correlation; Biv A=bivariate heritability—the phenotypic correlation explained by the genetic correlation; Biv E=bivariate nonshared environmentality—the phenotypic correlation explained by the environmental correlation. For each pair of variables, Biv A + Biv E equals the model phenotypic correlations, which are similar to those in Table 3.
p<.05 and
p<.00625, determined with chi-square difference tests.
These tests may not agree with tests/confidence intervals based on standard errors for ACE parameters, which can depend on model parameterization (Neale et al., 1989). Boldface type indicates p<.05 in both samples.
In both samples, Externalizing psychopathology positively genetically correlated with all five impulsivity scales (rAs= .28 to .65) and negatively genetically correlated with Common EF (rAs= −.30 to −.35). In both samples, Internalizing psychopathology positively genetically correlated with negative urgency and lack of perseverance (rAs= .47 to .65) but not Common EF. No nonshared environmental correlations were nominally significant and in the same direction in both samples.
Answer. Considering results across both samples, the answer to question 3 is as follows: EFs and impulsivity dimensions predict independent variance in Externalizing psychopathology, and multiple impulsivity dimensions predict independent variance in Internalizing psychopathology. The LTS and CTS multiple regressions were in complete agreement as to which constructs nominally predict independent psychopathology variance: Common EF and all impulsivity dimensions except for positive urgency independently predicted Externalizing psychopathology, and negative urgency and lack of perseverance, but not EFs, also independently predicted Internalizing psychopathology. Twin models further suggested that the relations of psychopathology with both impulsivity and Common EF were primarily genetic in origin. Given that Common EF and impulsivity predicted independent phenotypic variance in psychopathology and were not consistently genetically correlated across samples, these patterns suggest that their genetic separability also is relevant for psychopathology.
General Discussion
Across both twin samples, these EFs showed small correlations with impulsivity dimensions at the phenotypic and genetic/environmental levels. Although there were some inconsistencies in terms of the genetic vs. environmental sources of these correlations (environmental for Common EF with positive and negative urgency in LTS vs. genetic for these same relations in the CTS), the confidence intervals overlapped, and in both samples it was clear that EFs and impulsivity showed largely independent genetic and environmental influences. With respect to Common EF, which was the EF most related to impulsivity dimensions, the greatest rA= −.44, and the greatest rE=.44, all far from unity according to the 95% confidence intervals. Moreover, across both samples, Common EF and multiple impulsivity dimensions explained independent variance in Externalizing psychopathology, and multiple impulsivity dimensions, but not Common EF, explained independent variance in Internalizing psychopathology. The relations of both Common EF and impulsivity to psychopathology were primarily genetic in origin and consistent in size across both samples, even though the relations between Common EF and impulsivity were not consistently genetic across samples.
These results suggest that low correlations between self-report and behavioral measures arise because they assess different constructs, both of which may be relevant for everyday behavior (Sharma et al., 2014; Toplak et al., 2013), rather than because one or both are invalid or dwarfed by measurement error. That said, it is also possible that methodological differences associated with reliable variance have some role in decreasing the correlations. The self-report measures, though intended to capture different dimensions of impulsivity, generally showed larger correlations with each other than with the behavioral EF measures, with the possible exception of sensation seeking. Thus, there may be both construct and methodological explanations for the low correlations between behavioral and self-report measures.
Although Common EF and impulsivity predicted independent variance in psychopathology, it is also important to acknowledge the small effect sizes for the relations between EFs and psychopathology. Common EF did not significantly predict Internalizing psychopathology in either sample, and in both samples, Common EF correlations with Externalizing psychopathology (r= −.19 to −.20) were approximately half the magnitude of the correlations of negative urgency with Externalizing psychopathology (r= .38 to .47). These results are consistent with the suggestion that EF ratings may predict real-world impairment better than laboratory EF tasks (Barkley & Fischer, 2011). This effect size difference may explain why a recent study found that self-regulation tasks do not predict real-world behavior whereas impulsivity scales do (Enkavi et al., 2019), as larger samples may be needed to detect relations with EF tasks and even EF latent variables. Nevertheless, our finding that EF latent variables and impulsivity scales predict independent variance in psychopathology suggests that both may be relevant to obtain a full understanding of how these problems relate to self-regulation.
The finding that EFs and impulsivity are not interchangeable, even when considered at the genetic level, clearly contradicts prior suggestions that they may be antipodes (Bickel et al., 2012). However, the nature of their differences remains to be determined.
One possibility is that self-report measures tap general trait-like response tendencies, whereas behavioral tasks tap more in-the moment reactions or states (Cyders & Coskunpinar, 2011). Yet, the high stability of EFs (Friedman et al., 2016) means they do seem to have some trait-like qualities. EF stability is at least as large as stability of UPPS-P scales: One large (N=1158) study of freshman college women (Riley, Combs, Jordan, & Smith, 2015) reported 9-month stability of r=.61 to .77 for the five UPPS-P scales.
Some have suggested that EF tasks may measure optimal performance, whereas questionnaire measures may assess typical behavior (Sharma et al., 2014; Toplak et al., 2013), or that “self-report measures tap underlying emotional/motivational mechanisms,” whereas behavioral measures tap “cognitive aspects” (Sharma et al., 2014, p. 394). These distinctions would explain why both measures incrementally predict real-world behavior that reflects problems of control over emotional and motivational tendencies. We tend to agree with the latter explanation. Urgency, the dimension most strongly related to psychopathology in our samples and others (Berg et al., 2015), could be interpreted as an index of emotional response in addition to a measure of emotional control, so at least some of the independent variance in psychopathology explained by impulsivity may relate to individual differences in bottom-up emotional reactivity. It is also possible that top-down emotional control (i.e., “hot EF”) differs from non-emotional control (“cool EF”; Zelazo & Carlson, 2012). Future research on the mechanisms of this distinction will be important for models of EF and its relation to personality and psychopathology.
Despite the clear separability of EFs and impulsivity at both the phenotypic and genetic levels, Common EF showed small correlations with urgency and lack of premeditation that replicated across samples, whereas the specific EF factors did not show consistent correlations across samples. Although we found some results consistent with our hypothesis that Shifting-specific ability would be positively associated with impulsivity, they were not consistent across samples or impulsivity facets. These patterns confirm our hypothesis that Common EF would be the EF factor most related to impulsivity. As our Common EF factor is isomorphic with a response inhibition factor (i.e., Common EF captures all the variability in a response inhibition factor in a hierarchical model), these results are consistent with prior findings linking self-reported disinhibition with laboratory response inhibition abilities (Venables et al., 2018). However, because we considered multiple EFs in the model, we were able to characterize these relations in more detail. In particular, our results suggest that the relations of impulsivity measures to EF tasks may also be described as a shared reliance on EF processes that are common to multiple EFs (i.e., active goal maintenance and implementation; Friedman & Miyake, 2017), not just response inhibition.
Our results are consistent with those of Harden et al. (2017) and Malanchini et al. (2018), who found low phenotypic and nonsignificant genetic correlations of self-control latent variables based on self-reports and tasks. Our finding that Common EF and impulsivity dimensions independently predict psychopathology also parallels Malanchini et al.’s (2018) finding that both Common EF and impulse control independently predicted academic achievement. Thus, based on multiple independent twin samples and multiple ways of measuring impulsivity, Common EF and impulsivity are separable constructs, both in terms of their phenotypic and genetic relations to each other, as well as their criterion validity for predicting success (Malanchini et al., 2018) and health (current study).
Consistent with meta-analytic results (Berg et al., 2015), we found that psychopathology symptoms were most related to negative urgency. However, our multiple regression analyses revealed that controlling for the interrelations among the UPPS-P scales and their associations with EFs, lack of perseverance also independently predicted Internalizing; and lack of premeditation, lack of perseverance, and sensation seeking also independently predicted Externalizing in both samples. These results confirm the separability and relevance of the UPPS-P dimensions.
Although not the primary focus of this study, it is worth noting that the CTS EF model, which has not been previously published, replicates the high heritability and genetic unity and diversity of EFs in adulthood previously reported for the LTS (Friedman et al., 2016). Given that the subsample of the CTS with EF data was selected to increase variability in externalizing symptoms, the similarity of the EF models across these independent twin samples is remarkable. These results add to those from the Texas twin sample, which examined a conceptually similar model in children and found high heritability for a Common EF factor (Engelhardt, Briley, Mann, Harden, & Tucker-Drob, 2015), although that factor was more closely related to working memory and updating than response inhibition.
A limitation of the study is that the results for these samples may not generalize to samples clinically ascertained for psychopathology. The samples were also predominately White, so results may differ with more ethnically/racially diverse samples. Moreover, although the LTS and CTS completed similar enough assessments that the same models could be examined, the two samples differed in age, EF task versions, and ascertainment. That is why we did not analyze a single model with both samples. Nevertheless, the results with these two samples provide an estimate of the range and robustness of effects in a general population.
Conclusion and Implications
Results across two independent twin studies were remarkably consistent: EFs and impulsivity capture somewhat overlapping but phenotypically and genetically separable constructs. Importantly, they are both valid measures of individual differences that are independently relevant for understanding externalizing psychopathology. Thus, EF and impulsivity are not interchangeable, as might be suggested by their inclusion as different units of analysis within the same construct of “Response Selection; Inhibition/Suppression” in the National Institute of Health’s Research Domain Criteria (RDoC) framework (Cuthbert, 2014). Rather, although they tap some common variance, including both units of analysis (and in the case of impulsivity, multiple dimensions) is likely to aid prediction of and insight into psychopathology, particularly externalizing psychopathology.
Supplementary Material
Acknowledgements
This research was supported by grants from the National Institutes of Health: MH063207, MH016880, MH001865, AG046938, DA011015, and DA046413. The authors would like to thank Sally Ann Rhea for her assistance with data collection and study coordination.
Footnotes
Adolescent EF data (N=786) were collected approximately 6 years earlier, at mean age 17.3 years. The age 17 Common EF, Updating-specific, and Shifting-specific factors did not significantly correlate with the age 23 UPPS-P scales, rs = −.02 to .04, ps>.185.
We recently examined an independent pathways ACE model using the UPPS-P data from only the LTS (Gustavson et al., 2019). This independent pathways model, modified to include some residual correlations, indicated some common genetic variance on four of the scales (except for sensation seeking), but also indicated significant scale-specific genetic and environmental variance that predicted personality and psychopathology over and above the shared genetic and environmental influences. Given the complexity of this model and the scale of the analyses we undertook for the current study, we focus here on the simpler models examining each scale individually, which more straightforwardly address the goals of the study.
As was the case for the LTS (Friedman et al., 2016), in the CTS correlated factor model, the latent variable correlations among Inhibiting, Updating, and Shifting factors were all significant (rs= .31 to .74, all ps< 001), No two factors could be collapsed without harming model fit, all Δχ2(2)> 141.31, ps< 001, nor could all three factors be collapsed, Δχ2(3)=844.74, p< 001, indicating unity and diversity of EFs. As in other independent samples, there was no evidence for an Inhibiting-specific factor: When an Inhibiting-specific factor was added to the bifactor model, it had negative variance, and when residual correlations were instead allowed between the inhibiting tasks, all were negative (rs = −.20 to −.31, ps>046), which is inconsistent with the idea that Common EF fails to explain the positive covariances among the inhibition tasks. Thus, we retained the bifactor model with no Inhibiting-specific factor and no residual correlations. In this model, given the low loading for the spatial 2-back task on the Updating-specific factor, the loadings for keep track and letter memory were constrained to be equal to ensure identify this factor was identified; this constraint did not change model fit compared to a model with un-equated loadings, Δχ2(1)=0.10, p=.755.
When we modeled each UPPS-P scale as a latent variable with loadings for all items (using the WLSMV estimator to account for the ordinal nature of the individual items), correlations with EFs differed by only .01 on average in both the LTS and CTS (range= −.02 to .04), compared to the models with manifest UPPS-P variables, and significance levels did not change for any correlation, except that the LTS correlation of Common EF with negative urgency became nominally significant in the latent UPPS-P variable model. Thus, we retained the considerably simpler manifest UPPS-P variables.
References
- American Psychological Association. (1994). Diagnostic and statistical manual of mental disorders (4th ed.). Washington, DC: Author. [Google Scholar]
- Barkley RA, & Fischer M (2011). Predicting impairment in major life activities and occupational functioning in hyperactive children as adults: Self-reported executive function (EF) deficits versus EF tests. Developmental Neuropsychology, 36, 137–161. [DOI] [PubMed] [Google Scholar]
- Berg JM, Latzman RD, Bliwise NG, & Lilienfeld SO (2015). Parsing the heterogeneity of impulsivity: A meta-analytic review of the behavioral implications of the UPPS for psychopathology. Psychological Assessment, 27, 1129–1146. [DOI] [PubMed] [Google Scholar]
- Bezdjian S, Baker LA, & Tuvblad C (2011). Genetic and environmental influences on impulsivity: A meta-analysis of twin, family and adoption studies. Clinical Psychology Review, 31, 1209–1223. [DOI] [PMC free article] [PubMed] [Google Scholar]
- Bickel WK, Jarmolowicz DP, Mueller ET, Gatchalian KM, & McClure SM (2012). Are executive function and impulsivity antipodes? A conceptual reconstruction with special reference to addiction. Psychopharmacology, 221, 361–387. [DOI] [PMC free article] [PubMed] [Google Scholar]
- Caspi A, Houts RM, Belsky DW, Goldman-Mellor SJ, Harrington H, Israel S, et al. (2014). The p factor: One general psychopathology factor in the structure of psychiatric disorders? Clinical Psychological Science, 2, 119–137. [DOI] [PMC free article] [PubMed] [Google Scholar]
- Cottler LB, Robins LN, & Helzer JE (1989). The reliability of the CIDI-SAM: A comprehensive substance abuse interview. Addiction, 84, 801–814. [DOI] [PubMed] [Google Scholar]
- Cuthbert BN (2014). The RDoC framework: Facilitating transition from ICD/DSM to dimensional approaches that integrate neuroscience and psychopathology. World Psychiatry, 13, 28–35. [DOI] [PMC free article] [PubMed] [Google Scholar]
- Cyders MA, & Coskunpinar A (2011). Measurement of constructs using self-report and behavioral lab tasks: Is there overlap in nomothetic span and construct representation for impulsivity? Clinical Psychology Review, 31, 965–982. [DOI] [PubMed] [Google Scholar]
- Derks EM, Dolan CV, & Boomsma DI (2004). Effects of censoring on parameter estimates and power in genetic modeling. Twin Research, 7, 659–669. [DOI] [PubMed] [Google Scholar]
- Dick DM, Smith G, Olausson P, Mitchell SH, Leeman RF, O’Malley SS, & Sher K (2010). Understanding the construct of impulsivity and its relationship to alcohol use disorders. Addiction Biology, 15, 217–226. [DOI] [PMC free article] [PubMed] [Google Scholar]
- Duckworth AL, & Kern ML (2011). A meta-analysis of the convergent validity of self-control measures. Journal of Research in Personality, 45, 259–268. [DOI] [PMC free article] [PubMed] [Google Scholar]
- Engelhardt LE, Briley DA, Mann FD, Harden KP, & Tucker-Drob EM (2015). Genes unite executive functions in childhood. Psychological Science, 26, 1151–1163. [DOI] [PMC free article] [PubMed] [Google Scholar]
- Enkavi AZ, Eisenberg IW, Bissett PG, Mazza GL, MacKinnon DP, Marsch LA, & Poldrack RA (2019). Large-scale analysis of test-retest reliabilities of self-regulation measures. Proceedings of the National Academy of Sciences, 116, 5472–5477. [DOI] [PMC free article] [PubMed] [Google Scholar]
- Evenden JL (1999). Varieties of impulsivity. Psychopharmacology, 146, 348–361. [DOI] [PubMed] [Google Scholar]
- Friedman NP, & Miyake A (2017). Unity and diversity of executive functions: Individual differences as a window on cognitive structure. Cortex, 86, 186–204. [DOI] [PMC free article] [PubMed] [Google Scholar]
- Friedman NP, du Pont A, Corley RP, & Hewitt JK (2018). Longitudinal relations between depressive symptoms and executive functions from adolescence to early adulthood: A twin study. Clinical Psychological Science, 6, 543–560. [DOI] [PMC free article] [PubMed] [Google Scholar]
- Friedman NP, Miyake A, Altamirano LJ, Corley RP, Young SE, Rhea S-A, & Hewitt JK (2016). Stability and change in executive function abilities from late adolescence to early adulthood: A longitudinal twin study. Developmental Psychology, 52, 326–340. [DOI] [PMC free article] [PubMed] [Google Scholar]
- Friedman NP, Miyake A, Young SE, DeFries JC, Corley RP, & Hewitt JK (2008). Individual differences in executive functions are almost entirely genetic in origin. Journal of Experimental Psychology: General, 137, 201–225. [DOI] [PMC free article] [PubMed] [Google Scholar]
- Gustavson DE, du Pont A, Hatoum AS, Rhee SH, Kremen WS, Hewitt JK, & Friedman NP (2017a). Genetic and environmental associations between procrastination and internalizing/externalizing psychopathology. Clinical Psychological Science, 5, 798–815. [DOI] [PMC free article] [PubMed] [Google Scholar]
- Gustavson DE, Franz CE, Kremen WS, Carver CS, Corley RP, Hewitt JK, & Friedman NP (2019). Common genetic influences on impulsivity facets are related to goal management, psychopathology, and personality. Journal of Research in Personality, 79, 161–175. [DOI] [PMC free article] [PubMed] [Google Scholar]
- Gustavson DE, Stallings MC, Corley RP, Miyake A, Hewitt JK, & Friedman NP (2017b). Executive functions and substance use: Relations in late adolescence and early adulthood. Journal of Abnormal Psychology, 126, 257–270. [DOI] [PMC free article] [PubMed] [Google Scholar]
- Harden KP, Kretsch N, Mann FD, Herzhoff K, Tackett JL, Steinberg L, & Tucker-Drob EM (2017). Beyond dual systems: A genetically-informed, latent factor model of behavioral and self-report measures related to adolescent risk-taking. Developmental Cognitive Neuroscience, 25, 221–234. [DOI] [PMC free article] [PubMed] [Google Scholar]
- Hatoum AS, Rhee SH, Corley RP, Hewitt JK, & Friedman NP (2018). Do executive functions explain the covariance between internalizing and externalizing behaviors? Development and Psychopathology, 30, 1371–1387. [DOI] [PMC free article] [PubMed] [Google Scholar]
- Herd SA, O’Reilly RC, Hazy TE, Chatham CH, Brant AM, & Friedman NP (2014). A neural network model of individual differences in task switching abilities. Neuropsychologia, 62, 375–389. [DOI] [PMC free article] [PubMed] [Google Scholar]
- Hofmann W, Schmeichel BJ, & Baddeley AD (2012). Executive functions and self-regulation. Trends in Cognitive Sciences, 16, 174–180. [DOI] [PubMed] [Google Scholar]
- Hu L-T, & Bentler PM (1998). Fit indices in covariance structure modeling: Sensitivity to underparameterized model misspecification. Psychological Methods, 3, 424–453. [Google Scholar]
- Ito TA, Friedman NP, Bartholow BD, Correll J, Loersch C, Altamirano LJ, & Miyake A (2015). Toward a comprehensive understanding of executive cognitive function in implicit racial bias. Journal of Personality and Social Psychology, 108, 187–218. [DOI] [PMC free article] [PubMed] [Google Scholar]
- Lynam DR, Whiteside SP, Smith GT, & Cyders MA (2006). The UPPS-P: Assessing five personality pathways to impulsive behavior. West Lafayette, IN: Purdue University. Unpublished report.: West Lafayette, IN: Purdue University. Unpublished report. [Google Scholar]
- MacKillop J, Weafer J, Gray J, Oshri A, Palmer A, & Wit H (2016). The latent structure of impulsivity: Impulsive choice, Impulsive action, and impulsive personality traits. Psychopharmacology, 233, 3361–3370. [DOI] [PMC free article] [PubMed] [Google Scholar]
- Malanchini M, Engelhardt LE, Grotzinger AD, Harden KP, & Tucker-Drob EM (2018). “Same but different”: Associations between multiple aspects of self-regulation, cognition, and academic abilities. Journal of Personality and Social Psychology, Advance online publication. http:dx.doi.org-10.1037-pspp0000224. [DOI] [PMC free article] [PubMed] [Google Scholar]
- Moffitt TE, Arseneault L, Belsky D, Dickson N, Hancox RJ, Harrington H, et al. (2011). A gradient of childhood self-control predicts health, wealth, and public safety. Proceedings of the National Academy of Sciences, 108, 2693–2698. [DOI] [PMC free article] [PubMed] [Google Scholar]
- Muthén LK, & Muthén BO (2017). Mplus user’s guide. Eighth edition. Los Angeles, CA: Muthén & Muthén. [Google Scholar]
- Neale MC, Heath AC, Hewitt JK, Eaves LJ, & Fulker DW (1989). Fitting genetic models with LISREL: Hypothesis testing. Behavior Genetics, 19, 37–49. [DOI] [PubMed] [Google Scholar]
- Necka E, Gruszka A, Orzechowski J, Nowak M, & Wójcik N (2018). The (in)significance of executive functions for the trait of self-control: A psychometric study. Frontiers in Psychology, 9, 219–12. [DOI] [PMC free article] [PubMed] [Google Scholar]
- Necka E, Lech B, Sobczyk N, & Śmieja M (2012). How much do we know about our own cognitive control? European Journal of Psychological Assessment, 28, 240–247. [Google Scholar]
- Nigg JT (2017). On the relations among self-regulation, self-control, executive functioning, effortful control, cognitive control, impulsivity, risk-taking, and inhibition for developmental psychopathology. Journal of Child Psychology and Psychiatry, 58, 361–383. [DOI] [PMC free article] [PubMed] [Google Scholar]
- Rebollo I, De Moor MHM, Dolan CV, & Boomsma DI (2006). Phenotypic factor analysis of family data: Correction of the bias due to dependency. Twin Research and Human Genetics, 9, 367–376. [DOI] [PubMed] [Google Scholar]
- Rhea S-A, Gross AA, Haberstick BC, & Corley RP (2006). Colorado Twin Registry. Twin Research and Human Genetics, 9, 941–949. [DOI] [PubMed] [Google Scholar]
- Riley EN, Combs JL, Jordan CE, & Smith GT (2015). Negative urgency and lack of perseverance: Identification of differential pathways of onset and maintenance risk in the longitudinal prediction of nonsuicidal self-injury. Behavior Therapy, 46, 439–448. [DOI] [PMC free article] [PubMed] [Google Scholar]
- Robins LN, Cottier LB, Bucholz KK, Compton WM, North CS, & Rourke KM (2000). The diagnostic interview schedule for DSM-IV (DIS-IV). St. Louis, MO: Washington University School of Medicine. [Google Scholar]
- Sharma L, Markon KE, & Clark LA (2014). Toward a theory of distinct types of “impulsive” behaviors: A meta-analysis of self-report and behavioral measures. Psychological Bulletin, 140, 374–408. [DOI] [PubMed] [Google Scholar]
- Shulman EP, Smith AR, Silva K, Icenogle G, Duell N, Chein J, & Steinberg L (2016). The dual systems model: Review, reappraisal, and reaffirmation. Developmental Cognitive Neuroscience, 17, 103–117. [DOI] [PMC free article] [PubMed] [Google Scholar]
- Snyder HR, Miyake A, & Hankin BL (2015). Advancing understanding of executive function impairments and psychopathology: Bridging the gap between clinical and cognitive approaches. Frontiers in Psychology, 6, 328. [DOI] [PMC free article] [PubMed] [Google Scholar]
- Stahl C, Voss A, Schmitz F, Nuszbaum M, Tüscher O, Lieb K, & Klauer KC (2014). Behavioral components of impulsivity. Journal of Experimental Psychology: General, 143, 850–886. [DOI] [PubMed] [Google Scholar]
- Toplak ME, West RF, & Stanovich KE (2013). Practitioner Review: Do performance-based measures and ratings of executive function assess the same construct? Journal of Child Psychology and Psychiatry, 54, 131–143. [DOI] [PubMed] [Google Scholar]
- Venables NC, Foell J, Yancey JR, Kane MJ, Engle RW, & Patrick CJ (2018). Quantifying inhibitory control as externalizing proneness: A cross-domain model. Clinical Psychological Science, 216770261875769–20. [Google Scholar]
- Wilcox RR, & Keselman HJ (2003). Modern robust data analysis methods: Measures of central tendency. Psychological Methods, 8, 254–274. [DOI] [PubMed] [Google Scholar]
- Zelazo PD, & Carlson SM (2012). Hot and cool executive function in childhood and adolescence: Development and plasticity. Child Development Perspectives, 6, 354–360. [Google Scholar]
Associated Data
This section collects any data citations, data availability statements, or supplementary materials included in this article.