



Abstract
Background: Individuals living with spinal cord injury (SCI) have a high prevalence of obesity and unique barriers to healthy lifestyle. Objective: To examine barriers and facilitators to engagement and weight loss among SCI participants enrolled in the Group Lifestyle Balance Adapted for individuals with Impaired Mobility (GLB-AIM), a 12-month intensive lifestyle intervention. Methods: SCI participants (N = 31) enrolled in a wait-list, randomized controlled trial where all participants received intervention between August 2015 and February 2017. Analyses of pooled data occurred in 2020 to examine cross-sectional and prospective associations of hypothesized barriers and facilitators with (1) intervention engagement, comprised of attendance and self-monitoring, and (2) percent weight change from baseline to 12 months. We performed multivariable linear regression on variables associated with outcomes at p < .05 in bivariate analyses and controlled for intervention group. Results: Participants were middle-aged (mean age, 48.26 ± 11.01 years), equally male (50%) and female, White (80.7%), and unemployed (65.6%). In participants who completed baseline surveys (n = 30), dietary self-efficacy explained 26% of variance in engagement (p < .01); among the 12-month study completers (n = 22, 71.0%), relationship issues explained 23% of variance in engagement (p < .01). Money problems, health issues unrelated to SCI, lack of motivation, and experimental group explained 57% of variance in weight loss (p for model < .01), with lack of motivation uniquely explaining 24% of variance (p < .01). Conclusion: Improving engagement and weight loss for persons with SCI in the GLBAIM program may be achieved by addressing lack of motivation, relationship issues, and nutrition self-efficacy.
Keywords: barriers, facilitators, intervention, obesity, spinal cord injury, weight loss
People with spinal cord injury (SCI) have higher prevalence of obesity, estimated at 40% to 70%,1–5 and obesity-related chronic conditions such as diabetes, dyslipidemia, and cardiovascular disease6–12 than the general population. Additionally, at the same weight, people with SCI have higher percent body fat,13,14 which has led to the recommendation to use a lower body mass index (BMI) value to indicate obesity in people with SCI.15–17 Greater fat mass accumulates in the lower extremities and abdomen due to muscle paralysis and resultant immobility.10 Due to the negative health impacts of this constellation of factors, clinical practice guidelines published by the Consortium for Spinal Cord Medicine17 advise that providers identify and manage cardiometabolic disease (CMD), which occurs when someone experiences three or more of the following risk factors: abdominal adiposity, dyslipidemia, hypertension, insulin resistance or glucose intolerance, proinflammatory state, and prothrombotic state.18 CMD increases risk for diabetes, cardiovascular disease, and mortality.19 People with SCI experience greater risk for each of these risk factors than people without SCI.17 Notably, the consortium recommends lifestyle intervention targeting nutrition and physical activity (PA) as the first line of prevention and treatment, based on available evidence and expert consensus.
Despite the importance of weight management to health and function for people with SCI,17,20 providers have noted a lack of evidence-based interventions as a barrier to promoting weight loss in their patients with SCI.21 Although multiple studies have targeted PA,22–24 to our knowledge, only three published studies have investigated weight loss approaches combining PA and nutrition specifically in people with SCI.25–27 One was a case series with three individuals27 and the other two reported on outcomes of 1325 and 1626 participants in single-group, pre-post studies. All interventions included weekly in-person educational sessions addressing nutrition, physical activity, and behavioral change strategies over 1225,26 or 2427 weeks. The studies reported retaining 82% of participants and an average (weighted by sample size) weight loss of 5.01 kg or 5.0% of starting weight. These pilot results offer encouraging evidence that lifestyle interventions can promote behavior change and weight loss in individuals with SCI.
Maximizing uptake and effectiveness of lifestyle interventions for people with SCI requires understanding what helps or hinders their efforts, yet few studies have assessed participant-reported barriers and facilitators to program engagement and subsequent weight loss. Even though Bailey and colleagues28 conducted a qualitative study of barriers and facilitators to an anti-inflammatory diet in people with SCI, the sample consisted of only six participants. Other studies have examined frequently cited barriers to exercise among people with SCI, which include internal factors (e.g., lack of time or motivation, low self-efficacy for PA), resource-related factors (e.g., not having funds to join an exercise program), and structural factors (e.g., lack of accessible gyms or equipment in the community).29,30 However, a recent survey of 180 people with SCI found that the barriers most highly correlated with exercise levels were internal, rather than environmental, and less frequently cited barriers were more strongly associated with exercise status. 31
We conducted a 12-month randomized controlled trial (RCT) of the intensive lifestyle intervention (ILI), Group Lifestyle Balance Adapted for Impaired Mobility (GLB-AIM), an adaptation of the evidence-based Diabetes Prevention Program Group Lifestyle Balance,32,33 with a sample that included 31 participants with SCI. To identify opportunities to enhance intervention effectiveness for this population uniquely at risk for adverse effects of obesity, this secondary analysis explores potential barriers and facilitators of engagement and weight loss in the subset of SCI participants who enrolled in the GLB-AIM. Specifically, we sought to identify barriers and facilitators associated with program engagement, defined as session attendance and self-monitoring, and percent weight loss achieved by 12 months. We focused on factors that can be addressed in the context of an accessible intervention that targets individual behavior change.
Methods
This secondary analysis pools data from the subset of SCI participants who enrolled in a 12-month RCT of the GLB-AIM. Participants were randomized to receive the intervention immediately (Group 1) or to a wait-list control that received it after a 6-month delay (Group 2). Primary RCT outcomes have been published elsewhere.34 This analysis combines groups and uses data collected from August 2015 to February 2017 in lab-based visits at study baseline (survey), each group’s baseline to initiate the intervention (weight), and after the 12-month intervention period for each group (survey and weight).
GLB-AIM Intervention
This group-based ILI targets 5% to 7% weight loss through limiting daily caloric intake and increasing time spent in weekly physical activity to achieve an energy deficit. The GLB-AIM encourages participants to adopt a moderate calorie and moderate fat diet and to progressively increase exercise to meet American College of Sports Medicine and American Heart Association recommendations of 150 minutes per week.35 Based on Social Cognitive Theory principles,36 the program targets behavior change primarily through daily goal-setting and self-monitoring of caloric intake and physical activity. Trained lifestyle coaches led 13 weekly core sessions, followed by three support sessions, occurring every other week, and seven monthly support sessions. Sessions teach skills to support these core behaviors, including adaptive cooking and exercise, problem solving, assertiveness, managing environmental cues, enlisting social support, and managing negative thinking and stress. To address transportation barriers, sessions were delivered as a combination of group-based conference calls (twelve 60-minute sessions) and monthly in-person meetings (eleven 90-minute sessions), where lifestyle coaches weighed participants using a wheelchair accessible scale to provide feedback on their weight loss efforts. Participants were asked to self-monitor fat and caloric intake over the first 13 weeks and share their logs with interventionists for feedback. A detailed description of all program sessions is available elsewhere.37
Participants
Recruitment occurred via physical medicine and rehabilitation outpatient clinics of two large medical centers in the Dallas-Fort Worth metropolitan area. Recruitment also included disseminating fliers to organizations serving individuals with mobility impairment, including independent living centers, durable medical equipment centers, and community organizations.
Participants were required to be ≥18 years old, have had impaired mobility for ≥1 year, be overweight based on BMI >22 for those with SCI (recommendation given injury-related changes in fat/muscle mass),15 and have sufficient upper arm mobility to exercise, access to a telephone, and physician clearance. Exclusion criteria included cognitive impairment that limited autonomy, medical issues where exercise is contraindicated, >75 years old, pregnant, or not fluent in English. The larger RCT included 66 participants from among 92 eligible individuals with mobility impairment from various etiologies (e.g., multiple sclerosis, arthritis). The local institutional review board approved the study, and staff obtained informed consent in person at the baseline assessment. Participants received gift cards for attending testing sessions (maximum $100–$150 depending on group assignment) and tools for measuring foods and exercise aids (arm ergometer, TheraBand, DVD).
Independent variables
We assessed a variety of potential barriers and facilitators consistent with Social Cognitive Theory’s central tenets of reciprocal determinism (i.e., that personal factors, behavior, and environment are mutually influential) and primacy of self-efficacy (confidence in one’s ability to perform a behavior).36
Barriers assessed at study baseline included potentially relevant domains from International Classification of Functioning38 components of body function, activities and participation, and personal factors. Measures of body function included self-rated physical function limitations, secondary conditions, and bodily pain. Activities and participation included limitations in daily activities and preparing/eating meals. Table 1 presents construct operationalizations, measures, scoring, and reliability and validity information. In brief, physical function limitation was measured by the SF-36 Enabled Version Physical Functioning subscale,39 pain was measured by the SF-36 Bodily Pain subscale, conditions secondary to SCI were self-reported and summed, limitation preparing and eating meals was measured by the LIFE-H40,41 Diet and Meal Preparation subscale, and daily activity limitation was measured by LIFE-H Daily Activity subscale.
Table 1.
Barriers and facilitators measured at study baseline
| Domain/level | Construct | Operationalization | Measure | Items and scoring | Reliability and validity |
|---|---|---|---|---|---|
| Barriers | |||||
| Body function | Physical function limitations | Degree of limitation while performing physical tasks with one’s usual assistive device (e.g., wheelchair) | Medical Outcomes Study Short Form (SF-36) Enabled Version, Physical Functioning subscale | 10 items averaged to obtain a score ranging from 0 to 100, with higher scores corresponding with better function | The SF-36 was found to have high internal consistency and construct validity among 215 people with SCI, with reliability across the 8 health scales ranging from 0.76 to 0.90; no significant correlation was found between the Mental and Physical Component Summaries.63The enabled version used here was found to achieve similar results as the original SF-36 (ICCs were above 0.60 for all scales and summary scales across the 2 versions), while avoiding terms like “walking” and “climbing.”39 |
| Bodily pain | Frequency of bodily pain and perceived level of interference with normal work | SF-36 Enabled Version, Bodily Pain subscale | 2 items averaged to obtain a score ranging from 0 to 100, with higher scores corresponding with better function/less pain | ||
| Secondary conditions | Occurrence of health conditions related to SCI in the year prior to the study: pressure injuries, urinary tract infections, bowel incontinence, kidney stones, bone fracture, autonomic dysreflexia, and edema | Sum of health conditions related to SCI that an individual reported experiencing in the year before starting the study | Sample ranged from 0 to 12 instances occurring over the previous year | N/A | |
| Activities and participation | Limitations in daily activity | Ratings of difficulty and need for assistance with performing activities of daily living such as dressing, preparing and eating meals, maintaining physical fitness, shopping, working, etc. | Assessment of Life Habits (LIFE-H) General Short Form, Daily Activities subscale | Sum of 10 items comprising the LIFE-H Daily Activities life habits scale. Score ranges from 0 to 90. Higher scores correspond with higher levels of difficulty and need for assistance. | The LIFE-H was developed as a measure of participation among people with physical disabilities.40 The LIFE-H has shown acceptable internal consistency in adults and children with ICCs > 0.5 for each life habit domain, and good test–retest reliability among adults with spinal cord injury (ICC = 0.74).40 |
| Limitations preparing/eating meals | Ratings of difficulty and need for assistance with tasks related to preparing and eating meals | LIFE-H General Long Form Version 3.0, Diet and Meal Preparation subscale | Sum of 7 items comprising the LIFE-H Diet and Meal Preparation life habits scale. Score ranges from 0 to 63. Higher scores correspond with higher levels of difficulty and need for assistance. | ||
| Facilitators | |||||
| Personal factors | Self-efficacy for health behaviors | Confidence in one’s ability to perform healthy behaviors such as maintain an exercise routine, manage stress levels, find a doctor, etc. | Self-Rated Abilities for Health Practices Scale (SRAHP) | We used 27 of 28 items and summed scores for a total score range of 0 to 108, omitting an item on toothbrushing that did not load onto the nutrition subscale in factor analysis.4 Higher scores indicate higher levels of self-efficacy. | The SRAHP has demonstrated high internal consistency across scales (Cronbach’s alpha ranged from .77 to .91) for a sample with disabilities and good content, discriminant, and convergent validity.42 |
| Nutrition self-efficacy | Confidence in one’s ability to maintain a healthy diet, including selecting, purchasing, and eating healthy foods | Self-Rated Abilities for Health Practices Scale (SRAHP), Nutrition subscale | Sum of 6 out of the 7 items from the Nutrition Subscale (omitting the toothbrushing item) with a score range of 0 to 24. Higher scores indicate higher levels of self-efficacy. | ||
| Activities and participation | Social participation | Ability to use transportation, participate in groups and activities, carry out responsibilities and activities related to maintaining social relationships and volunteering, etc. | LIFE-H Social Roles subscale | Sum of 5 items comprising the LIFE-H Social Roles subscale. Score ranges from 0 to 40. Higher scores correspond with higher levels of difficulty and need for assistance. | See LIFE-H description above. |
Note: ICC = intraclass correlation coefficient.
Table 1.
Barriers and facilitators measured at study baseline
| Domain/level | Construct | Operationalization | Measure | Items and scoring | Reliability and validity |
|---|---|---|---|---|---|
| Barriers | |||||
| Body function | Physical function limitations | Degree of limitation while performing physical tasks with one’s usual assistive device (e.g., wheelchair) | Medical Outcomes Study Short Form (SF-36) Enabled Version, Physical Functioning subscale | 10 items averaged to obtain a score ranging from 0 to 100, with higher scores corresponding with better function | The SF-36 was found to have high internal consistency and construct validity among 215 people with SCI, with reliability across the 8 health scales ranging from 0.76 to 0.90; no significant correlation was found between the Mental and Physical Component Summaries.63The enabled version used here was found to achieve similar results as the original SF-36 (ICCs were above 0.60 for all scales and summary scales across the 2 versions), while avoiding terms like “walking” and “climbing.”39 |
| Bodily pain | Frequency of bodily pain and perceived level of interference with normal work | SF-36 Enabled Version, Bodily Pain subscale | 2 items averaged to obtain a score ranging from 0 to 100, with higher scores corresponding with better function/less pain | ||
| Secondary conditions | Occurrence of health conditions related to SCI in the year prior to the study: pressure injuries, urinary tract infections, bowel incontinence, kidney stones, bone fracture, autonomic dysreflexia, and edema | Sum of health conditions related to SCI that an individual reported experiencing in the year before starting the study | Sample ranged from 0 to 12 instances occurring over the previous year | N/A | |
| Activities and participation | Limitations in daily activity | Ratings of difficulty and need for assistance with performing activities of daily living such as dressing, preparing and eating meals, maintaining physical fitness, shopping, working, etc. | Assessment of Life Habits (LIFE-H) General Short Form, Daily Activities subscale | Sum of 10 items comprising the LIFE-H Daily Activities life habits scale. Score ranges from 0 to 90. Higher scores correspond with higher levels of difficulty and need for assistance. | The LIFE-H was developed as a measure of participation among people with physical disabilities.40 The LIFE-H has shown acceptable internal consistency in adults and children with ICCs > 0.5 for each life habit domain, and good test–retest reliability among adults with spinal cord injury (ICC = 0.74).40 |
| Limitations preparing/eating meals | Ratings of difficulty and need for assistance with tasks related to preparing and eating meals | LIFE-H General Long Form Version 3.0, Diet and Meal Preparation subscale | Sum of 7 items comprising the LIFE-H Diet and Meal Preparation life habits scale. Score ranges from 0 to 63. Higher scores correspond with higher levels of difficulty and need for assistance. | ||
| Facilitators | |||||
| Personal factors | Self-efficacy for health behaviors | Confidence in one’s ability to perform healthy behaviors such as maintain an exercise routine, manage stress levels, find a doctor, etc. | Self-Rated Abilities for Health Practices Scale (SRAHP) | We used 27 of 28 items and summed scores for a total score range of 0 to 108, omitting an item on toothbrushing that did not load onto the nutrition subscale in factor analysis.4 Higher scores indicate higher levels of self-efficacy. | The SRAHP has demonstrated high internal consistency across scales (Cronbach’s alpha ranged from .77 to .91) for a sample with disabilities and good content, discriminant, and convergent validity.42 |
| Nutrition self-efficacy | Confidence in one’s ability to maintain a healthy diet, including selecting, purchasing, and eating healthy foods | Self-Rated Abilities for Health Practices Scale (SRAHP), Nutrition subscale | Sum of 6 out of the 7 items from the Nutrition Subscale (omitting the toothbrushing item) with a score range of 0 to 24. Higher scores indicate higher levels of self-efficacy. | ||
| Activities and participation | Social participation | Ability to use transportation, participate in groups and activities, carry out responsibilities and activities related to maintaining social relationships and volunteering, etc. | LIFE-H Social Roles subscale | Sum of 5 items comprising the LIFE-H Social Roles subscale. Score ranges from 0 to 40. Higher scores correspond with higher levels of difficulty and need for assistance. | See LIFE-H description above. |
Note: ICC = intraclass correlation coefficient.
Throughout the 12-month intensive intervention, participants discussed barriers and facilitators with lifestyle coaches during formal sessions as part of the curriculum and in other study contacts (e.g., scheduling phone calls). To assess frequency of these factors across the study sample, the study team developed a battery of 18 specific barriers (Table 3; organized by ICF components). These barriers were assessed at 12 months in a postintervention survey that asked participants to assess each potential issue as follows: “Please rate how much the barriers listed below kept you from participating in GLBAIM lifestyle change activities over the past year.” Participants rated each barrier on a scale of 1 (not at all) to 5 (totally). Because some participants responded “not applicable” (N/A), we dichotomized responses such that N/A, 1 (not at all) or 2 (a little) were coded as no barrier (0), and responses of ≥3 (some, a lot, totally) were coded as a barrier (1).
Table 3.
Participant responses to barrier and facilitator items at baseline and 12-month exit surveys and engagement and percent weight change outcomes
| Baseline measures (score range) | n | M | SD |
|---|---|---|---|
| Barriers | |||
| Body function | |||
| Secondary conditions | 31 | 0.61 | 0.38 |
| Physical function limitations (0–100) | 31 | 32.36 | 10.70 |
| Bodily pain (0–100) | 30 | 44.39 | 11.83 |
| Activities and participation | |||
| Limitations in daily activity (0–90) | 30 | 47.70 | 16.64 |
| Limitations preparing/eating meals (0–72) | 28 | 45.04 | 14.37 |
| Facilitators | |||
| Activities and participation | |||
| Social participation (0–45) | 30 | 28.60 | 10.38 |
| Personal factors | |||
| Self-efficacy for health behaviors (0–112) | 30 | 74.47 | 20.18 |
| Nutrition self-efficacy (0–24) | 30 | 14.73 | 6.53 |
| 12-month measures (n = 22) | n | % | |
| Barriers | |||
| Body function | |||
| SCI-related health issues (e.g., UTI) | 11 | 50.00 | |
| Pain | 7 | 31.82 | |
| Mental health issues (e.g., depression) | 5 | 22.73 | |
| Lack of hunger sensation | 3 | 13.64 | |
| Other health issues (e.g., cold, flu) | 2 | 9.09 | |
| Activities and participation | |||
| Difficulty preparing healthy foods | 11 | 50.00 | |
| Relationship issues | 8 | 36.36 | |
| Employment issues | 4 | 18.18 | |
| Personal factors | |||
| Lack of motivation | 9 | 40.91 | |
| Not reaching my goals | 9 | 40.91 | |
| Relationship issues | 8 | 36.36 | |
| Adjusting to disability | 6 | 27.27 | |
| Negative thoughts | 5 | 22.73 | |
| Difficulty getting enough calories | 3 | 13.64 | |
| Environmental factors | |||
| Transportation | 6 | 27.27 | |
| Access to healthy food | 6 | 27.27 | |
| Money problems | 4 | 18.18 | |
| Other issues | 4 | 18.18 | |
| Technology issues | 1 | 4.55 | |
| Facilitators: Sources of social support | |||
| Spouse/significant other | 12 | 54.55 | |
| Family | 11 | 50.00 | |
| Friends | 11 | 50.00 | |
| Healthcare provider | 10 | 45.45 | |
| Caregiver | 7 | 31.82 | |
| Religious/spiritual community | 7 | 31.82 | |
| People at your gym | 7 | 31.82 | |
| n | M | SD | |
| Total barriers reported (0–18) | 22 | 4.73 | 3.35 |
| Social support sum scale (0–7) | 2.95 | 2.15 | |
| Outcome measures (n = 22) | n | M | SD |
| Engagement, full sample (0–36) | 31 | 20.23 | 10.74 |
| Engagement, completers (0–36) | 22 | 24.60 | 9.09 |
| Weight change, completers, kg | 20 | −5.03 | 8.58 |
| Weight change, completers, % | 20 | −4.14 | 6.53 |
Note: UTI = urinary tract infection.
Facilitators assessed at study baseline included self-efficacy for healthy behaviors, measured by the Self-Rated Abilities for Health Practices (SRAHP) scale,42 nutrition self-efficacy measured by the SRAHP nutrition subscale,42 and social participation measured by the LIFE-H43–45 Social Roles subscale.
Facilitators identified during the course of intervention and assessed in the 12-month postintervention survey included social support for GLB-AIM lifestyle change activities from seven sources (full list in Table 3) that include spouse/significant other, family, friends, etc. Participants rated each source of social support on a helpfulness scale from 1 (very unhelpful) to 5 (very helpful). We dichotomized responses such that N/A or scores ≤3 (very unhelpful, mostly unhelpful, no opinion) were coded as no facilitator (0), and responses >3 (mostly helpful, very helpful) were coded as facilitator (1).
Dependent variables
These outcomes reflect participant engagement and weight change over the 12-month program. Program engagement reflects participants’ program involvement over the year, based on their (a) attendance to the 23 sessions and (b) dietary self-monitoring over the 13 core sessions. Participants received one point for each session attended, and one point for each food log returned >50% complete, for a total score range of 0 to 36. Percent weight change was calculated by subtracting weight at intervention initiation from weight after 12 months of intervention, divided by weight at initiation, and multiplied by 100. Participants were weighed on a Seca platform scale (model #672), with their wheelchair weight and/or other assistive devices (e.g., ankle-knee orthosis) subtracted from their total weight. Weight was measured twice and the average recorded unless they differed by more than 1 kg, then weight was measured again and all three averaged.
Data analysis
Descriptive statistics examined socio-demographic and injury characteristics, including age, sex, level of injury, years living with disability, age at injury, race/ethnicity, education level, marital status, employment status, and self-reported health issues, and Fisher’s exact tests examined differences between study completers and those who did not complete the study.
Least squares linear regression examined the barriers and facilitators significantly associated with intervention engagement and weight change. For engagement, two models examined associations in (1) the full sample, including those lost to follow-up, using independent variables measured at baseline, and (2) those who completed postintervention surveys (completers), using independent variables measured at baseline or after 12 months of intervention. We excluded observations where the independent or dependent variables were missing. Barriers and facilitators significantly associated with each outcome at p < .05 in bivariate analyses were included in the multivariable model. Where variables were highly correlated (p ≥ .5), we included only the variable most strongly associated with each outcome. Models also controlled for intervention group, given a protocol change that more strongly facilitated electronic self-monitoring in Group 2. Statistical significance was defined as p < .05. All analyses were conducted in SAS version 9.4 (SAS Institute, Cary, NC).
Results
Study sample
Participants with SCI (n = 31) were middle aged (48.26 ± 11.01 years old) (Table 2), nearly equally split between men and women (48.39% vs 51.61%), and predominantly non-Hispanic White (80.65%); three-quarters (77.42%) attended at least some college, and two-thirds were unemployed (64.52%). There were no significant differences between study completers and noncompleters.
Table 2.
Participant characteristics at baseline
| All participants (N = 31) | Completers (n = 22) | Non-completers (n = 9) | |||||
|---|---|---|---|---|---|---|---|
| Variables | M | SD | M | SD | M | SD | p |
| Age, years | 48.26 | 11.01 | 48.72 | 11.19 | 47.13 | 11.14 | 0.593 |
| Age at injury, years | 32.97 | 13.51 | 34.13 | 13.73 | 30.13 | 13.29 | 0.480 |
| Time with injury, years | 15.29 | 12.41 | 14.59 | 12.55 | 17 | 12.63 | 0.708 |
| BMI | 33.2 | 6.46 | 33.83 | 6.82 | 31.68 | 5.54 | 0.273 |
| Body weight, pounds | 224.55 | 54.44 | 230.34 | 59.21 | 210.38 | 39.88 | 0.480 |
| Waist circumference, inches | 45.23 | 6.77 | 46.46 | 7.34 | 42.24 | 4 | 0.111 |
| n | % | n | % | n | % | p | |
| Group assignment | 0.456 | ||||||
| 1 (intervention) | 14 | 0.00 | 11 | 50.00 | 3 | 0.00 | |
| 2 (wait-list control) | 17 | 0.00 | 11 | 50.00 | 6 | 0.00 | |
| Injury type | 0.693 | ||||||
| Paraplegia | 17 | 54.84 | 13 | 59.09 | 4 | 44.44 | |
| Tetraplegia | 14 | 45.16 | 9 | 40.91 | 5 | 55.56 | |
| Sex | 0.704 | ||||||
| Male | 15 | 48.39 | 10 | 45.45 | 5 | 55.56 | |
| Female | 16 | 51.61 | 12 | 54.55 | 4 | 44.44 | |
| Hispanic ethnicity | 2 | 6.45 | 2 | 9.09 | 0 | 0.00 | 0.089 |
| Race | 0.344 | ||||||
| White | 25 | 80.65 | 19 | 86.36 | 6 | 66.67 | |
| Black/AA | 4 | 12.90 | 2 | 9.09 | 2 | 22.22 | |
| Other | 2 | 6.45 | 1 | 4.55 | 1 | 11.11 | |
| Marital status | 0.693 | ||||||
| Single/separated/divorced | 14 | 45.16 | 9 | 40.91 | 5 | 55.56 | |
| Married/living with partner | 17 | 54.84 | 13 | 59.09 | 4 | 44.44 | |
| Education | 0.161 | ||||||
| High school or below | 7 | 22.58 | 4 | 18.18 | 3 | 33.33 | |
| Some college/associates | 9 | 29.03 | 5 | 22.73 | 4 | 44.44 | |
| Bachelors | 8 | 25.81 | 8 | 36.36 | 0 | 0.00 | |
| Some post-grad/master's | 7 | 22.58 | 5 | 22.73 | 2 | 22.22 | |
| Employment status | 1.000 | ||||||
| Employed | 11 | 35.48 | 8 | 36.36 | 3 | 33.33 | |
| Unemployed | 14 | 45.16 | 10 | 45.45 | 4 | 44.44 | |
| Student/homemaker/retired | 6 | 19.35 | 4 | 18.18 | 2 | 22.22 | |
| Diabetes diagnosis | 3 | 9.68 | 3 | 13.64 | 0 | 0.00 | 0.538 |
Note: AA = African American; BMI = body mass index.
The 12-month retention rate was 71% (n = 22/31). Reasons for participants not completing the study are provided in the CONSORT diagram (Figure 1). Of the 22 who completed postintervention surveys, pressure injuries prevented two from returning for weight measurement. There were no significant differences between study completers and noncompleters in sociodemographic or injury characteristics.
Figure 1.
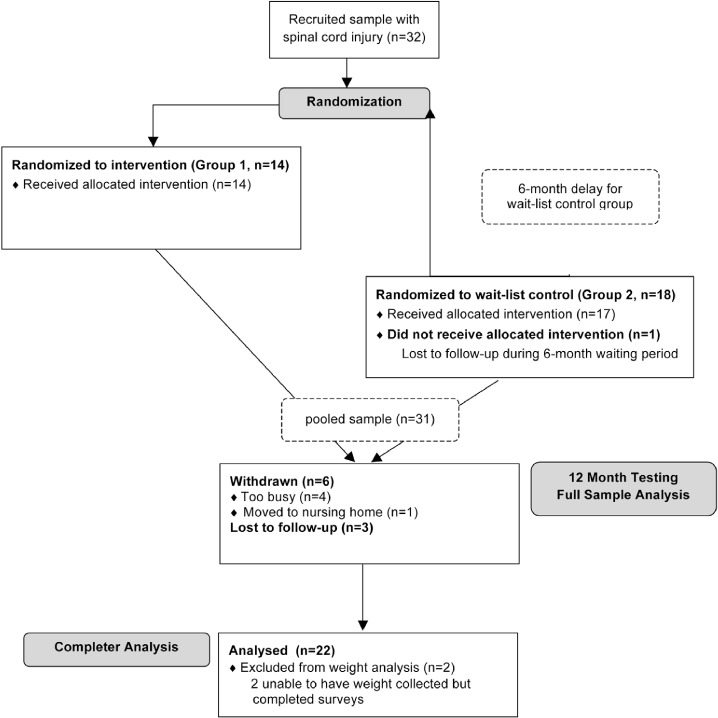
CONSORT flow diagram.
Barriers and facilitators of intervention engagement
Table 3 presents mean scores for scales and percent endorsed for dichotomous variables. Participants’ mean engagement (n = 31) was 20.23 ± 10.74 on a 36-point scale. In the final adjusted model (Table 4) for engagement in the full sample (n = 30), higher nutrition self-efficacy significantly predicted higher intervention engagement, accounting for 26% of the variance (p < .01, sr2 = 0.26). In the final model for intervention completers (n = 22), those who reported relationship issues at 12 months had significantly lower engagement, with this factor explaining 23% of variance (p = .02, sr2 = 0.23). No other barriers or facilitators were significant for engagement in either the full sample or completers.
Table 4.
Results of linear regression models predicting engagement and percent weight change
| Model 1: Predictors of intervention engagement in full sample (n= 30) | Model 2: Correlates of intervention engagement in completers (n= 22) | |||||||||||
| Variables | B | SE(B) | 95% CI | sr2 | p | B | SE(B) | 95% CI | sr2 | p | ||
| Intercept | 0.82 | 7.04 | −13.63 | 15.27 | .908 | 20.73 | 5.57 | 9.08 | 32.38 | .076 | ||
| Facilitator: SRAHP nutrition | 0.86 | 0.27 | 0.30 | 1.41 | 0.04 | .004** | ||||||
| Barrier: Relationship issues | −8.75 | 3.56 | −16.20 | −1.30 | 0.23 | .024* | ||||||
| Group assignment | 4.40 | 3.48 | −2.75 | 11.55 | 0.26 | .217 | 4.18 | 3.42 | −2.99 | 11.35 | 0.06 | .237 |
| Model 3: Correlates of percent weight change in completers (n= 20) | Model statistics | |||||||||||
| Variables | B | SE(B) | 95% CI | sr2 | p | R2 | Adj. R2 | F | p for model | |||
| Intercept | −8.07 | 3.47 | −15.48 | −0.67 | .035 | Model 1 | 0.29 | 0.24 | 5.62 | .009** | ||
| Barrier: Other health issues | 4.63 | 3.56 | −2.97 | 12.22 | 0.04 | .214 | Model 2 | 0.28 | 0.21 | 3.77 | .042* | |
| Barrier: Money problems | 3.88 | 2.65 | −1.77 | 9.53 | 0.05 | .164 | Model 3 | 0.66 | 0.57 | 7.19 | .002** | |
| Barrier: Lack of motivation | 7.34 | 2.27 | 2.49 | 12.19 | 0.24 | .006** | ||||||
| Group assignment | −0.16 | 2.02 | −4.46 | 4.13 | 0.00 | .936 | ||||||
Note: SRAHP = Self-Rated Abilities for Health Practices scale.
*Significance at p< .05.
**Significance at p< .01
Barriers and facilitators of weight loss
Completers with a final weight recorded (n = 20/22) achieved a mean weight loss of 5.03 ± 8.58 kg and their average percent 12-month weight change was −4.14% ± 6.53%. The final adjusted regression model for weight loss included barriers of other health issues (i.e., not SCI-related), money problems, and lack of motivation and significantly explained 56.6% of variance (F = 7.19, p < .01, adjusted R2 = 0.57, R2 = 0.66). Only lack of motivation was significantly associated with weight change (p < .01). Those reporting lack of motivation achieved less weight loss or gained weight, with this factor accounting for 24% of the variance (sr2 = 0.24).
Discussion
Our study is one of the first to identify key barriers and facilitators of engagement and weight loss in an ILI among individuals with SCI. Notably, those who completed the GLB-AIM achieved an average weight loss of approximately 4% at 1 year, which was significant but below the recommended 5%. Three significant factors emerged as barriers or facilitators — nutrition self-efficacy, relationship issues, and lack of motivation. Notably, all three factors are commonly reported in studies of weight loss in the general population.46–50 This is consistent with focus group findings in participants with SCI after a dietary intervention, who reported lack of motivation as a key barrier to diet adherence,28 and findings of individuals with amputation,51 which highlighted weight loss barriers of lack of money and unsupportive people. This suggests that the GLB-AIM successfully addressed many disability-specific concerns and reflects the reality that weight loss is challenging for everyone. The results support modifying the intervention to promote greater weight loss and further investigating how SCI individuals attempting weight loss experience these barriers and facilitators while participating in ILI.
Participants with greater confidence for healthy eating at baseline had significantly higher intervention engagement, yet this factor was not significant among the completers at 12 months, suggesting that low self-efficacy may have contributed to dropout. The GLB-AIM program relies heavily upon participants engaging in daily self-monitoring of dietary intake. As skill-building may increase self-efficacy,36,52,53 participants who report low initial self-efficacy may benefit from additional early support for dietary change to improve adherence. Support could include supplemented meals, meal plans, facilitated cooking or grocery shopping experiences, and/or a stepped approach to self-monitoring. Notably, self-monitoring has been reported as the most common barrier to weight loss by half54,55 to three-quarters56 of participants in ILI programs.
More than a third of participants who completed the 1-year study reported relationship issues as a barrier to program engagement. Relationship issues were a barrier to weight loss in bivariate analysis (ρ = .40, p = .08, data not shown), though it was not included in the weight change model because it correlated with lack of motivation (ρ = 0.52, p = .01), an even stronger barrier to weight loss. Relational issues are common in weight loss,46,47,57,58 and focus groups with individuals with SCI and caregivers have identified relationships as a key factor in promoting long-term health.59 The GLBAIM addresses relational challenges, including those with caregivers, and family members were invited to attend sessions. Further attention to this topic, such as reducing burnout in caregivers and facilitating access to counseling, may be appropriate for SCI participants.
Lack of motivation was the strongest barrier to weight loss, accounting for almost a fourth of the variance. This 12-month ILI is longer than others conducted in people with SCI.25–27,60 Sustained weight loss is challenging; national studies show that only roughly 20% of those who lose 10% of their body weight maintain the loss for 12 months.61 Qualitative research suggests that internal motivation is key to maintaining an initial loss for 6 months or longer.48 The GLB-AIM addresses motivation through theory-based methods such as personal reflection, enlisting social support, planning rewards, and public commitment. Monitoring participants’ motivation toward program goals throughout the 12-month intervention may provide additional insight into motivation change over time and facilitate timely, tailored implementation of strategies to enhance motivation, such as motivational interviewing or peer accountability. In our sample, lack of motivation was associated with adjusting to diagnosis (ρ = 0.53, p = .01) and negative thoughts (ρ = 0.43, p = .04) in bivariate analyses (data not shown), in addition to relationship issues. These barriers may drive motivational decline and require additional attention.
Several study limitations should be noted. The small sample of predominantly non-Hispanic White participants limited statistical power and generalizability. Results may not be generalizable to minorities or weight loss programs that are less intensive, shorter duration, or do not address common barriers facing persons with mobility impairment (e.g., transportation). Barriers and facilitators assessed at 12 months could only be examined in the subset who completed surveys (n = 22/31). Yet because these factors were assessed at the same time as 12-month weight loss, knowledge of the outcome may have influenced participant responses. We dichotomized responses to maximize use of available data in our small sample; however doing so may have decreased the ability to detect the influence of some barriers that exist on a continuum.62 Additionally, exit survey items were not validated measures, thus our exploratory findings should be viewed as preliminary. Given our focus on individually targeted intervention, potentially important ecological factors (e.g., sidewalk accessibility, distance to a fitness center) were not assessed.62 However, including emergent barriers and facilitators that occurred during intervention implementation helped ensure that the most salient factors in this context were included.
Conclusion
This study identified nutrition self-efficacy, relationship issues, and lack of motivation as critical barriers and facilitators for people with SCI who enrolled in a 1-year ILI. Future research should assess dimensions and drivers of these constructs in people with SCI and explore acceptability of evidence-based approaches to address them.
Footnotes
Financial Support
The trial that served as the basis for this analysis was funded by the Disability and Research Dissemination Center (DRDC) through its grant no. 5U01DD001007, FAIN no. U01DD001007 from the Centers for Disease Control and Prevention (CDC). Ms. Betts was also supported by a predoctoral fellowship, University of Texas Health Science Center at Houston (UTHealth), School of Public Health Cancer Control Research Training Program (National Cancer Institute/NIH grant T32 CA057712).
Disclaimer
The content is solely the responsibility of the authors and does not necessarily represent the official views of the DRDC, CDC, NCI, or NIH.
Conflicts of Interest
The authors report no conflicts of interest.
REFERENCES
- 1.Weaver FM, Collins EG, Kurichi J et al. Prevalence of obesity and high blood pressure in veterans with spinal cord injuries and disorders. Am J Phys Med Rehabil. 2007;86(1):22–29. doi: 10.1097/phm.0b013e31802b8937. [DOI] [PubMed] [Google Scholar]
- 2.Gupta N, White KT, Sandford PR. Body mass index in spinal cord injury – a retrospective study. Spinal Cord. 2006;44:92–94. doi: 10.1038/sj.sc.3101790. [DOI] [PubMed] [Google Scholar]
- 3.Johnston MV, Diab ME, Chu BC, Kirshblum S. Preventive services and health behaviors among people with spinal cord injury. J Spinal Cord Med. 2005;28(1):43–54. doi: 10.1080/10790268.2005.11753797. [DOI] [PubMed] [Google Scholar]
- 4.Wen H, Chen Y, He Y, Bickel CS, Robinson-Whelen S, Heinemann AW. Racial differences in weight gain: a 5-year longitudinal study of persons with spinal cord injury. Arch Phys Med Rehabil. 2018;99(10):1957–1964. doi: 10.1016/j.apmr.2017.11.005. [DOI] [PubMed] [Google Scholar]
- 5.Gorgey A, Gater D. Prevalence of obesity after spinal cord injury. Top Spinal Cord Inj Rehabil. 2007;12(4):1–7. doi: 10.1310/sci1204-1. [DOI] [PMC free article] [PubMed] [Google Scholar]
- 6.Bauman WA, Spungen AM. Coronary heart disease in individuals with spinal cord injury: assessment of risk factors. Spinal Cord. 2008;46:466–476. doi: 10.1038/sj.sc.3102161. [DOI] [PubMed] [Google Scholar]
- 7.Bauman WA, Spungen AM. Metabolic changes in persons with spinal cord injury. Phys Med Rehabil Clin North Am. 2000;11:109–140. [PubMed] [Google Scholar]
- 8.Bauman WA, Spungen AM. Carbohydrate and lipid metabolism in chronic spinal cord injury. J Spinal Cord Med. 2001;24(4):266–277. doi: 10.1080/10790268.2001.11753584. [DOI] [PubMed] [Google Scholar]
- 9.Gater DR, Jr, Farkas GJ, Berg AS, Castillo C. Prevalence of metabolic syndrome in veterans with spinal cord injury. J Spinal Cord Med. 2019;42(1):86–93. doi: 10.1080/10790268.2017.1423266. [DOI] [PMC free article] [PubMed] [Google Scholar]
- 10.Gater DR., Jr Obesity after spinal cord injury. Phys Med Rehabil Clin N Am. 2007;18(2):333–351. doi: 10.1016/j.pmr.2007.03.004. [DOI] [PubMed] [Google Scholar]
- 11.Gorgey AS, Martin H, Metz A, Khalil RE, Dolbow DR, Gater DR. Longitudinal changes in body composition and metabolic profile between exercise clinical trials in men with chronic spinal cord injury. J Spinal Cord Med. 2016;39(6):699–712. doi: 10.1080/10790268.2016.1157970. [DOI] [PMC free article] [PubMed] [Google Scholar]
- 12.Groah S, Nash MS, Ward EA et al. Cardiometabolic risk in community-dwelling persons with chronic spinal cord injury. J Cardiopulm Rehabil Prev. 2011;31:73–80. doi: 10.1097/HCR.0b013e3181f68aba. [DOI] [PubMed] [Google Scholar]
- 13.Liusuwan A, Widman L, Abresch T, McDonald CM. Altered body composition affects resting energy expenditure and interpretation of body mass index in chiloren with spinal cord injury. J Spinal Cord Med. 2004;27(suppl 1):S24–S28. doi: 10.1080/10790268.2004.11753781. [DOI] [PubMed] [Google Scholar]
- 14.Maggioni M, Bertoli S, Margonato V, Merati G, Veicsteinas A, Testolin G. Body composition assessment in spinal cord injury subjects. Acta Diabetol. 2003;40(suppl 1):S183–186. doi: 10.1007/s00592-003-0061-7. [DOI] [PubMed] [Google Scholar]
- 15.Buchholz AC, Bugaresti JM. A review of body mass index and waist circumference as markers of obesity and coronary heart disease risk in persons with chronic spinal cord injury. Spinal Cord. 2005;43(9):513–518. doi: 10.1038/sj.sc.3101744. [DOI] [PubMed] [Google Scholar]
- 16.Laughton GE, Buchholz AC, Martin Ginis KA, Goy RE, Group SSR. Lowering body mass index cutoffs better identifies obese persons with spinal cord injury. Spinal Cord. 2009;47(10):757–762. doi: 10.1038/sc.2009.33. [DOI] [PubMed] [Google Scholar]
- 17.Nash MS, Groah SL, Gater DR, Jr et al. Identification and management of cardiometabolic risk after spinal cord injury: clinical practice guideline for health care providers. Top Spinal Cord Inj Rehabil. 2018;24(4):379–423. doi: 10.1310/sci2404-379. [DOI] [PMC free article] [PubMed] [Google Scholar]
- 18.Grundy SM. Metabolic syndrome scientific statement by the American Heart Association and the National Heart Lung and Blood Institute. American Heart Association; 2005. [DOI] [PubMed] [Google Scholar]
- 19.Grundy SM, Cleeman JI, Daniels SR et al. Diagnosis and management of the metabolic syndrome: an American Heart Association/National Heart, Lung, and Blood Institute Scientific Statement. Circ J. 2005;112(17):2735–2752. doi: 10.1161/CIRCULATIONAHA.105.169404. [DOI] [PubMed] [Google Scholar]
- 20.Locatelli SM, LaVela SL. Documentation of weight management practices for individuals with spinal cord injuries and disorders. Spinal Cord. 2016;54(12):1176–1182. doi: 10.1038/sc.2016.59. [DOI] [PubMed] [Google Scholar]
- 21.Locatelli SM, Gerber BS, Goldstein B, Weaver FM, LaVela SL. Health care provider practices, barriers, and facilitators for weight management for individuals with spinal cord injuries and disorders. Top Spinal Cord Inj Rehabil. 2014;20(4):329–337. doi: 10.1310/sci2004-329. [DOI] [PMC free article] [PubMed] [Google Scholar]
- 22.Neto FR, Lopes GH. Body composition modifications in people with chronic spinal cord injury after supervised physical activity. J Spinal Cord Med. 2011;34(6):586–593. doi: 10.1179/2045772311Y.0000000038. [DOI] [PMC free article] [PubMed] [Google Scholar]
- 23.Gorla JI, Costa E Silva ADA, Borges M et al. Impact of wheelchair rugby on body composition of subjects with tetraplegia: a pilot study. Arch Phys Med Rehabil. 2016;97(1):92–96. doi: 10.1016/j.apmr.2015.09.007. [DOI] [PubMed] [Google Scholar]
- 24.Kim DI, Lee H, Lee BS, Kim J, Jeon JY. Effects of a 6-week indoor hand-bike exercise program on health and fitness levels in people with spinal cord injury: a randomized controlled trial study. Arch Phys Med Rehabil. 2015;96(11):2033–2040. e2031. doi: 10.1016/j.apmr.2015.07.010. [DOI] [PubMed] [Google Scholar]
- 25.Radomski M, Finkelstein M, Hagel S, Masemer S, Theis J, Thompson M. A pilot wellness and weight management program for individuals with spinal cord injury: participants’ goals and outcomes. Top Spinal Cord Inj Rehabil. 2011;17(2):59–69. [Google Scholar]
- 26.Chen Y, Henson S, Jackson A, Richards J. Obesity intervention in persons with spinal cord injury. Spinal Cord. 2006;44(2):82–91. doi: 10.1038/sj.sc.3101818. [DOI] [PubMed] [Google Scholar]
- 27.Bigford GE, Mendez AJ, Betancourt L, Burns-Drecq P, Backus D, Nash MS. A lifestyle intervention program for successfully addressing major cardiometabolic risks in persons with SCI: a three-subject case series. Spinal Cord Ser Cases. 2017;3:17007. doi: 10.1038/scsandc.2017.7. [DOI] [PMC free article] [PubMed] [Google Scholar]
- 28.Bailey KA, Lenz K, Allison DJ, Ditor DS. Barriers and facilitators to adhering to an anti-inflammatory diet for individuals with spinal cord injuries. Health Psychol Open. 2018;5(2) doi: 10.1177/2055102918798732. 2055102918798732. [DOI] [PMC free article] [PubMed] [Google Scholar]
- 29.Scelza WM, Kalpakjian CZ, Zemper ED, Tate DG. Perceived barriers to exercise in people with spinal cord injury. Am J Phys Med Rehabil. 2005;84(8):576–583. doi: 10.1097/01.phm.0000171172.96290.67. [DOI] [PubMed] [Google Scholar]
- 30.Hwang EJ, Groves MD, Sanchez JN, Hudson CE, Jao RG, Kroll ME. Barriers to leisure-time physical activities in individuals with spinal cord injury. Occup Ther Health Care. 2016;30(3):215–230. doi: 10.1080/07380577.2016.1183180. [DOI] [PubMed] [Google Scholar]
- 31.Cowan RE, Nash MS, Anderson KD. Exercise participation barrier prevalence and association with exercise participation status in individuals with spinal cord injury. Spinal Cord. 2013;51(1):27–32. doi: 10.1038/sc.2012.53. [DOI] [PubMed] [Google Scholar]
- 32.Kramer MK, Kriska AM, Venditti EM et al. Translating the Diabetes Prevention Program: a comprehensive model for prevention training and program delivery. Am J Prev Med. 2009;37(6):505–511. doi: 10.1016/j.amepre.2009.07.020. [DOI] [PubMed] [Google Scholar]
- 33.Kramer MK, McWilliams JR, Chen HY, Siminerio LM. A community-based diabetes prevention program: evaluation of the group lifestyle balance program delivered by diabetes educators. Diabetes Educ. 2011;37(5):659–668. doi: 10.1177/0145721711411930. [DOI] [PubMed] [Google Scholar]
- 34.Froehlich-Grobe K, Betts AC, Driver S et al. The Group Lifestyle Balance Adapted for individuals with Impaired Mobility (GLB-AIM): outcomes of 6-month RCT and combined groups at 12 months. Am J Prev Med. 2020;59(6):805–817. doi: 10.1016/j.amepre.2020.06.023. [DOI] [PMC free article] [PubMed] [Google Scholar]
- 35.Haskell WL, Lee IM, Pate RR et al. Physical activity and public health: updated recommendation for adults from the American College of Sports Medicine and the American Heart Association. Circulation. 2007;116(9):1081–1093. doi: 10.1161/CIRCULATIONAHA.107.185649. [DOI] [PubMed] [Google Scholar]
- 36.Bandura A. Social Foundations of Thought and Action Social Cognitive Theory. Englewood Cliffs, NJ: Prentice Hall; 1986. [Google Scholar]
- 37.Betts AC, Froehlich-Grobe K. Accessible weight loss: adapting a lifestyle intervention for adults with impaired mobility. Disabil Health J. 2017;10(1):139–144. doi: 10.1016/j.dhjo.2016.06.004. [DOI] [PubMed] [Google Scholar]
- 38.World Health Organization International Classification of Functioning Disability and Health. Geneva: World Health Organization; 2001. [Google Scholar]
- 39.Froehlich-Grobe K, Andresen EM, Caburnay C, White GW. Measuring health-related quality of life for persons with mobility impairments: An enabled version of the short-form 36 (SF–36E) Qual Life Res. 2008;17(5):751–770. doi: 10.1007/s11136-008-9342-5. [DOI] [PubMed] [Google Scholar]
- 40.Fougeyrollas P, Noreau L, Bergeron H, Cloutier R, Dion SA, St-Michel G. Social consequences of long term impairments and disabilities: Conceptual approach and assessment of handicap. Int J Rehabil Res. 1998;21(2):127–141. doi: 10.1097/00004356-199806000-00002. [DOI] [PubMed] [Google Scholar]
- 41.Dumont C, Bertrand R, Fougeyrollas P, Gervais M. Rasch modeling and the measurement of social participation. J Appl Measure. 2003;4(4):309–325. [PubMed] [Google Scholar]
- 42.Becker H, Stuifenbergen A, Oh HS, Hall S. Self-rated abilities for health practices: a health self-efficacy measure. Health Values. 1993;17(5):42–50. [Google Scholar]
- 43.Fougeyrollas P. The influence of the social environment on the social participation of people with disabilities. In: Christiansen C, Baum C, editors. Occupational Therapy Enabling Function and Wellbeing. 2nd ed. Thorofare, NJ: SLACK Inc; 1997. pp. 379–390. [Google Scholar]
- 44.Fougeyrollas P, Noreau L, St-Michel G. Life Habits Measure – shortened version (LIFEH 30) Lac St-Charles; Quebec, Canada: 2001. [Google Scholar]
- 45.Noreau L, Desrosiers J, Robichaud L, Fougeyrollas P, Rochette A, Viscogliosi C. Measuring social participation: reliability of the LIFE-H in older adults with disabilities. Disabil Rehabil. 2004;26(6):346–352. doi: 10.1080/09638280410001658649. [DOI] [PubMed] [Google Scholar]
- 46.Hammarström A, Wiklund AF, Lindahl B, Larsson C, Ahlgren C. Experiences of barriers and facilitators to weight-loss in a diet intervention-a qualitative study of women in Northern Sweden. BMC Women's Health. 2014;14(1):59. doi: 10.1186/1472-6874-14-59. [DOI] [PMC free article] [PubMed] [Google Scholar]
- 47.Sobal J, Rauschenbach BS, Frongillo EA. Body weight and relationship quality among women: associations of obesity and underweight with relationship communication, conflict, and happiness. Int J Sociol Family. 2009;35(1):25–44. [Google Scholar]
- 48.Elfhag K, Rössner S. Who succeeds in maintaining weight loss? A conceptual review of factors associated with weight loss maintenance and weight regain. Obesity Rev. 2005;6(1):67–85. doi: 10.1111/j.1467-789X.2005.00170.x. [DOI] [PubMed] [Google Scholar]
- 49.Andajani-Sutjahjo S, Ball K, Warren N, Inglis V, Crawford D. Perceived personal, social and environmental barriers to weight maintenance among young women: a community survey. Int J Behav Nutr Phys Activ. 2004;1(1):15. doi: 10.1186/1479-5868-1-15. [DOI] [PMC free article] [PubMed] [Google Scholar]
- 50.Byrne S, Barry D, Petry NM. Predictors of weight loss success. Exercise vs. dietary self-efficacy and treatment attendance. Appetite. 2012;58(2):695–698. doi: 10.1016/j.appet.2012.01.005. [DOI] [PMC free article] [PubMed] [Google Scholar]
- 51.Littman AJ, McFarland LV, Thompson ML et al. Weight loss intention, dietary behaviors, and barriers to dietary change in veterans with lower extremity amputations. Disabil Health J. 2015;8(3):325–335. doi: 10.1016/j.dhjo.2014.10.003. [DOI] [PubMed] [Google Scholar]
- 52.Bandura A. Social cognitive theory. In: Vasta R, editor. Annals of Child Development Vol 6 Six Theories of Child Development. Greenwich, CT: JAI Press; 1989. [Google Scholar]
- 53.Bandura A. Social cognitive theory: an agenic perspective. Annu Rev Psychol. 2001;52:1–26. doi: 10.1146/annurev.psych.52.1.1. [DOI] [PubMed] [Google Scholar]
- 54.Venditti EM, Kramer MK. Necessary components for lifestyle modification interventions to reduce diabetes risk. Curr Diab Rep. 2012;12(2):138–146. doi: 10.1007/s11892-012-0256-9. [DOI] [PubMed] [Google Scholar]
- 55.Venditti EM, Wylie-Rosett J, Delahanty LM et al. Short and long-term lifestyle coaching approaches used to address diverse participant barriers to weight loss and physical activity adherence. Int J Behav Nutr Phys Activ. 2014;11(1):16. doi: 10.1186/1479-5868-11-16. [DOI] [PMC free article] [PubMed] [Google Scholar]
- 56.Delahanty LM, Trief PM, Cibula DA, Weinstock RS. Barriers to weight loss and physical activity, and coach approaches to addressing barriers, in a real-world adaptation of the DPP lifestyle intervention: a process analysis. Diabetes Educ. 2019;45(6):596–606. doi: 10.1177/0145721719883615. [DOI] [PubMed] [Google Scholar]
- 57.Rogerson D, Soltani H, Copeland R. The weight-loss experience: a qualitative exploration. BMC PublHealth. 2016;16:371. doi: 10.1186/s12889-016-3045-6. [DOI] [PMC free article] [PubMed] [Google Scholar]
- 58.Sharifi N, Mahdavi R, Ebrahimi-Mameghani M. Perceived barriers to weight loss programs for overweight or obese women. Health Promotion Perspect. 2013;3(1):11–22. doi: 10.5681/hpp.2013.002. [DOI] [PMC free article] [PubMed] [Google Scholar]
- 59.Manns PJ, May LA. Perceptions of issues associated with the maintenance and improvement of long-term health in people with SCI. Spinal Cord. 2007;45(6):411–419. doi: 10.1038/sj.sc.3101973. [DOI] [PubMed] [Google Scholar]
- 60.Rimmer JH, Wang E, Pellegrini CA, Lullo C, Gerber BS. Telehealth weight management intervention for adults with physical disabilities: a randomized controlled trial. Am J Phys Med Rehabil. 2013;92(12):1084–1094. doi: 10.1097/PHM.0b013e31829e780e. [DOI] [PubMed] [Google Scholar]
- 61.Wing RR, Phelan S. Long-term weight loss maintenance. Am J Clin Nutr. 2005;82(1 suppl):222s–225s. doi: 10.1093/ajcn/82.1.222S. [DOI] [PubMed] [Google Scholar]
- 62.Vasudevan V, Rimmer JH, Kviz F. Development of the barriers to physical activity questionnaire for people with mobility impairments. Disabil Health J. 2015;8(4):547–556. doi: 10.1016/j.dhjo.2015.04.007. [DOI] [PMC free article] [PubMed] [Google Scholar]
- 63.Forchheimer M, McAweeney M, Tate DG. Use of the SF-36 among persons with spinal cord injury. Am J Phys Med Rehabil. 2004;83(5):390–395. doi: 10.1097/01.Phm.0000124441.78275.C9. doi. [DOI] [PubMed] [Google Scholar]