

Abstract
Background: Physical deconditioning and inactivity following spinal cord injury (SCI) are associated with multiple cardiometabolic risks. To mitigate cardiometabolic risk, exercise is recommended, but it is poorly established whether arm cycling exercise (ACE) or functional electrical stimulation (FES) leg cycling yields superior benefits. Objectives: To determine the adaptations of 16 weeks of FES cycling and ACE on exercise energy expenditure (EEE), cardiorespiratory fitness (CRF), and obesity after SCI. Methods: Thirteen physically untrained individuals were randomly assigned to FES (n = 6) or ACE (n = 7) exercise 5 days/week for 16 weeks. Pre- and post-intervention EEE, peak oxygen consumption (absolute and relative VO2Peak), and work were assessed using indirect calorimetry, while body composition was measured by dual-energy x-ray absorptiometry. Results: Main effects were found for peak power (p < .001), absolute (p = .046) and relative (p = .042) VO2Peak, and peak work (p = .013). Compared to baseline, the ACE group increased in EEE (+85%, p = .002), peak power (+307%, p < .001), VO2Peak (absolute +21%, relative +22%, p ≤ .024), peak work (19% increase, p = .003), and total body fat decreased (-6%, p = .05). The FES group showed a decrease in percentage body fat mass (−5%, p = .008). The ACE group had higher EEE (p = .008), peak power (p < .001), and relative VO2Peak (p = .025) compared to postintervention values in the FES group. Conclusion: In the current study, ACE induced greater increases in EEE and CRF, whereas ACE and FES showed similar results on body fat. Exercise promotional efforts targeting persons with SCI should use both FES and ACE to reduce sedentary behavior and to optimize different health parameters after SCI.
Keywords: arm cycling ergometry, body composition, cardiorespiratory fitness, energy expenditure, exercise, functional electrical stimulation, spinal cord injury
Introduction
Cardiovascular disease (CVD) is a leading cause of mortality in persons with SCI, and the prevalence of CVD is greater in this special population than the population without SCI.1 CVD is more prevalent in the population with SCI because several disease-specific risk factors, such as chronic systemic low-grade inflammation,2 cardiometabolic syndrome,3 and visceral and hepatic adiposity,4,5 are more prevalent in persons with SCI than those without SCI.6 The inactive lifestyle observed in individuals with SCI is strongly related to higher prevalence of these aforementioned risk factors.3,7 This, coupled with SCI-related physical dysfunction, are a major cause of obesity, insulin resistance, hypertension, and dyslipidemia.
Exercise is a well-established modality used to improve health complications after SCI,3,8 and several authoritative guidelines for persons with and without SCI provide recommendations to improve overall health. The American College of Sports Medicine (ACSM) recommends 150 minutes of exercise per week,9 SCI Action Canada recommends 40 minutes per week of moderate-to-vigorous aerobic physical activity,10 the American Congress of Rehabilitation Medicine recommends ≥40 to 60 minutes per week of moderate-to-vigorous aerobic activity,11 and the recent Paralyzed Veterans of America Clinical Practice Guidelines on Identification and Management of Cardiometabolic Risk3 after SCI recommends persons with SCI participate in at least 150 minutes of exercise per week to prevent obesity and for health promotion. The ACSM also recommends a volume of more than 250 minutes of moderate-intensity exercise per week (or 50 minutes, 5 days/week) to achieve clinically significant weight loss in the population without SCI.12,13 Individuals with SCI have several barriers to exercise and cannot easily obtain its benefits, such as offsetting the deterioration of body composition and cardiometabolic profiles, suggesting a greater volume of exercise is needed.14 Furthermore, the aforementioned guidelines do not provide specific recommendations about exercise mode, and various modes can yield different benefits, such as improvements in muscle strength, endurance, balance, and flexibility.15,16 For persons with SCI, the most beneficial exercise modality remains controversial.17
Exercise in the population with SCI often encompasses upper limb activities, such as arm cycling exercise (ACE), due to trunk and lower limb muscle paralysis. Although ACE intervention studies report positive effects on aerobic fitness,17–22 this exercise modality may limit improvements in energy expenditure, cardiometabolic, and body composition.17,21,23–25 This is mainly due to important exercise limitations of upper body exercise including inactivity of the venous muscle pump of the legs, relatively small muscle mass available, and deficient cardiovascular reflex responses.15 Therefore, unlike with leg exercise, the development and maintenance of the higher levels of fitness cannot be easily achieved.15
The use of the paralyzed muscles of the lower limb can be accomplished through functional electrical stimulation leg cycle ergometry (FES-LCE). An advantage of FES-LCE over ACE training is that it can stimulate a sizable portion of the relatively large inactive muscle of the lower limb. This has the potential to enhance the systemic circulation by activating the skeletal muscle pump of the lower limb, provoking relatively large exercise responses for better aerobic fitness, and elevating energy expenditure through an increase of lean body mass. Both FES-LCE and neuromuscular electrical stimulation have been reported to increase lean body mass, improve cardiometabolic profiles, and improve cellular markers of carbohydrate metabolism.8,26–30 Furthermore, in a randomized, controlled study, Gorgey et al.28 reported that GLUT4 transporters, PGC-1α, and AMPK increased in the vastus lateralis and triceps brachii muscles following FES and ACE training, suggesting both exercise modalities have the potential to modulate protein expression in both the lower and upper limbs.
The primary objective of this study was to determine the adaptations of 16 weeks of FES-LCE and ACE 5 days per week on energy expenditure, cardiorespiratory fitness, and obesity in adults with chronic motor complete SCI. A secondary objective was to compare the efficacy of FES-LCE and ACE relative to these parameters. We hypothesized that significantly greater improvements in exercise energy expenditure, oxygen consumption, and body fat would occur in the FES-LCE group.
Methods
Study design
This is a randomized controlled trial (ClinicalTrials.gov, NCT00270855) that was approved by the institutional review board at the host institution. All participants were asked to read and sign consent forms that were approved by the local institutional review board. All participants were assessed by a blinded evaluator before and after the 16-week exercise intervention, except for exercise energy expenditure and peak power output, which were additionally assessed during week 8 (corresponding to exercise session 40).
Participants and screening
Participants were recruited by word of mouth, posted flyers, or from the associated SCI clinics at the participating institutions. Thirteen previously untrained men and women with motor complete paraplegia (level of injury: T4 to T10; age: 40.4 ± 11.9 years; % male: 69%; height: 171.0 ± 10.0 cm; weight: 81.0 ± 14.3 kg; body mass index [BMI]: 27.4 ± 4.6 kg/m2) were enrolled in the study. All participants were randomly assigned by a random number generator to either an ACE (n = 6) or FES-LCE (n = 7) group.
Each participant had two overnight stays: a baseline, pretraining stay (that included exercise session 1) and a 16th week, posttraining stay (that included exercise session 80). During the overnight stays, exercise energy expenditure, cardiorespiratory fitness, body composition, and cardiometabolic profiles were assessed. During week 8, exercise energy expenditure and peak power output were also measured in all participants (exercise session 40). All participants underwent a complete, pretraining physical examination, including a neurological assessment, International Standards for Neurological Classification of Spinal Cord Injury (ISNCSCI) examination, and a resting electrocardiogram. Following the baseline screening, the participant was transferred to the clinical research center located at the host institution for an overnight stay. The following morning, after a 10- to 12-hour overnight fast, basal metabolic rate (BMR) and body composition assessments were performed (described later).
Inclusion and exclusion criteria
Untrained adult participants with SCI were included if they were between the ages of 18 and 65 years (chosen to avoid confounding effects of age on body composition), had motor complete paraplegia (T1-L2, AIS A and B) for 12 months or more (i.e., chronic SCI), and had a visible tetanic contraction of the knee extensor muscles in response to electrical stimulation. Participants with motor complete paraplegia greater than or equal to 1 year were studied, as acute (<1 year) injury changes in body composition have stabilized and body habitus varies between complete and incomplete SCI.31,32 Exclusion criteria were as follows: individuals with recent (within 3 months) venous thromboembolism; severe spasticity; fractures, history of fractures, or documented osteoporosis; pressure injuries greater than grade II; preexisting chronic arterial and/or renal diseases; uncontrolled autonomic dysreflexia (hypertensive even after removing noxious stimuli), hypertension, or uncontrolled hyperglycemia or a hemoglobin A1c greater than 7.0%; untreated thyroid disease; excessive alcohol consumption (two or more drinks per day); or smokers.31–33
Graded exercise test
A graded exercise test (GXT) using an ACE (Lode, Groningen, Netherlands) was performed using a standard, discontinuous ACE GXT protocol before and after the 16-week intervention as previously described.23,25 Briefly, all participants cycled at a pace of 50 revolutions per minute (rpm) following a warmup period of 2 minutes. A warmup period with the initial resistance of 36 Watts (W) and a pace of 50 rpm lasted for 2 minutes. This was followed by subsequent 2-minute stages of 12-W increments until exhaustion according to ACSM’s Guidelines for Exercise Testing. Every 2 minutes, participants were asked to drop their cycling speed (15–25 rpm) to allow manual assessment of the blood pressure for 30 seconds, which was followed by the next stage of incremental increase in power until fatigue. A TrueMax 2400 (ParvoMedics, Salt Lake, Utah) computerized metabolic measurement system measured peak oxygen uptake (VO2Peak) during the GXT. VO2Peak was determined once respiratory exchange ratio exceeded 1.1 and the participant was unable to maintain a pace of 50 rpm. Heart rate was measured using a Polar automatic heart rate monitor (Polar Inc., Bethpage, New York) that was placed distal to the xyphoid process. Blood pressure was measured using the auscultatory technique using a standard sphygmomanometer and a stethoscope every 10 minutes. All participants were tested in their own stabilized wheelchair.
Exercise intervention
Exercise training for both ACE and FES-LCE groups was performed 5 days a week for 16 weeks (totaling 80 exercise sessions) at the exercise physiology laboratory at the host institution. For participants in both ACE and FES-LCE groups, blood pressure and heart rate (Polar RS400 Watch, Polar Inc., Bethpage, New York) were monitored and recorded during each exercise session according to the methods described previously.
ACE
ACE training entailed exercising the upper limbs on an ACE (Monark Rehab Trainer 881E, Vansbro, Sweden) cycle. Each session started with a 10-minute warmup, followed by 40 minutes of exercise training, and ended with a 10-minute cool-down (totaling 60 minutes). Both warmup and cool-down phases consisted of upper limb cycling without resistance. During the 16-week training period, the workload was adjusted from 20 to 40 W to maintain a peak heart rate at 75% of their maximum heart rate.25 The participant was encouraged to maintain an exercise rate of 50 rpm.
FES-LCE
FES-LCE training was performed on an ERGYS 2 ergometer (Therapeutic Alliances, Fairborn, Ohio) with bilateral stimulation of the quadriceps femoris, hamstrings, and gluteal muscles.23,25 Muscles were stimulated sequentially (60 Hz) with a maximum current amplitude (140 mA) necessary to complete 40 minutes of cycling at 50 rpm. Participants initially started cycling against no resistance (0/8 kiloponds [kp]), although resistance was progressed over the course of the training. Once the participant was able to cycle without decreasing the cadence below 50 rpm or fatigue, the resistance of the bike was manually progressed to 0.125 kp. Throughout the 16-week training protocol, the FES-LCE workload was adjusted to elicit training heart rates approximating 75% heart rate maximum or as tolerated to complete the 40-minute session without fatigue. The goal of the FES-LCE training was to finish an exercise session for 40 minutes at 50 rpm without fatigue. Each FES-LCE session included 10 minutes of passive warmup and 10 minutes of passive cool-down that were accomplished by one of the research investigators to maintain a cadence of 5 rpm less than the target cadence. A fatigue threshold was set at 10 rpm to allow for a longer cycling time even though muscle fatigue may be present.23,25
Exercise energy expenditure
During exercise sessions 1, 40, and 80, energy expenditure was measured by mask indirect calorimetry (K4b2, COSMED Inc., Rome, Italy) using the preprogramed Weir formula34 according to previously published methods.35 Following calibration, participants were asked to place the mask over their face to measure steady state oxygen uptake (VO2) and carbon dioxide production (VCO2). A 3-minute resting period allowed the subject to adjust to breathing with the mask on while exercising. VO2 and VCO2 were monitored and recorded throughout the exercise to determine total energy expenditure during exercise, average caloric expenditure per minute, and peak power output. After the resting period, energy expenditure was measured during the 3-minute warmup period, exercise period, and cool-down period.
Body composition
Physical characteristics
The height of each participant was determined only on the left side after properly aligning the head, neck, trunk, and lower limbs. While the participant was lying in the supine position, two smooth wooden boards were placed perpendicular to the participant’s head and heels and the distance between them was measured and corresponded to the height in nearest centimeter. Every effort was made to keep the knees in an extended position. Body mass was measured with a wheelchair scale (PW-630U; Tanita, Arlington Heights, Illinois). Each participant was asked to void his or her bladder and then to propel onto a wheelchair scale with total body weight determined by subtracting the weight of the wheelchair. BMI was calculated according to standard methods as the weight divided by the height squared (kg/m2).
Waist circumference
Waist circumference was measured according to previously published methods.25,36 Briefly, waist circumference was defined as the narrowest region inferior to the costal margin of the thoracic cage and was measured while participants were lying in a supine position after transferring to a flat mat. Participants wore nonrestrictive clothing and were instructed to deeply inhale and then exhale. During the exhalation phase, the waist circumference measurement was obtained. Measurements were reported to the nearest 0.1 cm and repeated until three measurements were within 0.5 cm of one another.25 The three measures were then averaged.
Dual-energy x-ray absorptiometry
Dual-energy x-ray absorptiometry (DXA) scans were performed to measure percent body fat; fat mass; fat free mass; total, upper, and lower lean body mass; and bone mineral density using a Lunar Prodigy Advance (GE Lunar Inc., Madison, Wisconsin) according to previously published methods.25,28 The scans were performed 1 week before and less than 72 hours after the 16-week intervention. Every effort was taken to reproduce the original positioning of the participant on the scanner at both timepoints. Participants’ lower limbs were secured proximal to the knee joint with a Velcro strap to maintain a neutral position, minimize external rotation, and protect the participant in the event of a muscle spasm as the DXA scanning arm passed over the individual’s legs. Participants were scanned in the supine position and remained that way for at least 20 minutes before the scan to diminish the influence of fluid shift on body composition parameters. All scans were performed and analyzed by a certified DXA operator using the Lunar software.
Cardiometabolic profiles
All metabolic measurements were determined at baseline prior to 16 weeks of the intervention and less than 72 hours following the final exercise session (session 80).
Following an overnight fast for 10 to 12 hours, BMR was measured according to previously published methods. BMR measurements began at approximately 6:00 a.m. Participants were in a dark room in a supine position for 20 minutes to achieve a resting steady state. During this time, BMR was measured using indirect calorimetry with a Quark RMR cart (COSMED Inc., Rome, Italy) and a canopy that covered the head and neck.
Fasting glucose (Wako Chemical USA, Richmond, Virginia), triglycerides (TG; Sigma-Aldrich, St Louis, Missouri), total cholesterol (TC), low-density lipoprotein-cholesterol (LDLC), and high-density lipoprotein-cholesterol (HDLC) were determined using commercially available colorimetric assays (Thermo DMA, Austin, Texas). Fasting insulin was measured with radioimmunoassay single antibody kit. The homeostatic model assessment of insulin resistance (HOMA-IR) was calculated using the following equation:
 |
where fasting glucose and insulin are measured in mg/dL and μm/mL, respectively.
Statistical analysis
All data were checked for normality with boxplots and the Shapiro-Wilk test of normality. The data were also evaluated for significant outlies using Grubbs test. Mann-Whitney U tests were used to evaluate baseline demographic parameters between the FES-LCE and ACE groups. Repeated measure analysis of variance (ANOVA) within (time) and between (group) subject factors were used to analyze energy expenditure, cardiorespiratory fitness, body composition, and cardiometabolic data. When appropriate, a Bonferroni post hoc adjustment for multiple comparisons was performed. When a significant main effect was detected, Mann-Whitney U and Wilcoxon signed-rank tests were used to assess between-group (FES-LCE vs ACE) and time (pre- vs post-intervention) differences, respectively. All values were reported as mean ± SD and a significance level was set a priori at an alpha ≤ 5%. All analyses were conducted with SPSS 26 (IBM Inc., Armonk, NY).
Results
Table 1 presents baseline demographic characteristics between the ACE and FES-LCE groups. No significant differences were observed in demographics (Table 1) or in baseline physical characteristics, body composition, and cardiometabolic profiles between the groups (Table 2; p > .05). BMR data from one of the participants in the FES group were excluded because they were deemed a significant outlier when they were evaluated against the data of the other participants in the same group (p < .05).
Table 1.
Baseline demographic parameters
| ACE (n = 7) | FES-LCE (n = 6) | p | |
|---|---|---|---|
| Age, years | 41.7 ± 10.7 | 38.8 ± 19.9 | .689 |
| Gender, % male | 71% | 67% | >.90 |
| Height, cm | 168.6 ± 8.9 | 173.7 ± 11.3 | .398 |
| Level of injury | T4–T10 | T4–T10 | NA |
| AIS, %A/%B | 86% / 14% | 67% / 33% | .124 |
Note: ACE = arm cycling exercise group; AIS = American Spinal Injury Association Impairment Scale; FES-LCE = functional electrical stimulation leg cycle ergometry; NA = not applicable.
Table 2.
Effects of exercise on body composition, cardiometabolic, and cardiorespiratory fitness profiles by exercise group
| ACE (n = 7) | FES-LCE (n = 6) | Between group differences p value | |||
|---|---|---|---|---|---|
| Pre | Post | Pre | Post | ||
| Physical characteristics | |||||
| Weight, kg | 79.1 ± 12.2 | 78.6 ± 12.9 | 83.4 ± 17.6 | 83.9 ± 19.4 | .534 |
| Body mass index, kg/m2 | 27.8 ± 3.4 | 27.6 ± 3.9 | 27.7 ± 6.1 | 27.8 ± 6.0 | .474 |
| Waist circumference, cm | 91.1 ± 9.6 | 89.6 ± 8.8 | 91.6 ± 12.7 | 91.3 ± 13.6 | .775 |
| Dual-energy x-ray absorptiometry | |||||
| Percent body fat, % | 38.9 ± 5.5 | 37.1 ± 5.6** | 41.6 ± 7.1 | 39.9 ± 6.9* | .886 |
| Fat mass, kg | 29.6 ± 6.4 | 27.7 ± 5.4* | 33.4 ± 11.0 | 32.3 ± 11.0 | .366 |
| Fat-free mass, kg | 49.5 ± 9.1 | 50.5 ± 10.4 | 49.5 ± 11.2 | 51.3 ± 12.8 | .534 |
| Lean body mass, kg | 46.6 ± 8.7 | 47.6 ± 10.1 | 46.0 ± 10.8 | 48.0 ±12.4 | .534 |
| Bone mineral density, g/cm2 | 1.1 ± 0.1 | 1.2 ± 0.1 | 1.3 ± 0.1 | 1.3 ± 0.1# | .366 |
| UE lean mass, kg | 7.3 ± 2.2 | 7.4 ± 2.1 | 7.6 ± 2.0 | 7.7 ± 2.37 | .138 |
| LE lean mass, kg | 13.9 ± 3.1 | 13.7 ± 2.9 | 13.5 ± 4.4 | 14.5 ± 5.2 | .945 |
| Cardiometabolic profiles | |||||
| BMR, kcal/day | 1441.3 ± 347.5 | 1309.6 ± 167.9 | 1341.8 ± 410.8^ | 1381.4 ± 438.2a | .666 |
| Fasting glucose, mg/dL | 98.7 ± 11.6 | 92.8 ± 11.4 | 83.9 ± 15.5 | 87.0 ± 6.6 | .183 |
| Fasting insulin, μm/mL | 8.7 ± 8.5 | 5.8 ± 6.9* | 11.3 ± 13.1 | 6.4 ± 6.4 | .366 |
| HOMA-IR | 0.26 ± 0.03 | 0.24 ± 0.04** | 0.23 ± 0.06 | 0.23 ± 0.03 | .265 |
| TC, mg/dL | 175.9 ± 29.4 | 172.0 ± 28.6 | 166.5 ± 49.4 | 163.7 ± 38.9 | .886 |
| HDLC, mg/dL | 35.7 ± 6.4 | 33.4 ± 5.1 | 37.8 ± 8.3 | 37.8 ± 6.9 | .198 |
| LDLC, mg/dL | 118.3 ± 30.5 | 118.3 ± 32.1 | 105.8 ± 47.5 | 107.3 ± 35.2 | .921 |
| TC:HDLC ratio | 5.1 ± 1.2 | 5.31 ± 1.4 | 4.7 ± 2.0 | 4.5 ± 1.4 | .269 |
| Triglycerides, mg/dL | 104.7 ± 50.6 | 103.6 ± 65.2 | 99.7 ± 47.2 | 87.3 ± 46.7* | .259 |
| Resting systolic BP, mm Hg | 117.7 ± 16.6 | 108.0 ± 15.4* | 123.3 ± 20.5 | 115.0 ± 15.3* | .773 |
| Resting diastolic BP, mm Hg | 59.9 ± 8.3 | 67.4 ± 10.6 | 70.0 ± 15.3 | 61.7 ± 8.6 | .745 |
| Resting heart rate, bpm | 67.4 ± 10.6 | 70.4 ± 13.4 | 73.7 ± 7.3 | 68.3 ± 5.1 | .182 |
Note: ACE = arm cycling exercise group; BMR = basal metabolic rate; BP = blood pressure; FES-LCE = functional electrical stimulation leg cycle ergometry; HDLC = high-density lipoprotein cholesterol; HOMA-IR = Homeostatic Model Assessment of Insulin Resistance; LE = lower extremity; LDLC = low-density lipoprotein cholesterol; TC = total cholesterol; UE = upper extremity.
n = 5. BMR from one participant was a significant outlier (p ≤ .05) and was therefore excluded from this analysis.
* Significant difference from before the intervention (p ≤ .05).
** A trend toward significant difference from before the intervention (p > .05 to .09).
# Significant difference between groups after the intervention (p ≤ .05).
Energy expenditure and peak power output
Figures 1a and 1b illustrate average and total exercise energy expenditure, respectively, in both groups during the intervention trial. Average exercise energy expenditure for the ACE group during session 1 was 3.21 ± 0.88 kcal/min, session 41 was 5.15 ± 2.01 kcal/min, and session 80 was 5.92 ± 1.57 kcal/min. For the same group, total exercise energy expenditure for sessions 1, 41, and 80 were 128.29 ± 35.37 kcal, 206.06 ± 80.44 kcal, and 236.71 ± 62.95 kcal, respectively. Concerning the FES-LCE group, average exercise energy expenditure during session 1 was 2.01 ± 0.81 kcal/min, session 41 was 2.67 ± 1.86 kcal/min, and session 80 was 2.76 ± 1.93 kcal/min, whereas total exercise energy expenditure for sessions 1, 41, and 80 were 80.67 ± 32.59 kcal, 106.20 ± 74.38 kcal, and 101.20 ± 77.25 kcal, respectively.
Figure 1.
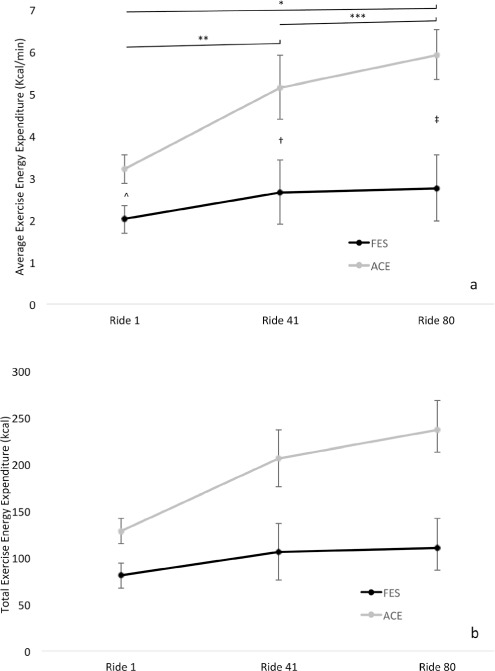
Average (a) total (b) exercise energy expenditure during exercise rides (sessions) 1, 40, and 80 in the arm cycling exercise (ACE) and functional electrical stimulation leg cycle ergometry (FES-LCE) groups. *Significant increase from ride 1 to 80 in the ACE group, p = .002. ** A trend toward a significant increase from ride 1 to 41 in the ACE group, p = .055. ***A trend toward a significant increase from ride 41 to 80 in the ACE group, p = .076. Significant difference between the groups at ride 1 (^ p = .029), ride 40 († p = .041), and ride 80 (‡ p = .008).
Repeated measures ANOVA did not demonstrate a significant main effect for average (p = .068; Figure 1a) or total (p = .068; Figure 1b) exercise energy expenditure. However, when using Wilcoxon rank-sum test, a significant increase from session 1 to 80 was observed in average (p = .002) and total (p = .002) exercise energy expenditure in the ACE group. In the ACE group, both average and total exercise energy expenditure approached a significant increase from session 1 to 41 (both p = .055) and session 41 to 80 (both p = .076). No significant differences were observed in the FES-LCE group regarding average (p > .05) and total (p > .05) exercise energy expenditure. Both average and total exercise energy expenditure were significantly higher at sessions 1 (p = .029), 41 (p = .041), and 80 (p = .008) in the ACE group compared to the FES-LCE group.
Figure 2 shows peak power output. A significant main effect was detected for peak power output (p < .001). Post hoc analysis using Wilcoxon rank-sum test showed a significant increase in peak power output from session 1 (12.13 ± 6.45 W) to both session 41 (43.8 ± 6.45 W, p = .006) and session 80 (43.81 ± 8.86 W, p < .001), but not from sessions 41 to 80 (p = .313). Peak power output did not significantly increase at session 1 (0.30 ± 0.07 W), 41 (3.36 ± 5.52 W), or 80 (4.14 ± 4.80 W) in the FES-LCE group. At all timepoints, peak power output was significantly higher in the ACE group compared to the FES-LCE group (session 1, p =.001; session 2, p < .001; and session 3, p < .001).
Figure 2.
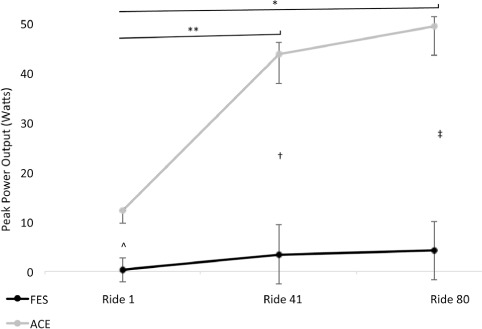
Peak power output during exercise rides (sessions) 1, 40, and 80 in the arm cycling exercise (ACE) and functional electrical stimulation (FES) leg cycle ergometry groups. *Significant increase from ride 1 to 80 in the ACE group, p < .001. ** Significant increase from ride 1 to 41 in the ACE group, p = .006. Significant difference between the groups at ride 1 (^ p = .001), ride 40 († p < .001), and ride 80 (‡ p < .001).
Cardiorespiratory fitness
Figures 3a–c demonstrate cardiorespiratory fitness before and after the exercise intervention program. A significant main effect was detected for absolute VO2Peak (p = .046), relative VO2Peak (.042), and peak work (.013). Post hoc analysis with Wilcoxon signed-rank test revealed absolute VO2Peak (session 1: 1.26 ± 0.34 L/min vs session 80: 1.53 ± 0.40 L/min; p = .020; Figure 2a), relative VO2Peak (session 1: 15.91 ±2.61 mL/kg/min vs session 80: 19.47 ± 4.30 mL/kg/min; p = .024; Figure 2b), and peak work (session 1: 89.14 ± 21.75 J vs session 80: 106.29 ± 30.54 J; p = .003; Figure 2c) significantly increased in the ACE group following the intervention. In the FES-LCE group, nonsignificant increases in absolute VO2Peak (session 1: 1.16 ± 0.26 L/min vs session 80: 1.19 ± 0.33 L/min, p = .648), relative VO2Peak (session 1: 13.98 ± 1.28 mL/kg/min vs session 80: 14.32 ± 2.41 mL/kg/min, p = .687), and peak work (session 1: 78.00 ± 14.70 J vs session 80: 82.00 ± 17.66 J, p = .175) were found at the end of the exercise program. When comparing postintervention values between the groups, the ACE group had significantly higher relative VO2Peak compared to the FES-LCE group (p = .025).
Figure 3.
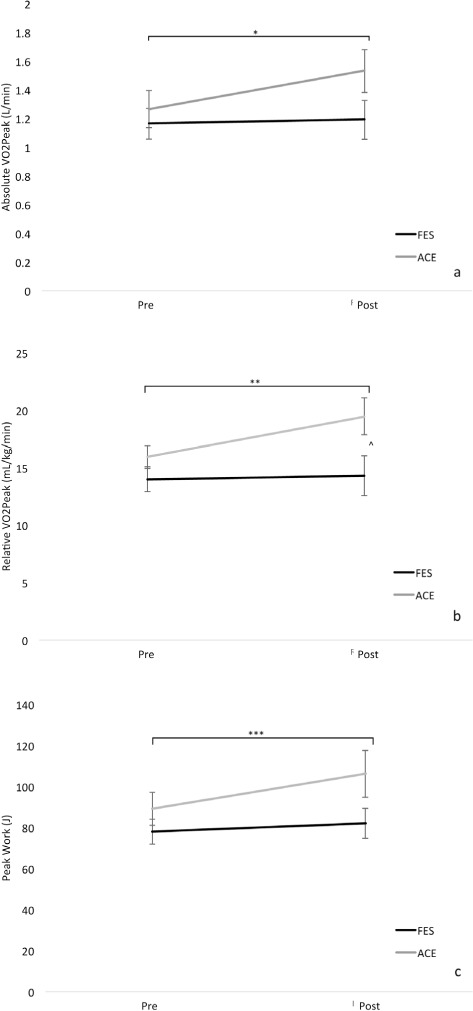
Absolute (a) and relative (b) to bodyweight peak oxygen consumption (VO2Peak) and peak work (c) before and after the exercise program in the arm cycling exercise (ACE) and functional electrical stimulation (FES) leg cycle ergometry groups. *Significant increase in absolute VO2Peak from pre to post intervention in the ACE group, p = .02. **Significant increase in relative VO2Peak from pre to post intervention in the ACE group, p = .024. ***Significant increase in peak work from pre to post intervention in the ACE group, p = .003. ^Significant difference in relative VO2Peak between the groups post intervention (p = .025).
Body composition
Body composition is presented in Table 2. No significant main effects were found for waist circumference, percent body fat, fat mass, fat free mass, lean body mass, and bone mineral density (p > .05). When using Wilcoxon signed-rank test, however, individuals in the FES-LCE group significantly decreased percent body fat (p = .008) and those in the ACE group significantly decreased fat mass (p = .05). Body fat in the ACE group approached a significant decrease following the intervention (p = .078). Furthermore, BMD following the intervention was significantly greater in the FES-LCE group compared to ACE (p = .04).
Cardiometabolic profiles
Table 2 reports cardiometabolic profiles before and after the intervention in both groups. No significant main effect was found for all cardiometabolic variables (p > .05). However, following the intervention, fasting insulin (p = .009) in the FES-LCE group and triglycerides (p = .014) in the ACE group significantly decreased when using the Wilcoxon signed-rank test. In both groups, resting systolic blood pressure significantly decreased (FES-LCE: p = .040 vs ACE: p = .032). No other cardiometabolic variables were significantly different; however, HOMA-IR trended toward a decrease (p = .086) in the ACE group.
Discussion
The primary objective of this study was to determine the adaptations to FES-LCE and ACE for energy expenditure, cardiorespiratory fitness, and obesity in adults with chronic motor complete SCI. A secondary objective was to compare the efficacy of FES-LCE and ACE relative to the aforementioned parameters. The main results from the randomized control trial demonstrate greater gains in exercise energy expenditure, peak power point, and cardiorespiratory fitness among individuals in the ACE group compared to the FES-LCE group, while both groups decreased body fat and improved their cardiometabolic health.
Energy expenditure and power output
Over the course of the 16-week exercise program, increases in average and total exercise energy expenditure were observed in both FES-LCE and ACE groups, but only the latter intervention induced significant increases in energy expenditure and cardiorespiratory fitness. Specifically, exercise energy expenditure increased 85% and 37% in the ACE and FES-LCE groups, respectively. In addition, peak power output increased over time, although this was only significant in the ACE group. Bresnahan et al.18 reported a significant increase in peak power independent of body composition following 10 weeks (30 min/day, 3 days/week) of ACE exercise at 70% VO2Peak in 10 previously untrained individuals with high (C7-T5) motor complete SCI. Gorgey et al.23 showed a progressive increase in exercise energy expenditure of 3.54 kcal/min, 3.77 kcal/min, and 3.98 kcal/min during rides 1, 40, and 80, respectively, with concurrent increase in power and 2% increase in fat-free mass in an individual with T6 motor complete SCI over 21 weeks of FES-LCE. Similarly, Dolbow et al.37 also reported an increase in both exercise energy expenditure and power during 24 weeks of home-based FES-LCE cycling at three times per week. Exercise-induced increases in energy expenditure have been positively associated with fat-free mass and lean body mass,37–39 which nonsignificantly increased in both exercise groups in the present study. The 4% increase in fat-free mass and lean-body mass in the FES-LCE group and the 2% increase in fat-free mass and lean-body mass in the ACE group likely resulted in the increased energy expenditure in both groups, but only significantly in the latter group. The nonsignificant increase in lean tissue was accompanied by a proportional increase in peak power output that was observed in both the FES-LCE and ACE groups. As more lean mass was built in the participants during the study, they were able to cycle at increased workloads with an increased ability to burn calories. For the participants in this study, metabolically active tissue, caloric expenditure, and peak power output during exercise appear to have improved concurrently. Moreover, the increase in caloric usage likely also helped reduce body fat in both groups.
The present study reported significantly greater exercise energy expenditure and peak power in individuals completing the ACE exercise compared to persons exercising in the FES-LCE group. This is surprising given the larger volume of exercising lower limb muscle mass that is used during FES-LCE compared to the upper limbs on ACE. The difference in exercise energy expenditure and peak power output likely stems from voluntary (ACE) and involuntary (FES-LCE) muscle recruitment paradigms. When using FES-LCE, individuals with SCI rely on an accommodation period to minimize muscle fatigue that occurs with electrical stimulation and acclimate to the exercise and stimulation itself.40 FES and neuromuscular electrical stimulation recruit motor units in a nonselective, temporally synchronous, and spatially fixed pattern that lead to premature muscle fatigue compared to voluntary actions, such as with volitional arm exercise.41 In a review of the literature, Gregory and Bickel42 discussed that motor recruitment using surface electrodes from electrical stimulation is nonphysiological (i.e., nonselective, random, synchronous) and representative of the types of motor units in the proximity of the electrode. This type of recruitment pattern may therefore only recruit the superficial portion of the stimulated muscle. Thus, it is highly plausible that this nonphysiological recruitment pattern caused greater muscle fatigue in the FES-LCE group, even though the protocol was designed to minimize this compared to the ACE group that used upper limb voluntary muscle contraction where recruitment followed the Henneman size principle.40,42 In those individuals using FES-LCE, this ultimately translated to less total time exercising compared to the volitional ACE exercise and therefore less calories burned. Additionally, with voluntary muscle contraction, asynchronous recruitment can delay fatigue, which is not possible with electrical stimulation.40
One other aspect to consider during FES-LCE exercise is the thickness of the subcutaneous adipose tissue (SAT) underlying the location of the surface electrode, which can impede the electrical signal to the muscle. Although not measured in the present study, Gorgey et al.43 reported that individuals with 50% greater cross-sectional area of thigh subcutaneous adipose tissue (SAT) required 48% to 59% greater current amplitude to complete full knee extension compared to a control group. Berry et al.44 reported that the “stimulation cost” of FES (i.e., the amount of electric charge input required to elicit a given power output) was positively influenced by thigh SAT cross-sectional area. Collectively, these data suggest that due to the nonphysiological recruitment pattern of FES-LCE and the impedance of thigh SAT, individuals with SCI would benefit from a conditioning period prior to the start of the actual exercise program to ensure sufficient leg strength and endurance so they can obtain the most benefit from the exercise. This is especially true given that individuals with SCI are among some of the most physically deconditioned individuals; this is even more severe with higher levels of injury and injury completeness.45
Cardiorespiratory fitness
Peak oxygen consumption is considered a reliable index of cardiorespiratory health after SCI.15 Both ACE and FES-LCE are established exercise modalities used to increase cardiorespiratory fitness after SCI.15 However, it is unknown if one exercise approach is superior to the other. In the present study, absolute VO2Peak, VO2Peak relative to bodyweight, and peak work significantly improved following 16 weeks of ACE versus FES-LCE. In addition, following the exercise program, VO2Peak relative to bodyweight was significantly greater in the ACE group compared to the FES-LCE. Gorgey et al.28 reported a trend in a greater VO2Peak relative to bodyweight following 4 months of ACE (n = 5) exercise training compared to no changes after FES-LCE (n = 4). However, in a prospective cohort study, Carty et al.46 demonstrated significant improvements in VO2Peak using home-based neuromuscular electrical stimulation for 8 weeks in sedentary adults with motor complete SCI. Both Barstow et al.47 and Verellen et al.48 reported a higher VO2 for ACE exercise compared to FES-LCE exercise. In addition, Verellen et al.48 showed that physiological values for FES-LCE hybrid exercise were significantly higher in comparison with the values of FES-LCE. In a multicenter 16-week randomized control trial, Bakkum et al.49 reported no significant interactions among a handcycle and hybrid cycle (FES-LCE with ACE) group, except for submaximal VO2, which significantly decreased over time in contrast to the handcycle group. Hasnan et al.50 demonstrated ACE alone and FES-LCE with ACE (hybrid cycle) resulted in significantly higher VO2Peak compared to FES-LCE. They also noted that submaximal VO2 during FES-LCE was significantly lower than ACE alone, FES-LCE with ACE, and cycling on a special hybrid FES-LCE tricycle.50 Tørhaug et al.51 reported that VO2Peak was significantly higher (by 19%) during ACE exercise with passive leg cycling compared to ACE only, whereas VO2Peak during FES hybrid cycling was significantly higher (by 16%) than during ACE exercise with passive leg cycling in persons with high SCI (≥T6). Collectively, the data suggest that combined upper and lower limb exercise can develop a higher oxygen uptake compared with ACE or FES alone, but when used alone, ACE leads to greater gains in aerobic fitness.
It is likely that a combined, two-exercise modality approach for persons with SCI may be a superior cardiorespiratory challenge than one modality alone for several anatomical and physiological reasons. According to Hooker et al.,52 a hybrid exercise approach leads to greater increases in sympathetic outflow to induce a cardiorespiratory response, decreases circulatory hypokinesis to improve cardiac output, produces a larger cardiac-volume load (Frank-Starling mechanism) to stimulate cardiovascular training, permits training at a higher VO2 for more efficient exercise aerobic conditioning, and activates and provides training benefits to upper and lower muscle mass. The hybrid approach hypothesis is also supported by a systematic review that concluded VO2 peak during FES-rowing and FES-hybrid exercise was higher than during FES-cycling alone.53 Future multicenter randomized controlled trials are needed to determine the optimal exercise modality for persons with SCI.
Body composition and cardiometabolic profiles
Percent body fat and fat mass significantly decreased in both the FES-LCE and ACE groups. Resting systolic blood pressure significantly decreased in both the FES and ACE groups following the 16-week intervention. Furthermore, fasting insulin significantly decreased by 33% in the ACE group, whereas triglycerides significantly decreased by 12% in the FES group. Bakkum et al.54 reported significant reductions in waist circumference and diastolic blood pressure in both FES hybrid cycle and handcycle groups following 16 weeks of exercise at two times a week. Additionally, Bakkum and colleagues54 noted insulin sensitivity improved in the handcycle group, while percent android fat decreased in the FES hybrid cycle group.54 Griffin et al.29 reported that total body mass and lean muscle mass significantly increased, whereas there was no significant difference in bone or fat mass following FES training two to three times a week for 10 weeks. They also noted a significant decrease in high-density lipoprotein cholesterol without improvements in total cholesterol, low-density lipoprotein cholesterol, and triglycerides.29 de Groot et al.22 and Horiuchi and Okita55 did not report significant improvements in glucose metabolism following 8 and 10 weeks of ACE, respectively. Alternatively, Bresnahan et al.18 and Nightingale et al.56 reported significant improvements in fasting insulin following 10 weeks of ACE at three times per week.
Moreover, diet may have been a confounding factor that could explain why significant improvements in lean body mass and fat-free mass and larger changes in body fat were not observed. In a meta-analysis by Farkas et al.,57 the authors reported that individuals with SCI consume more calories than they expend. Thus, one may be able to conclude that without exercise with dietary intervention, significantly larger reductions in body fat and increases in lean mass would not be expected. Dolbow et al.58 recently conducted a pilot study to determine the preliminary efficacy of interval FES combined with nutritional counseling in obese adults with chronic SCI. They reported that participants in the FES plus nutrition group had a significantly greater decrease in percent body fat compared to those in the nutrition-only group and gained more lean mass in their legs than the latter group.58 In the present study, a small nonsignificant increase of 7.4% was observed in lower limb lean mass in the FES group, with a decrease of 1.4% in the ACE group. The increase in lean mass was probably because of the electrically induced exercise of the paralyzed muscles of the lower limb. This is important as Skold et al.59 and Demchak et al.60 have reported that FES increases skeletal muscle mass of the lower limb versus a nontreatment control group. The participants’ decrease in body fat and increase in lean mass in the present study is important for combatting obesity2 and mitigating cardiometabolic disease risk.3
Limitations
This study is not without limitations. (1) This study had a small sample size of 13 persons with SCI, raising the possibility of a type 2 error and reducing external validity (i.e., generalizability) of the study to the overall SCI population. However, this sample size is consistent with exercise-based SCI research.25,28,30 (2) We tested people with paraplegia, and not persons with tetraplegia, who may have benefited more from FES exercise because of limited upper limb function. (3) We did not control for diet. Future studies need to control for diet using a metabolic kitchen where food can be prepared for the participants. (4) Mid-intervention assessments were only conducted for exercise energy expenditure and peak power output, but not other variables. This could have masked potential changes (increases/decreases) in cardiorespiratory fitness, body composition, and cardiometabolic profiles that occurred midway through the training program.
Conclusion
In the present study, 16 weeks of FES and ACE induced similar benefits on body composition and cardiometabolic health, despite lower exercise energy expenditure, peak power output, and aerobic fitness in FES-LCE. This work emphasizes the importance of understanding adaptations to specific modes of exercise and suggests that certain exercise modes provide superior value after SCI. However, future research should aim to identify optimal exercise parameters (e.g., mode, intensity, frequency) for inducing specific health benefits since the results of the present study suggest that FES-LCE and ACE exercise demonstrate different health outcomes.
Acknowledgments
The authors would like to express their gratitude to David W. McMillian, PhD, for his critical appraisal of the manuscript.
Footnotes
Conflicts of Interest
The authors declare no conflicts of interest.
Financial Support
This study was supported by the VHA RR&D #B3918R and UL1RR031990 from the National Center for Research Resources.
REFERENCES
- 1.Garshick E, Kelley A, Cohen SA et al. A prospective assessment of mortality in chronic spinal cord injury. Spinal Cord. 2005;43(7):408–416. doi: 10.1038/sj.sc.3101729. [DOI] [PMC free article] [PubMed] [Google Scholar]
- 2.Farkas GJ, Gater DR. Neurogenic obesity and systemic inflammation following spinal cord injury: a review. J Spinal Cord Med. 2018;41(4):378–387. doi: 10.1080/10790268.2017.1357104. [DOI] [PMC free article] [PubMed] [Google Scholar]
- 3.Nash MS, Groah SL, Gater DR et al. Identification and management of cardiometabolic risk after spinal cord injury. J Spinal Cord Med. 2019;42(5):643–677. doi: 10.1080/10790268.2018.1511401. [DOI] [PMC free article] [PubMed] [Google Scholar]
- 4.Rankin KC, O’Brien LC, Segal L, Khan MR, Gorgey AS. Liver adiposity and metabolic profile in individuals with chronic spinal cord injury. BioMed Res Int. 2017;2017:1364818. doi: 10.1155/2017/1364818. [DOI] [PMC free article] [PubMed] [Google Scholar]
- 5.Gorgey AS, Mather KJ, Gater DR. Central adiposity associations to carbohydrate and lipid metabolism in individuals with complete motor spinal cord injury. Metab Clin Exp. 2011;60:843–851. doi: 10.1016/j.metabol.2010.08.002. [DOI] [PubMed] [Google Scholar]
- 6.Myers J, Lee M, Kiratli J. Cardiovascular disease in spinal cord injury: an overview of prevalence, risk, evaluation, and management. Am J Phys Med Rehabil. 2007;86(2):142–152. doi: 10.1097/PHM.0b013e31802f0247. [DOI] [PubMed] [Google Scholar]
- 7.Washburn RA, Zhu W, McAuley E, Frogley M, Figoni SF. The physical activity scale for individuals with physical disabilities: development and evaluation. Arch Phys Med Rehabil. 2002;83(2):193–200. doi: 10.1053/apmr.2002.27467. [DOI] [PubMed] [Google Scholar]
- 8.Gorgey AS, Dolbow DR, Dolbow JD, Khalil RK, Gater DR. The effects of electrical stimulation on body composition and metabolic profile after spinal cord injury - Part II. J Spinal Cord Med. 2015;38:23–37. doi: 10.1179/2045772314Y.0000000244. [DOI] [PMC free article] [PubMed] [Google Scholar]
- 9.Haskell WL, Lee I-M, Pate RR et al. Physical activity and public health: updated recommendation for adults from the American College of Sports Medicine and the American Heart Association. Med Sci Sports Exerc. 2007;39:1423–1434. doi: 10.1249/mss.0b013e3180616b27. [DOI] [PubMed] [Google Scholar]
- 10.Ginis KA, Hicks AL, Latimer AE et al. The development of evidence-informed physical activity guidelines for adults with spinal cord injury. Spinal Cord. 2011;49(11):1088–1096. doi: 10.1038/sc.2011.63. [DOI] [PubMed] [Google Scholar]
- 11.Evans N, Wingo B, Sasso E, Hicks A, Gorgey AS, Harness E. Exercise recommendations and considerations for persons with spinal cord injury. Arch Phys Med Rehabil. 2015;96(9):1749–1750. doi: 10.1016/j.apmr.2015.02.005. [DOI] [PubMed] [Google Scholar]
- 12.Garber CE, Blissmer B, Deschenes MR et al. American College of Sports Medicine position stand. Quantity and quality of exercise for developing and maintaining cardiorespiratory, musculoskeletal, and neuromotor fitness in apparently healthy adults: guidance for prescribing exercise. Med Sci Sports Exerc. 2011;43:1334–1359. doi: 10.1249/MSS.0b013e318213fefb. [DOI] [PubMed] [Google Scholar]
- 13.Meeusen R, Duclos M, Foster C et al. Prevention, diagnosis, and treatment of the overtraining syndrome: joint consensus statement of the European College of Sport Science and the American College of Sports Medicine. Med Sci Sports Exerc. 2012;45(1):186–205. doi: 10.1249/MSS.0b013e318279a10a. [DOI] [PubMed] [Google Scholar]
- 14.Gorgey AS. Exercise awareness and barriers after spinal cord injury. World J Orthop. 2014;5(3):158–162. doi: 10.5312/wjo.v5.i3.158. [DOI] [PMC free article] [PubMed] [Google Scholar]
- 15.Figoni SF, Kiratli BJ, Sasaki R. Spinal cord dysfunction. In: Myers J, Nieman D, editors. ACSM’s Resources for Clinical Exercise Physiology Musculoskeletal Neuromuscular Neoplastic Immunologic and Hematologic Conditions. 2nd ed. Philadelphia, PA: Lippincott Williams & Wilkins; 2010. pp. 58–78. [Google Scholar]
- 16.National Institute on Aging Four types of exercise can improve your health and physical ability. https://www.nia.nih.gov/health/four-types-exercise-can-improve-your-health-and-physical-ability Published 2020. Updated April 2, 2020. Accessed November 17, 2020.
- 17.Hicks AL, Martin Ginis KA, Pelletier CA, Ditor DS, Foulon B, Wolfe DL. The effects of exercise training on physical capacity, strength, body composition and functional performance among adults with spinal cord injury: A systematic review. Spinal Cord. 2011;49:1103–1127. doi: 10.1038/sc.2011.62. [DOI] [PubMed] [Google Scholar]
- 18.Bresnahan JJ, Farkas GJ, Clasey JL, Yates JW, Gater DR. Arm crank ergometry improves cardiovascular disease risk factors and community mobility independent of body composition in high motor complete spinal cord injury. J Spinal Cord Med. 2019;42(3):272–280. doi: 10.1080/10790268.2017.1412562. [DOI] [PMC free article] [PubMed] [Google Scholar]
- 19.DiCarlo SE. Effect of arm ergometry training on wheelchair propulsion endurance of individuals with quadriplegia. Phys Ther. 1988;68(1):40–44. doi: 10.1093/ptj/68.1.40. [DOI] [PubMed] [Google Scholar]
- 20.Sutbeyaz ST, Koseoglu BF, Gokkaya NK. The combined effects of controlled breathing techniques and ventilatory and upper extremity muscle exercise on cardiopulmonary responses in patients with spinal cord injury. Int J Rehabil Res. 2005;28(3):273–276. doi: 10.1097/00004356-200509000-00012. [DOI] [PubMed] [Google Scholar]
- 21.El-Sayed MS, Younesian A. Lipid profiles are influenced by arm cranking exercise and training in individuals with spinal cord injury. Spinal Cord. 2005;43(5):299–305. doi: 10.1038/sj.sc.3101698. [DOI] [PubMed] [Google Scholar]
- 22.de Groot PC, Hjeltnes N, Heijboer AC, Stal W, Birkeland K. Effect of training intensity on physical capacity, lipid profile and insulin sensitivity in early rehabilitation of spinal cord injured individuals. Spinal Cord. 2003;41(12):673–679. doi: 10.1038/sj.sc.3101534. [DOI] [PubMed] [Google Scholar]
- 23.Gorgey AS, Harnish CR, Daniels JA et al. A report of anticipated benefits of functional electrical stimulation after spinal cord injury. J Spinal Cord Med. 2012;35:107–112. doi: 10.1179/204577212X13309481546619. [DOI] [PMC free article] [PubMed] [Google Scholar]
- 24.Hooker SP, Wells CL. Effects of low- and moderate-intensity training in spinal cord-injured persons. Med Sci Sports Exerc. 1989;21(1):18–22. doi: 10.1249/00005768-198902000-00004. [DOI] [PubMed] [Google Scholar]
- 25.Gorgey AS, Martin H, Metz A, Khalil RE, Dolbow DR, Gater DR. Longitudinal changes in body composition and metabolic profile between exercise clinical trials in men with chronic spinal cord injury. J Spinal Cord Med. 2016;39(6):699–712. doi: 10.1080/10790268.2016.1157970. [DOI] [PMC free article] [PubMed] [Google Scholar]
- 26.Yarar-Fisher C, Bickel CS, Windham ST, McLain AB, Bamman MM. Skeletal muscle signaling associated with impaired glucose tolerance in spinal cord-injured men and the effects of contractile activity. J Appl Physiol (Bethesda Md 1985) 2013;115(5):756–764. doi: 10.1152/japplphysiol.00122.2013. [DOI] [PMC free article] [PubMed] [Google Scholar]
- 27.Gater DR, Farkas GJ. Alterations in body composition after SCI and the mitigating role of exercise. In: Taylor J, editor. The Physiology of Exercise in Spinal Cord Injury. Boston, MA: Springer; 2016. pp. 175–198. [Google Scholar]
- 28.Gorgey AS, Graham ZA, Bauman WA, Cardozo C, Gater DR. Abundance in proteins expressed after functional electrical stimulation cycling or arm cycling ergometry training in persons with chronic spinal cord injury. J Spinal Cord Med. 2016:1–10. doi: 10.1080/10790268.2016.1229397. [DOI] [PMC free article] [PubMed] [Google Scholar]
- 29.Griffin L, Decker MJ, Hwang JY et al. Functional electrical stimulation cycling improves body composition, metabolic and neural factors in persons with spinal cord injury. J Electromyogr Kinesiol. 2009;19:614–622. doi: 10.1016/j.jelekin.2008.03.002. [DOI] [PubMed] [Google Scholar]
- 30.Gorgey AS, Dolbow DR, Cifu DX, Gater DR. Neuromuscular electrical stimulation attenuates thigh skeletal muscles atrophy but not trunk muscles after spinal cord injury. J Electromyogr Kinesiol. 2013;23:977–984. doi: 10.1016/j.jelekin.2013.04.007. [DOI] [PubMed] [Google Scholar]
- 31.Gorgey AS, Gater DR. Regional and relative adiposity patterns in relation to carbohydrate and lipid metabolism in men with spinal cord injury. Appl Physiol Nutr Metab. 2011;36:107–114. doi: 10.1139/H10-091. [DOI] [PubMed] [Google Scholar]
- 32.Farkas GJ, Gorgey AS, Dolbow DR, Berg AS, Gater DR. The influence of level of spinal cord injury on adipose tissue and its relationship to inflammatory adipokines and cardiometabolic profiles. J Spinal Cord Med. 2017:1–21. doi: 10.1080/10790268.2017.1357918. [DOI] [PMC free article] [PubMed] [Google Scholar]
- 33.Gorgey AS, Mather KJ, Cupp HR, Gater DR. Effects of resistance training on adiposity and metabolism after spinal cord injury. Med Sci Sports Exerc. 2012;44:165–174. doi: 10.1249/MSS.0b013e31822672aa. [DOI] [PubMed] [Google Scholar]
- 34.Weir JB. New methods for calculating metabolic rate with special reference to protein metabolism. J Physiol. 1949;109(1–2):1–9. doi: 10.1113/jphysiol.1949.sp004363. [DOI] [PMC free article] [PubMed] [Google Scholar]
- 35.Gorgey AS, Lawrence J. Acute responses of functional electrical stimulation cycling on the ventilation-to-CO2 production ratio and substrate utilization after spinal cord injury. PM R. 2016;8(3):225–234. doi: 10.1016/j.pmrj.2015.10.006. [DOI] [PubMed] [Google Scholar]
- 36.Kuk JL, Lee S, Heymsfield SB, Ross R. Waist circumference and abdominal adipose tissue distribution: Influence of age and sex. Am J Clin Nutr. 2005;81(6):1330–1334. doi: 10.1093/ajcn/81.6.1330. [DOI] [PubMed] [Google Scholar]
- 37.Dolbow DR, Gorgey AS, Moore JR, Gater DR. Report of practicability of a 6-month home-based functional electrical stimulation cycling program in an individual with tetraplegia. J Spinal Cord Med. 2012;35(3):182–186. doi: 10.1179/2045772312Y.0000000007. [DOI] [PMC free article] [PubMed] [Google Scholar]
- 38.Spungen AM, Bauman WA, Wang J, Pierson RN., Jr The relationship between total body potassium and resting energy expenditure in individuals with paraplegia. Arch Phys Med Rehabil. 1993;74(9):965–968. [PubMed] [Google Scholar]
- 39.Spungen AM, Wang J, Pierson RN, Bauman WA. Soft tissue body composition differences in monozygotic twins discordant for spinal cord injury. J Appl Physiol. 2000;88(4):1310–1315. doi: 10.1152/jappl.2000.88.4.1310. [DOI] [PubMed] [Google Scholar]
- 40.Dolbow DR, Holcomb WR, Gorgey AS. Improving the efficiency of electrical stimulation activities after spinal cord injury. Curr Phys Med Rehabil Rep. 2014;2(3):169–175. doi: 10.1007/s40141-014-0053-2. [DOI] [PMC free article] [PubMed] [Google Scholar]
- 41.Bickel CS, Gregory CM, Dean JC. Motor unit recruitment during neuromuscular electrical stimulation: a critical appraisal. Eur J Appl Physiol. 2011;111(10):2399–2407. doi: 10.1007/s00421-011-2128-4. [DOI] [PubMed] [Google Scholar]
- 42.Gregory CM, Bickel CS. Recruitment patterns in human skeletal muscle during electrical stimulation. Phys Ther. 2005;85(4):358–364. [PubMed] [Google Scholar]
- 43.Gorgey AS, Cho GM, Dolbow DR, Gater DR. Differences in current amplitude evoking leg extension in individuals with spinal cord injury. NeuroRehabilitation. 2013;33:161–170. doi: 10.3233/NRE-130941. [DOI] [PubMed] [Google Scholar]
- 44.Berry HR, Kakebeeke TH, Donaldson N, Perret C, Hunt KJ. Energetics of paraplegic cycling: adaptations to 12 months of high volume training. Technol Health Care. 2012;20(2):73–84. doi: 10.3233/THC-2011-0656. [DOI] [PubMed] [Google Scholar]
- 45.Dearwater SR, Laporte RE, Robertson RJ, Brenes G, Adams LL, Becker D. Activity in the spinal cord-injured patient – an epidemiologic analysis of metabolic parameters. Med Sci Sports Exerc. 1986;18(5):541–544. [PubMed] [Google Scholar]
- 46.Carty A, McCormack K, Coughlan GF, Crowe L, Caulfield B. Increased aerobic fitness after neuromuscular electrical stimulation training in adults with spinal cord injury. Arch Phys Med Rehabil. 2012;93(5):790–795. doi: 10.1016/j.apmr.2011.10.030. [DOI] [PubMed] [Google Scholar]
- 47.Barstow TJ, Scremin AM, Mutton DL, Kunkel CF, Cagle TG, Whipp BJ. Peak and kinetic cardiorespiratory responses during arm and leg exercise in patients with spinal cord injury. Spinal Cord. 2000;38(6):340–345. doi: 10.1038/sj.sc.3101014. [DOI] [PubMed] [Google Scholar]
- 48.Verellen J, Vanlandewijck Y, Andrews B, Wheeler GD. Cardiorespiratory responses during arm ergometry, functional electrical stimulation cycling, and two hybrid exercise conditions in spinal cord injured. Disabil Rehabil Assist Technol. 2007;2(2):127–132. doi: 10.1080/09638280600765712. [DOI] [PubMed] [Google Scholar]
- 49.Bakkum AJ, de Groot S, Stolwijk-Swüste JM, van Kuppevelt DJ, van der Woude LH, Janssen TW. Effects of hybrid cycling versus handcycling on wheelchair-specific fitness and physical activity in people with long-term spinal cord injury: a 16-week randomized controlled trial. Spinal Cord. 2015;53(5):395–401. doi: 10.1038/sc.2014.237. [DOI] [PubMed] [Google Scholar]
- 50.Hasnan N, Ektas N, Tanhoffer AI et al. Exercise responses during functional electrical stimulation cycling in individuals with spinal cord injury. Med Sci Sports Exerc. 2013;45(6):1131–1138. doi: 10.1249/MSS.0b013e3182805d5a. [DOI] [PubMed] [Google Scholar]
- 51.Tørhaug T, Brurok B, Hoff J, Helgerud J, Leivseth G. Arm cycling combined with passive leg cycling enhances VO(2peak) in persons with spinal cord injury above the sixth thoracic vertebra. Top Spinal Cord Inj Rehabil. 2018;24(1):86–95. doi: 10.1310/sci17-00029. [DOI] [PMC free article] [PubMed] [Google Scholar]
- 52.Hooker SP, Figoni SF, Rodgers MM et al. Metabolic and hemodynamic responses to concurrent voluntary arm crank and electrical stimulation leg cycle exercise in quadriplegics. J Rehabil Res Dev. 1992;29(3):1–11. doi: 10.1682/jrrd.1992.07.0001. [DOI] [PubMed] [Google Scholar]
- 53.Hettinga DM, Andrews BJ. Oxygen consumption during functional electrical stimulation-assisted exercise in persons with spinal cord injury: implications for fitness and health. Sports Med (Auckland NZ) 2008;38(10):825–838. doi: 10.2165/00007256-200838100-00003. [DOI] [PubMed] [Google Scholar]
- 54.Bakkum AJT, Paulson TAW, Bishop NC et al. Effects of hybrid cycle and handcycle exercise on cardiovascular disease risk factors in people with spinal cord injury: a randomized controlled trial. J Rehabil Med. 2015;47(6):523–530. doi: 10.2340/16501977-1946. [DOI] [PubMed] [Google Scholar]
- 55.Horiuchi M, Okita K. Arm-cranking exercise training reduces plasminogen activator inhibitor 1 in people with spinal cord injury. Arch Phys Med Rehabil. 2017;98(11):2174–2180. doi: 10.1016/j.apmr.2017.02.007. [DOI] [PubMed] [Google Scholar]
- 56.Nightingale TE, Walhin J-P, Thompson D, Bilzon JLJ. Impact of exercise on cardiometabolic component risks in spinal cord-injured humans. Med Sci Sports Exerc. 2017;49(12):2469–2477. doi: 10.1249/MSS.0000000000001390. [DOI] [PMC free article] [PubMed] [Google Scholar]
- 57.Farkas GJ, Pitot MA, Berg AS, Gater DR. Nutritional status in chronic spinal cord injury: a systematic review and meta-analysis. Spinal Cord. 2019;57(1):3–17. doi: 10.1038/s41393-018-0218-4. [DOI] [PubMed] [Google Scholar]
- 58.Dolbow DR, Credeur DP, Lemacks JL et al. Electrically induced cycling and nutritional counseling for counteracting obesity after spinal cord injury: a pilot study. J Spinal Cord Med. 2020:1–8. doi: 10.1080/10790268.2019.1710939. [DOI] [PMC free article] [PubMed] [Google Scholar]
- 59.Skold C, Lonn L, Harms-Ringdahl K et al. Effects of functional electrical stimulation training for six months on body composition and spasticity in motor complete tetraplegic spinal cord-injured individuals. J Rehabil Med. 2002;34(1):25–32. doi: 10.1080/165019702317242677. [DOI] [PubMed] [Google Scholar]
- 60.Demchak TJ, Linderman JK, Mysiw WJ, Jackson R, Suun J, Devor ST. Effects of functional electric stimulation cycle ergometry training on lower limb musculature in acute SCI individuals. J Sports Sci Med. 2005;4(3):263–271. [PMC free article] [PubMed] [Google Scholar]