Abstract
Purpose
To compare an individual’s Personal Performance in Mammographic Screening (PERFORMS) score with their Breast Screening Information System (BSIS) real-life performance data and determine which parameters in the PERFORMS scheme offer the best reflection of BSIS real-life performance metrics.
Materials and Methods
In this retrospective study, the BSIS real-life performance metrics of individual readers (n = 452) in the National Health Service Breast Screening Program (NHSBSP) in England were compared with performance in the test set–based assessment scheme over a 3-year period from 2013 to 2016. Cancer detection rate (CDR), recall rate, and positive predictive value (PPV) were calculated for each reader, for both real-life screening and the PERFORMS test. For each metric, real-life and test set versions were compared using a Pearson correlation. The real-life CDR, recall rate, and PPV of outliers were compared against other readers (nonoutliers) using analysis of variance.
Results
BSIS real-life CDRs, recall rates, and PPVs showed positive correlations with the equivalent PERFORMS measures (P < .001, P = .002, and P < .001, respectively). The mean real-life CDR of PERFORMS outliers was 7.2 per 1000 women screened and was significantly lower than other readers (nonoutliers) where the real-life CDR was 7.9 (P = .002). The mean real-life screening PPV of PERFORMS outliers was 0.14% and was significantly lower than the nonoutlier group who had a mean PPV of 0.17% (P = .006).
Conclusion
The use of test set–based assessment schemes in a breast screening program has the potential to predict and identify poor performance in real life.
© RSNA, 2020
Keywords: Breast, Screening
See also the commentary by Thigpen and Rapelyea in this issue.
Summary
The use of a test set–based assessment scheme (Personal Performance in Mammographic Screening) in a breast screening program has the potential to predict and identify poor performance in real life.
Key Points
■ Readers’ Breast Screening Information System (BSIS) real-life performance significantly correlated with Personal Performance in Mammographic Screening (PERFORMS) test for cancer detection rates (CDRs) (r = 0.179, P < .001), recall rates (r = 0.146, P = .002), and positive predictive value (PPV) (r = 0.263, P < .001).
■ Outliers in PERFORMS had significantly poorer real-life CDR and PPV of recall compared with the nonoutlier group of readers.
■ The PERFORMS test has the potential to predict readers’ performance and can be used to determine potential reading problems.
Introduction
There has been considerable interest in recent years for the assessment of the performance of health care personnel. Individuals providing care have a duty to demonstrate satisfactory performance, forming part of appraisal and revalidation. Measuring individual performance has the potential to improve the quality of services offered, inform the public, determine potential problems, and provide supportive further training (1).
Breast radiology in the United Kingdom, particularly in the context of the National Health Service Breast Screening Programme (NHSBSP), has always had its performance heavily audited as part of the quality assurance process, which is integral to the service. Data on each of the screening centers have been collected and published since program inception in 1988 (2). In addition, to provide a measure of individual performance, a test set–based system called PERFORMS (Personal Performance in Mammographic Screening) has been running for more than 30 years (3). Participants whose performance in the scheme is below a minimum acceptable standard (statistically significantly lower than that of the main body of readers) are flagged up as “outliers,” and further action is taken, such as reviewing practice, offering suggestions, or further training.
There has been criticism that test set–based performance schemes may suffer from a “laboratory effect” and not be a true reflection of real-life performance. Many studies demonstrate that experimental conditions can affect human behavior (4). Test sets, by their very nature, are heavily enriched with cancer cases, and the reader knows that any decisions they make in the test environment will have no patient impact and so reading behavior may be altered (5).
Recently, the UK Breast Screening Information System (BSIS), which provides national and local performance statistics for the NHSBSP, has produced individual real-life performance data over rolling 3-year periods. The aim of this study was to compare an individual’s PERFORMS test set scores with their real-life performance data and determine which parameters in the PERFORMS scheme offer the best reflection of real-life performance metrics. In addition, this study aimed to determine whether the outlier status in the PERFORMS scheme is a true predictor of poor performance in real life.
Materials and Methods
Study Design
All 706 readers who interpret screening mammograms for the NHSBSP in England and who take part in the PERFORMS self-assessment test were invited to participate in the study. Ethics approval was waived, following discussion with the local research and development team, as this retrospective comparison was considered to represent an audit of current practice. The study was carried out in accordance with the local information system security policy, data protection policy, and associated codes of practice and guidelines, with participants giving informed consent for their performance data to be accessed.
A total of 582 readers consented for their real-life data to be accessed for the study. Real-life data were obtained from BSIS for the 3-year period 2013–2016. Study participants had to have completed at least five rounds of the PERFORMS self-assessment scheme (ie, five sets of 60 cases) within 36 months of the BSIS real-life screening data period. The NHSBSP requires readers to interpret 5000 mammograms each year, but at least 1500 of these have to be as a first reader (3). Consequently, participants had to read at least 1500 screening cases per year as a first reader, and no less than a total of 4500 cases as a first reader over the 3-year period of the study to be included. In addition, participants were excluded if their real-life data could not be identified or matched with their PERFORMS data. Consequently, a total of 452 readers were available for the comparison. The flowchart in Figure 1 outlines the recruitment process and exclusion criteria.
Figure 1:
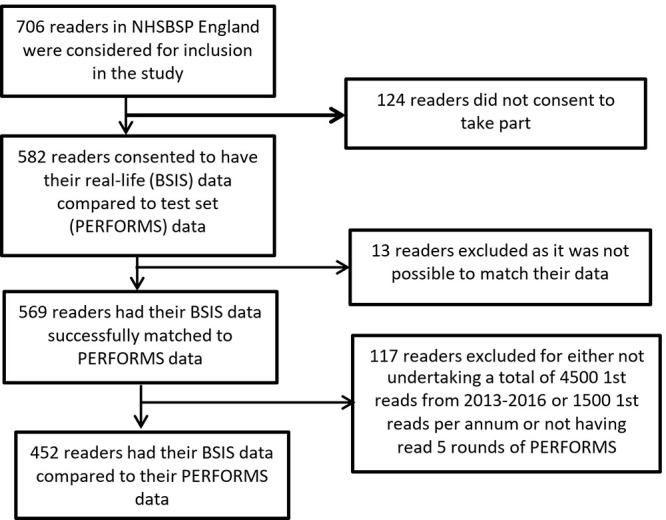
Flowchart shows enrollment of readers into the study. BSIS = Breast Screening Information System, NHSBSP = National Health Service Breast Screening Programme, PERFORMS = Personal Performance in Mammographic Screening.
PERFORMS Image Assessment
The PERFORMS scheme involves the circulation of test sets of 60 challenging cases, consisting of normal, benign, and abnormal mammograms. The test sets are heavily enriched with biopsy-proven cancers (typically around 35%), with radiologic features of masses, calcifications, asymmetries, and distortions. Benign and normal cases are either biopsy proven or have at least 3 years of mammographic follow-up. Cases are chosen by the scheme organizers in conjunction with a national panel of 10 expert breast radiologists, each with at least 20 years of experience working in the NHSBSP from a pool contributed by all UK screening centers. PERFORMS is currently undertaken by more than 800 readers in the United Kingdom (6) as part of the quality assurance for the NHSBSP (7). Readers in the UK screening program include board-certified radiologists, radiographers, or breast clinicians (physicians who are not radiologists, working in the field of breast diagnosis). Nonradiologists typically make up half the readers in the UK program and are trained to master’s level or equivalent and, along with the radiologists, have to undertake the reading of a minimum of 5000 mammograms per year (8).
The test-set images are uploaded to the picture archiving and communication system at each screening center where they can be viewed. Readers’ findings are recorded on a password-protected website, and participants receive immediate feedback on each case at the end of the set, compared with pathologic findings, and an opinion derived from a national panel of experts who provide a commentary on the radiologic appearances of the cancers and the appropriateness of recall for the normal and benign cases. Once completed by all readers, comprehensive performance statistics are produced providing an individual with a comparison with their peers nationally. Data are produced on correct recall for further assessment, correct return to normal screening, cancer detection rate (CDR), and the negative and positive predictive value (PPV) of recall based on pathologic findings.
Test Standards
The NHSBSP uses double reading as standard and so the performance data produced primarily focus on the opinion of the individual as a first reader. In many centers, the second reader is not blinded to the opinion of the first reader and so the first read is the only truly unbiased read. The data extracted included a unique reader code, screening center name, number of cases read as first reader, number of recalled cases, cancers detected as first reader, as well as rate of discrepant cancers per year (defined as cancers missed by the first reader that were subsequently identified by the second reader). Comparative results from the PERFORMS tests sets were obtained from the PERFORMS database, which consisted of reader identification number, screening center name, correct and incorrect recall, correct return to screening, and missed cancer rates.
Measures of sensitivity were selected to be analogous in real-life screening and in test set–based performance. In real-life screening, the CDR was calculated as the number of women in whom cancer was detected per 1000 women screened. For PERFORMS, the CDR was calculated as the percentage of cancers detected of the total number of cases in the test set. PPV was calculated as the total number of cancers detected of the total number of cases recalled, for both real-life screening performance and the test set–based performance: the number of true-positive findings divided by the number of true-positive findings plus false-positive findings. The real-life BSIS data cannot provide a true specificity measure or a negative predictive value. Due to the development of cancers between screening rounds (interval cancers), determining which cases are true-negative findings and false-negative findings will not become apparent for many years. Consequently, in real-life screening, the recall rate is used as a proxy for specificity. Recall rate was calculated as the total number of cases recalled of the total number of cases read, for both the real-life screening and test set–based performance measures.
Statistical Analysis
CDR, recall rate, and PPV measures were calculated from the PERFORMS data and from the BSIS real-life data, yielding two values per reader for each metric: one real-life screening–based value and one test set–based value. For each of these measures, a Pearson correlation between the PERFORMS test set data and BSIS real-life screening data was examined. Further analysis assessed whether those readers whose performance on the PERFORMS test was deemed to be below the minimum acceptable standard (the outliers) had significantly poorer performance on the BSIS real-life screening measures. PERFORMS outliers are readers whose test performance falls more than one and a half times the interquartile range below the 25th percentile in terms of either CDR in the PERFORMS test set or the area under the curve of the receiver operating characteristic analysis of their test set performance (or both). For the purposes of this study, any reader who had been an outlier on any of the PERFORMS test sets included in the 3-year period was allocated into an “outliers” group. The real-life CDRs, recall rates, and PPVs of PERFORMS outliers were then compared against those of other readers using analysis of variance (ANOVA). The α level for statistical significance was set at .05 for all analyses. Statistical calculations were performed using the IBM SPSS Statistics (version 23.0) statistical software (SPSS, Chicago, Ill).
Results
Participant Performance Overview
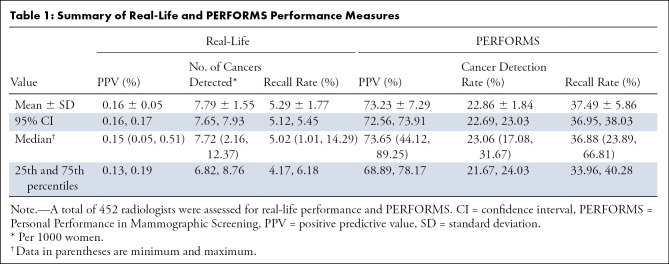
In total, 452 participants (238 board-certified radiologists, 193 radiographer readers, and 21 breast clinicians) consented and were eligible to take part in the study. The mean CDR from the BSIS real-life data were 7.79 per 1000 women screened (0.78%) with a mean recall rate of 5.29%. Each PERFORMS test set of 60 cases is heavily enriched with cancers; the number of cancer cases varied between 34 and 38 for the PERFORMS sets included in this study. The mean CDR in the PERFORMS test sets was 22.86% with a mean recall rate of 37.49%. A summary of the BSIS real-life and PERFORMS performance measures for the participants is given in Table 1.
Table 1:
Summary of Real-Life and PERFORMS Performance Measures
Test Measures Assessed from BSIS Real-Life and PERFORMS Correlate
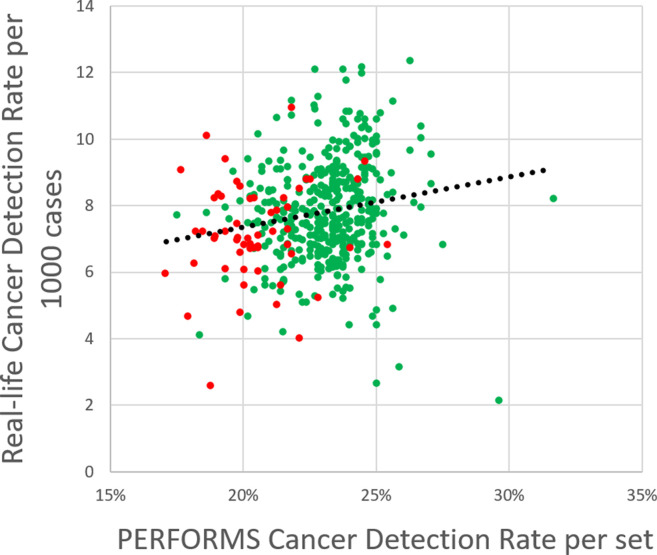
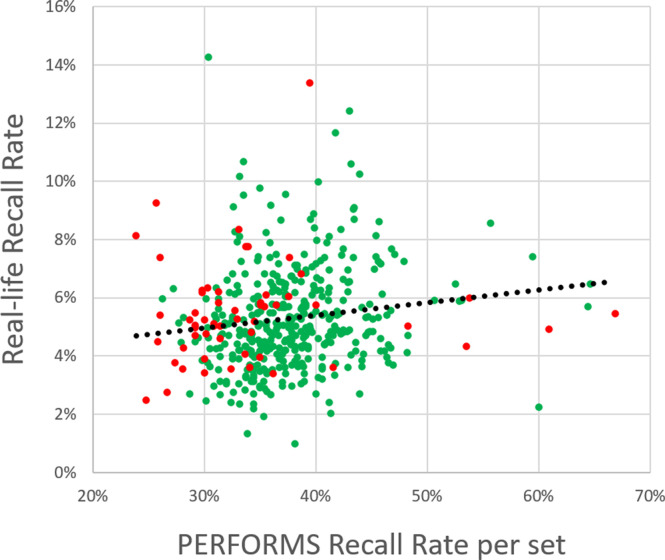
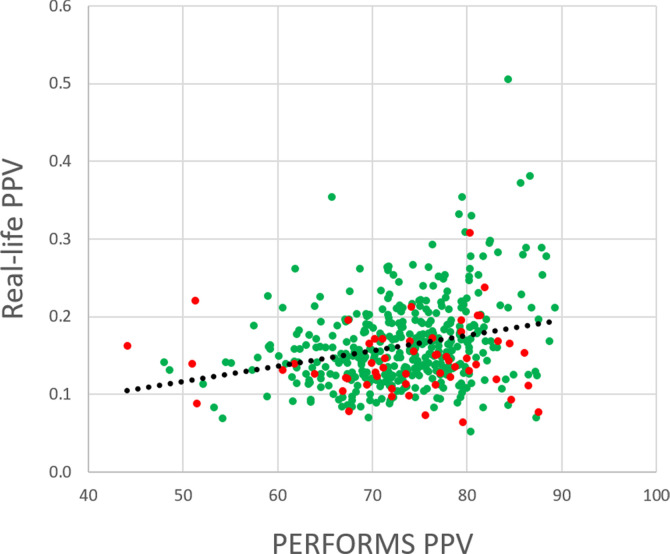
BSIS real-life CDRs, recall rates, and PPVs showed significant positive correlations with the equivalent PERFORMS measures (n = 452). Readers with a higher CDR in real life tended to have a higher CDR in PERFORMS (two-tailed Pearson correlation: r = 0.179, P < .001) (Fig 2a). Readers with a higher recall rate in real-life screening tended to have a higher recall rate in PERFORMS (two-tailed Pearson correlation: r = 0.146, P = .002) (Fig 2b). PPV, the probability that a patient recalled following screening mammography has a confirmed breast malignancy, reflects a combination of CDR and recall rate. Readers with a higher PPV in real-life screening tended to have a higher PPV in PERFORMS (two-tailed Pearson correlation: r = 0.263, P < .001; Fig 2c). It is noted that, as PPV is affected by the prevalence of the disease, PPVs in the test set data were considerably higher than in the real-life data, reflecting the difference in the prevalence of cancers in the two data sets.
Figure 2a:
Plots show correlation between (a) cancer detection rates, (b) recall rate, and (c) positive predictive value (PPV) in real life and in the Personal Performance in Mammographic Screening (PERFORMS) test sets. Outliers are shown in red, and nonoutliers are shown in green.
Figure 2b:
Plots show correlation between (a) cancer detection rates, (b) recall rate, and (c) positive predictive value (PPV) in real life and in the Personal Performance in Mammographic Screening (PERFORMS) test sets. Outliers are shown in red, and nonoutliers are shown in green.
Figure 2c:
Plots show correlation between (a) cancer detection rates, (b) recall rate, and (c) positive predictive value (PPV) in real life and in the Personal Performance in Mammographic Screening (PERFORMS) test sets. Outliers are shown in red, and nonoutliers are shown in green.
Comparison of Outliers and Nonoutliers
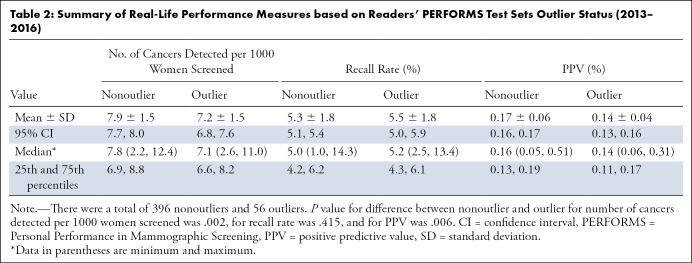
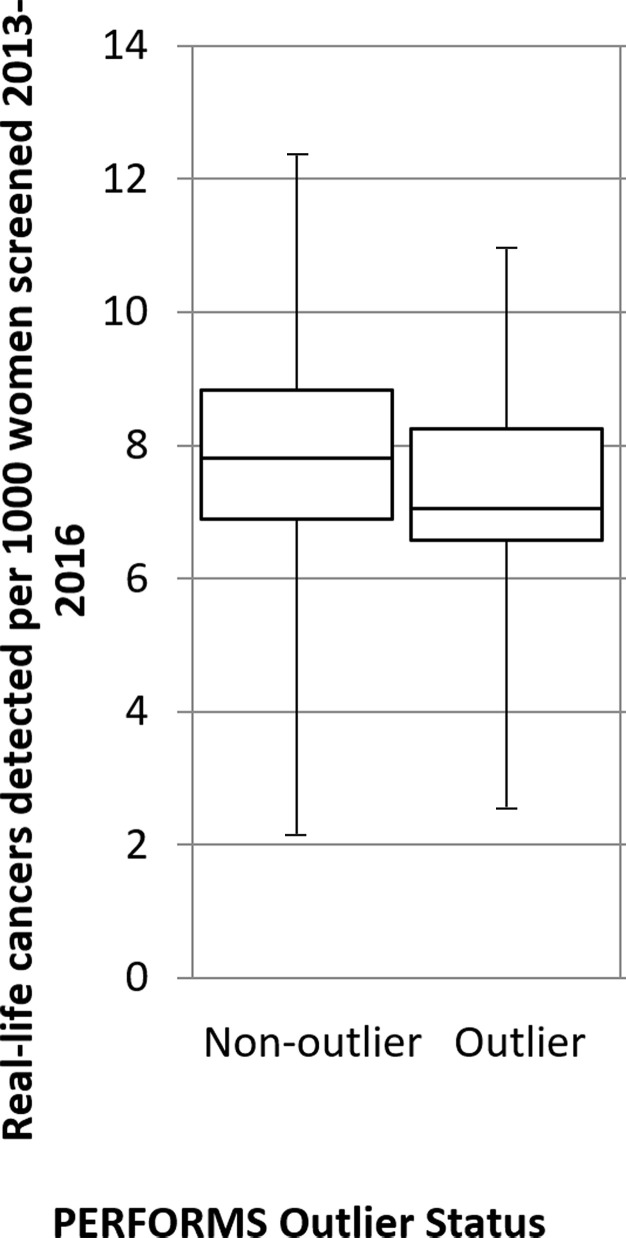
Outliers in the PERFORMS scheme were found to have significantly lower performance than other readers in real-life screening in terms of CDR and PPV, but did not differ significantly in terms of recall rate (Table 2). The mean BSIS real-life screening CDR of PERFORMS outliers was 7.2 per 1000 women screened and was significantly lower than other readers (nonoutliers) where the CDR was 7.9 per 1000 women screened (ANOVA F [1, 450] = 9.78, P = .002, ω = 0.014) (Fig 3a). The mean BSIS real-life screening recall rate of PERFORMS outliers was 5.5% and was not different from that of other readers who had a mean of 5.3% (ANOVA F [1, 450]) = 0.67, P = .415, ω = 0.003) (Fig 3b). The mean BSIS real-life screening PPV of PERFORMS outliers was 0.14% and was significantly lower than the nonoutlier group who had a mean PPV of 0.17% (ANOVA F [1, 450] = 7.75, P = .006, ω = 0.012) (Fig 3c).
Table 2:
Summary of Real-Life Performance Measures based on Readers’ PERFORMS Test Sets Outlier Status (2013–2016)
Figure 3a:
A total of 396 nonoutliers and 56 outliers were assessed for their cancer detection rates per 1000 women, recall rates, and positive predictive value (PPV). Box-and-whisker plots show (a) real-life cancer detection rates, (b) real-life recall rates, and (c) real-life PPVs based on whether readers were an outlier in the Personal Performance in Mammographic Screening (PERFORMS) test sets. The 95% confidence limits are shown on each plot.
Figure 3b:
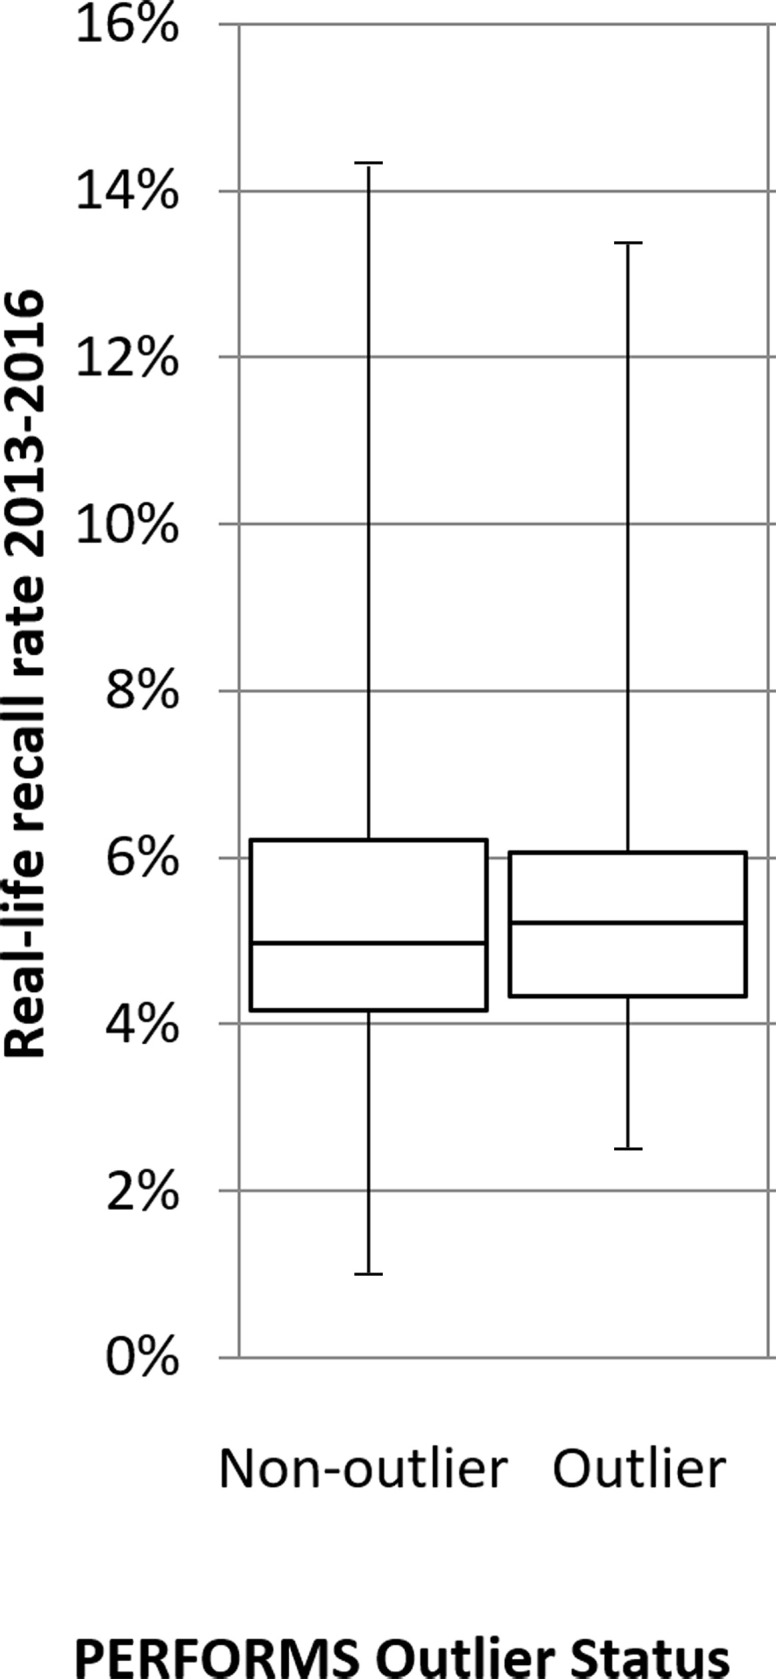
A total of 396 nonoutliers and 56 outliers were assessed for their cancer detection rates per 1000 women, recall rates, and positive predictive value (PPV). Box-and-whisker plots show (a) real-life cancer detection rates, (b) real-life recall rates, and (c) real-life PPVs based on whether readers were an outlier in the Personal Performance in Mammographic Screening (PERFORMS) test sets. The 95% confidence limits are shown on each plot.
Figure 3c:
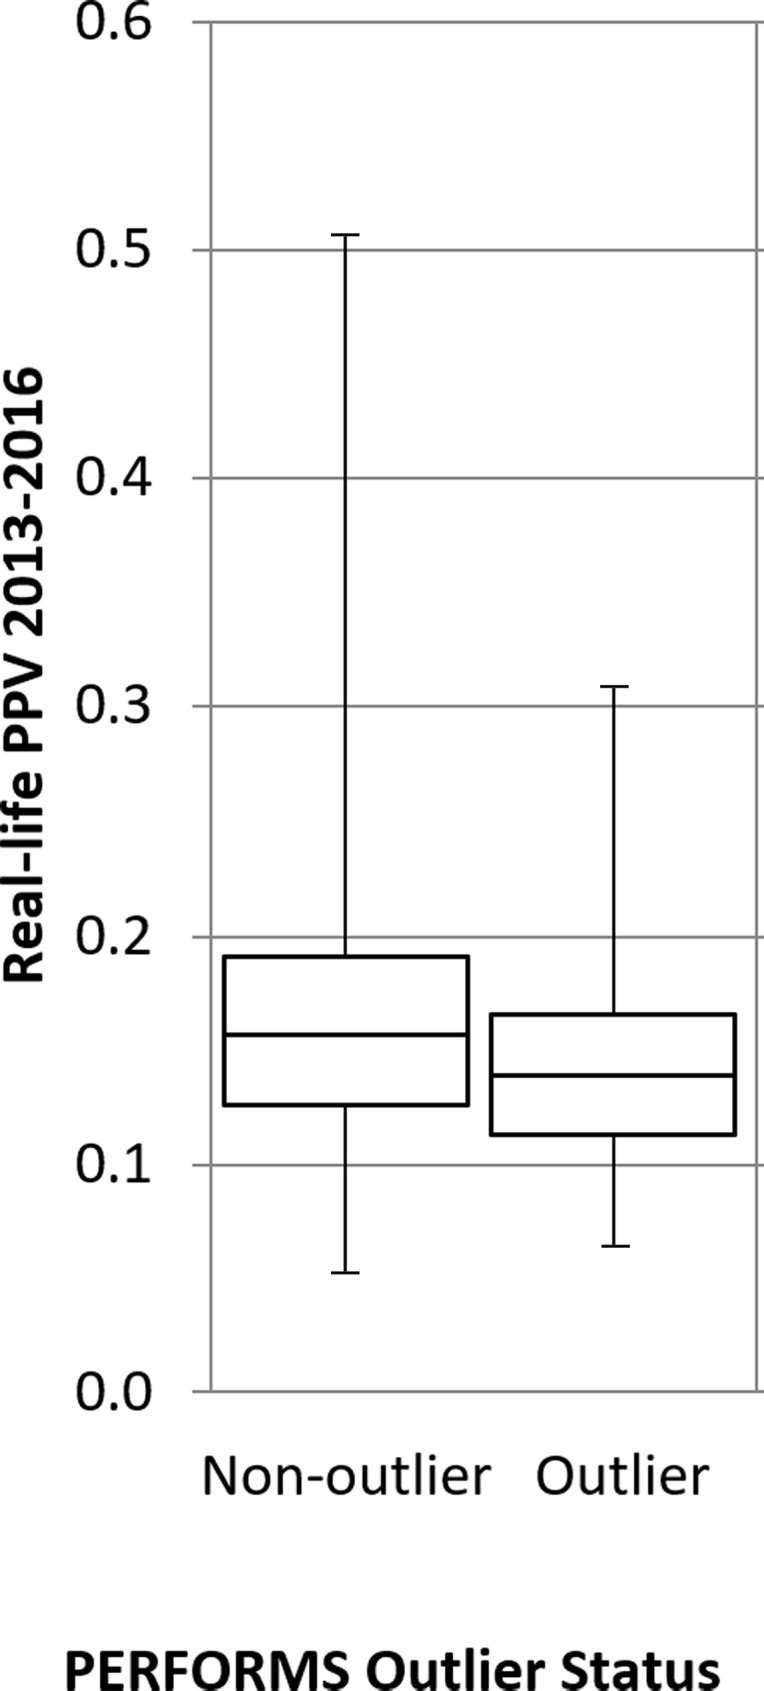
A total of 396 nonoutliers and 56 outliers were assessed for their cancer detection rates per 1000 women, recall rates, and positive predictive value (PPV). Box-and-whisker plots show (a) real-life cancer detection rates, (b) real-life recall rates, and (c) real-life PPVs based on whether readers were an outlier in the Personal Performance in Mammographic Screening (PERFORMS) test sets. The 95% confidence limits are shown on each plot.
Discussion
This study was designed to determine if performance in the PERFORMS test set scheme reflected BSIS real-life performance. Test set performance demonstrated significant positive correlations with the BSIS real-life performance metrics produced by the UK screening program; that is, CDR (r = 0.179, P < .001), recall rate (r = 0.146, P = .002), and PPV (r = 0.263, P < .001) all showed strong correlations. For breast cancer screening to be successful, CDRs need to be optimized, but at the same time, recall rates need to be kept as low as possible to avoid false-positive interpretation and recalls. There will always be a trade-off between recalling women for further investigation and detecting cancers, which is reflected in the PPV. Recall rates act as a proxy for specificity in real-life screening, due to the difficulty in identifying true-negative findings and false-negative findings at the time of reading. However, recall rates are not a perfect measure of specificity. Recall rates need to be interpreted in conjunction with cancer detection: Both low and high recall rates would be acceptable in the context of high cancer detection, whereas in isolation, extreme recall rates may raise concerns about a reader’s performance.
Correlation between BSIS real-life recall rates and PERFORMS correct recall rates was the weakest of the performance metrics, although it did reach statistical significance (r = 0.146, P = .002). One of the criticisms of test sets is that reading behavior may be altered. This weaker correlation is probably not surprising, as it has been previously demonstrated that recall rates are particularly prone to this “laboratory’’ effect, as readers know that flagging a patient for recall will have no impact on patient care (4).
Previous studies comparing test set and real-life performance have shown consistently positive relationships, albeit weak in some instances (9–11). One of the strengths of this study is that it has been possible to compare real-life performance data with results from a test set scheme in a large group of readers. Soh et al reported reasonable levels of agreement (P < .01) between actual clinical reporting and test set conditions, although increased sensitivity was seen under test set conditions (11). This study of 452 participants demonstrated much stronger associations than a previous smaller study of 40 readers from one UK region taking part in the same PERFORMS scheme in 2005 and 2006 (10). PPV of recall demonstrated the strongest correlation between BSIS real-life and PERFORMS data for all participants. PPV is one of the most useful measures of performance (12).
Real-life performance data are often considered the reference standard. However, the accuracy of sensitivity and specificity of real-life breast cancer screening data is problematic (13). Reader sensitivity, which is defined as the proportion of patients with breast cancer reported as positive, is not known for several years until interval cancer data become available, and even then real-life data may not be updated to reflect this. Due to this unavoidable time lag, the opportunity to introduce timely interventions to improve performance is lost. Similarly, when measuring specificity as the proportion of disease-free patients reported as negative, a truly negative mammogram will not be apparent until after the next screening round at the earliest. One of the advantages of test sets like PERFORMS is that normal, benign, and malignant cases with known, biopsy-proven outcomes and appropriate follow-up can be selected for inclusion, providing potentially more accurate performance metrics. For instance, when choosing cases for PERFORMS, a normal case will only be included if the mammogram at the next screening round 3 years later is also normal.
One of the key functions of measuring performance is to identify potential problems at the earliest opportunity to allow interventions to change practice. Real-life data are by their very nature retrospective. CDRs of around 7–8 per 1000 women screened mean that an individual reader is exposed to relatively few cancers each year. Consequently, it can be difficult to identify poor performance because of the statistical instability from the relatively small number of cancer cases; similar problems are encountered when measuring performance in NHSBSP screening centers with the smallest number of clients (14). BSIS audit data are combined over a 3-year period to improve the statistical robustness of the performance measures, but even so, many years of poor performance may occur before this becomes apparent through clinical audit, resulting in potential harm to the screening population. For many years, the PERFORMS scheme has flagged up poor performance outliers where metrics have deviated significantly from the mean. Individuals and the regional quality assurance office are notified so that corrective measures can be instigated, such as reviewing practice or further training. PERFORMS has the potential to identify underperformance at a much earlier stage than real-life data, perhaps even before a reader takes part in the screening program as part of an end of training or pre-employment assessment. If test sets are to be used in this way, then it is crucial that the results are validated against real-life data. In this study, being a poor performance outlier in PERFORMS predicted poor real-life performance, with outliers having significantly poorer real-life CDR and PPV of recall compared with the nonoutlier group of readers. This study did have limitations. Nearly 20% of PERFORMS participants (124 readers) declined to have their data used and so this has to be considered a potential source of bias. Further work is needed to understand if this group had any particular characteristics.
In conclusion, there are significant correlations between real-life readers’ performance in a breast screening program and their performance on metrics generated from a test set–based assessment scheme such as PERFORMS. Readers’ PPV of recall in real-life screening and the test sets showed the strongest correlations. The use of test set–based assessment schemes has the potential to predict and identify potential poor performance outliers in real-life screening, enabling corrective measures to be implemented in a timely fashion.
Footnotes
Abbreviations:
- ANOVA
- analysis of variance
- BSIS
- Breast Screening Information System
- CDR
- cancer detection rate
- NHSBSP
- National Health Service Breast Screening Programme
- PERFORMS
- Personal Performance in Mammographic Screening
- PPV
- positive predictive value
References
- 1.Hall LH, Johnson J, Watt I, Tsipa A, O’Connor DB. Healthcare Staff Wellbeing, Burnout, and Patient Safety: A Systematic Review. PLoS One 2016;11(7):e0159015. [DOI] [PMC free article] [PubMed] [Google Scholar]
- 2.Cohen SL, Blanks RG, Jenkins J, Kearins O. Role of performance metrics in breast screening imaging - where are we and where should we be? Clin Radiol 2018;73(4):381–388. [DOI] [PubMed] [Google Scholar]
- 3.Chen Y, Gale A. Performance assessment using standardized data sets: The PERFORMS scheme in breast screening and other domains. In: Samei E, Krupinski EA, eds. The Handbook of Medical Image Perception and Techniques. 2nd ed. Cambridge, England: Cambridge University Press, 2018; 328–342. [Google Scholar]
- 4.Egglin TKP, Feinstein AR. Context bias. A problem in diagnostic radiology. JAMA 1996;276(21):1752–1755. [DOI] [PubMed] [Google Scholar]
- 5.Gur D, Bandos AI, Cohen CS, et al. The “laboratory” effect: comparing radiologists’ performance and variability during prospective clinical and laboratory mammography interpretations. Radiology 2008;249(1):47–53. [DOI] [PMC free article] [PubMed] [Google Scholar]
- 6.NHS public health functions agreement 2018-19; Public health functions to be exercised by NHS England. EU, International and Prevention Programmes, Global and Public Health Group, Public Health Systems and Strategy ; Department of Health and Social Care website. https://assets.publishing.service.gov.uk/government/uploads/system/uploads/attachment_data/file/694130/nhs-public-functions-agreement-2018-2019.pdf. Published March 26, 2018. Accessed May 12, 2018.
- 7.Programme Specific Operating Model for Quality Assurance of breast screening Programmes . Government UK website. https://www.gov.uk/government/publications/breast-screening-programme-specific-operating-model Published July 2017. Accessed August 15, 2019.
- 8.Quality assurance guidelines for breast cancer screening radiology . NHS Cancer Screening Programmes website. https://assets.publishing.service.gov.uk/government/uploads/system/uploads/attachment_data/file/764452/Quality_assurance_guidelines_for_breast_cancer_screening_radiology_updated_Dec_2018.pdf. Published March 2011. Accessed April 6, 2020.
- 9.Soh BP, Lee W, Kench PL, et al. Assessing reader performance in radiology, an imperfect science: lessons from breast screening. Clin Radiol 2012;67(7):623–628. [DOI] [PubMed] [Google Scholar]
- 10.Scott HJ, Evans A, Gale AG, Murphy A, Reed J. The relationship between real life breast screening and an annual self-assessment scheme. In: Sahiner B, Manning DJ, eds. Proceedings of SPIE: medical imaging 2009—image perception, observer performance, and technology assessment. Vol 7263. Bellingham, Wash: International Society for Optics and Photonics, 2009; 72631E. [Google Scholar]
- 11.Soh BP, Lee W, McEntee MF, et al. Screening mammography: test set data can reasonably describe actual clinical reporting. Radiology 2013;268(1):46–53. [DOI] [PMC free article] [PubMed] [Google Scholar]
- 12.Bennett RL, Blanks RG. Should a standard be defined for the Positive Predictive Value (PPV) of recall in the UK NHS Breast Screening Programme? Breast 2007;16(1):55–59. [DOI] [PubMed] [Google Scholar]
- 13.Rutter CM, Taplin S. Assessing mammographers’ accuracy. A comparison of clinical and test performance. J Clin Epidemiol 2000;53(5):443–450. [DOI] [PubMed] [Google Scholar]
- 14.Blanks RG, Bennett RL, Wallis MG, Moss SM. Does individual programme size affect screening performance? Results from the United Kingdom NHS breast screening programme. J Med Screen 2002;9(1):11–14. [DOI] [PubMed] [Google Scholar]


