Abstract
Purpose
To investigate the prognostic value of differential enhancement on baseline dual-energy CT images in patients with treatment-naive pancreatic ductal adenocarcinoma (PDAC), with a focus on tumor-host interface characterization.
Materials and Methods
This was a retrospective, institutional review board–approved, Health Insurance Portability and Accountability Act–compliant study of 158 consecutive adult patients (mean age, 68 years; age range, 40.9–88.9 years; 50% women) with histopathologically proven, treatment-naive PDAC, who had undergone multiphasic pancreatic dual-energy CT from December 2011 to March 2017. Regions of interest in tumor core, tumor border, pancreas border with tumor, nontumoral pancreas, and aorta were recorded on pancreatic parenchymal phase (PPP) dual-energy CT 70-keV, 52-keV, and iodine material density (MD) images, plus portal venous phase (PVP) conventional CT images. Enhancement gradient (delta) across the tumor-pancreas interface was calculated. Delta was evaluated combining the dual-energy CT values with the PVP values and as individual predictors. Receiver operating characteristic analysis with logistic regression was used to determine the optimal cut point for each dual-energy CT delta to predict disease outcome based on highest Youden index. Survival curves were generated using Kaplan-Meier method, and comparison between two independent groups (high and low delta) was evaluated with log-rank test. Clinical outcomes included overall survival and distant metastasis–free survival. Three independent blinded radiologists visually scored tumor conspicuity (subjective delta score) on a 1–5 scale, and agreement was evaluated with κ statistic.
Results
Ninety-three patients had advanced stage (50 locally advanced and 43 metastatic) and 65 had lower stage (48 resectable and 17 borderline resectable) tumors. Patients with high delta tumors (≥ 40 HU) on either 70-keV PPP images or conventional PVP images had significantly shorter overall survival compared with those with low delta tumors (< 40 HU) in both early stage PDAC (13.5 months vs 23.3 months; hazard ratio [HR], 1.87; 95% confidence interval [CI]: 1.01, 3.5; P = .04) and advanced stage PDAC (10.8 months vs 18.0 months; HR, 2.1; 95% CI: 1.28, 3.6; P = .003). Qualitative visual scoring of tumor conspicuity also showed shorter overall survival in patients with more conspicuous tumors. Highest interreader agreement for subjective delta score was 0.73 and 0.60 using iodine MD and 52-keV images, respectively.
Conclusion
Increased quantitative and qualitative border conspicuity (high delta) is associated with shorter survival in patients with PDAC. Agreement on the subjective qualitative characterization of PDAC borders is best achieved using iodine MD and lower-energy simulated monoenergetic images at pancreatic protocol dual-energy CT.
Keywords: Abdomen/GI, CT, CT-Dual Energy, CT-Quantitative, Pancreas
Supplemental material is available for this article.
© RSNA, 2020
Summary
Patients with pancreatic ductal adenocarcinoma tumors that demonstrate high tumor-host enhancement gradient (delta) have poorer clinical outcomes, measured by overall survival and distant metastasis–free survival, across different stages of pancreatic cancer.
Key Points
■ Well-defined tumor-host interface (delta) on dual-energy CT simulated monoenergetic 70-keV, 52-keV, and iodine material density images is a candidate imaging biomarker that is associated with poorer prognosis in patients with pancreatic ductal adenocarcinoma (PDAC).
■ Characterization of tumor-host interface is achievable with quantitative and qualitative approaches.
■ Optimal prognostication of tumor-host interface for PDAC is produced by combining delta on dual-energy CT pancreatic parenchymal and conventional venous phase images.
Introduction
Although nearly uniformly fatal, pancreatic ductal adenocarcinoma (PDAC) is a heterogeneous disease with discrepant clinical presentations, genetics, and biologic aggressiveness and measurable patient outcomes. Differences in survival length in this deadly disease could be related to biophysical properties of individual tumors. For example, PDAC exhibits several histopathologic and cellular features that can be considered physical barriers to effective drug delivery, including disorganized, leaky, and nonfunctional vasculature, as well as dense stroma and deregulated cellular transport proteins (1). In a clinical trial published by Koay et al, differential tumor enhancement measured on conventional single-energy pancreatic protocol multidetector CT scans correlated with tumor stroma score and intratumoral gemcitabine DNA incorporation (2). The same group also reported that PDAC tumors with a well-defined tumor-to-nontumoral interface at CT (called “high delta” tumors) are associated with these more aggressive biologic features than tumors with an ill-defined interface (called “low delta” tumors) and that patients with high delta tumors at CT had significantly shorter time to distant metastasis and shorter overall survival (OS) (3). Because a considerable number of PDAC tumors are isoattenuating or slightly hypodense to the normal pancreas at conventional CT, lesion border characterization can be difficult (4). To overcome this obstacle, dual-energy CT can improve PDAC visualization (5,6) by taking advantage of the increased attenuation of iodine at photon energy levels closer to the iodine K edge (33 keV) or using material decomposition techniques that map the concentration of iodine to improve the conspicuity of enhancing structures (7) and soft-tissue tumors in the abdomen.
The purpose of our study was to use dual-energy CT to optimize visualization of the tumor interface in patients with PDAC to predict outcomes. The first objective was to externally validate the tumor conspicuity (delta score) as a predictive and prognostic candidate biomarker using dual-energy CT simulated monoenergetic 70-keV pancreatic parenchymal phase (PPP) images combined with conventional portal venous phase (PVP) images. The second objective was to assess whether the observed quantitative enhancement patterns of PDAC tumors on the different dual-energy CT–specific image types predict tumor biologic activity and clinical outcomes. The third objective was to evaluate interreader agreement on qualitative PDAC border characterization, “subjective delta score,” using the different dual-energy CT image types.
Materials and Methods
Study Design
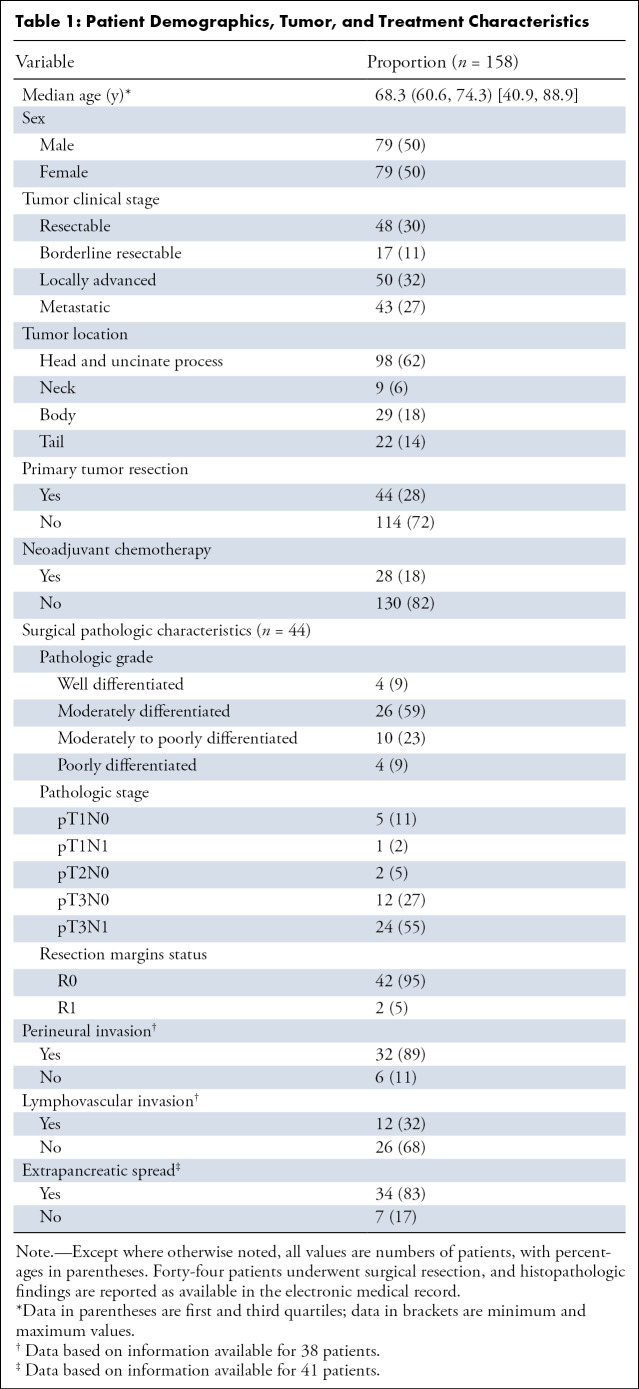
This retrospective, single-center, institutional review board–approved, Health Insurance Portability and Accountability Act–compliant study was performed with a waiver for informed consent. We identified 174 consecutive patients with treatment-naive histopathologically proven PDAC who had undergone multiphasic pancreatic protocol dual-energy CT at baseline from December 2011 through March 2017. We excluded patients with clearly mistimed contrast material administration (n = 5), CT signs of acute pancreatitis (n = 2), image artifacts affecting region of interest (ROI) measurements (n = 4), and patients with PDAC tumors arising within intraductal papillary mucinous neoplasms (n = 5), resulting in a total of 158 patients. Ninety-three patients had advanced stage PDAC at presentation; 50 had locally advanced tumors and 43 had metastatic disease. Sixty-five patients had early stage PDAC at presentation; 48 had resectable tumors and 17 had borderline resectable tumors. Of the 44 patients who underwent surgery, 28 patients received neoadjuvant therapy. Patient demographics, treatment, and tumor characteristics recorded from retrospective chart review are summarized in Table 1.
Table 1:
Patient Demographics, Tumor, and Treatment Characteristics
Tumor Staging and Assessment of Distant Metastasis–free Survival and OS
National Comprehensive Cancer Network 2017 guidelines (8) were used for tumor staging for this study, with rereview of each individual patient’s scan for staging by consensus of two authors (A.M.A., D.E.M.), as the period of the retrospective radiology information system search used to generate the population spanned years prior to 2017. In patients with localized (nonmetastatic) PDAC, distant metastasis–free survival (DMFS) was defined as the time between histopathologic diagnosis of PDAC and development of distant metastasis. Patients who died without documented distant metastasis were censored. OS was defined as time from initial histopathologic diagnosis to the date of death or last contact. Patients who were alive at last contact were considered censored events.
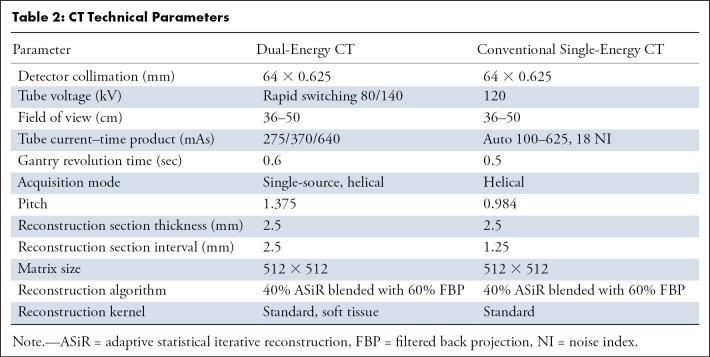
CT Image Acquisition
Multiphasic pancreatic protocol dual-energy CT is routinely performed for patients suspected of having pancreatic lesions at our institution (Table 2). The test consists of a dual-energy CT PPP acquisition 35 seconds after initiation of weight-based intravenous contrast material (42 g iodine per kilogram of body weight, iohexol [Omnipaque 350 mg/mL; GE Healthcare, Waukesha, Wis] injection at a rate of at least 3 mL/sec) and a conventional (defined as standard polychromatic beam of 120 kVp) PVP acquisition 65 seconds after initiation. At the time of this retrospective study, our main outpatient imaging site was equipped with the first-generation rapid tube voltage–switching dual-energy CT technology (HD750; GE Healthcare). This type of scanner uses a rapidly switching single tube to acquire near-simultaneous 140- and 80-kVp datasets. The raw image data are used to generate simulated monoenergetic images and material density (MD) images. Simulated 70-keV, 52-keV, and iodine MD axial images generated from residual-energy CT raw data at 2.5 mm using 40% adaptive statistical iterative reconstruction are used for routine clinical interpretation. The simulated 70-keV dual-energy CT images are clinically comparable to conventional 120-kVp CT images and are used for routine diagnosis; thus, the 70-keV dual-energy CT PPP images and the conventional PVP images are equivalent in clinical practice to a conventional CT pancreatic protocol, and these images were used for the purposes of our validation aim. The lower-energy 52-keV and iodine MD dual-energy CT images were used to investigate the dual-energy CT-specific study objectives.
Table 2:
CT Technical Parameters
Quantitative Dual-Energy CT Image Analysis and Delta Classification
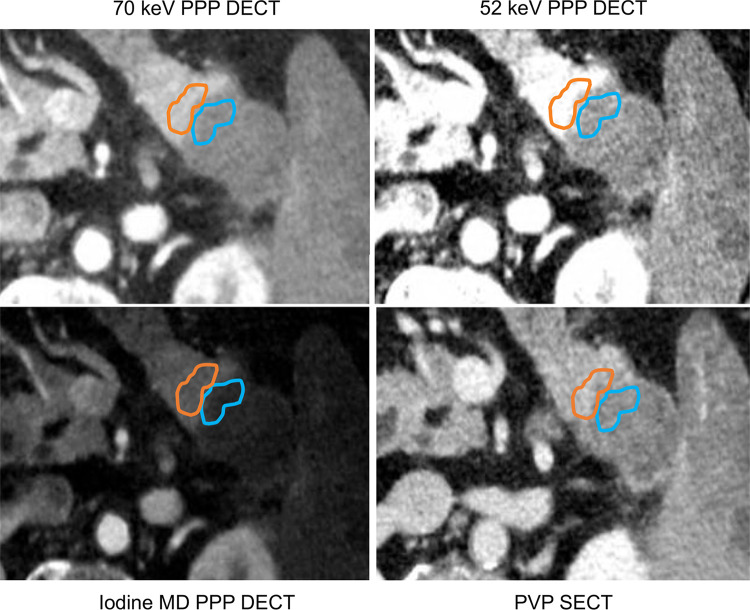
All baseline PPP and PVP 2.5-mm axial images were loaded onto a dedicated dual-energy CT workstation (Advantage Workstation; GE Healthcare). After performing rigid image registration, a single operator manually placed freeform volumetric ROIs on the tumor core, peripheral tumor, pancreas immediately adjacent to the tumor border, and upstream or downstream “normal” pancreatic parenchyma, while avoiding pancreatic ducts, vessels, stents, and streak artifacts produced by stents. The ROIs were simultaneously and automatically populated to identical image locations on the 70-keV, 52-keV, iodine MD, and PVP images. The ROIs were drawn using visual borders, and the image that best demarcated the tumor borders or margins was used to draw the ROIs. The tumor core was defined as the center of the tumor, not within 5 mm of the margin. The part of the tumor directly adjacent to the margin was called the tumor periphery and was approximately 5 mm thick (see Fig 1).
Figure 1:
Axial dual-energy CT scan in a 63-year-old man with histopathologically proven pancreatic ductal adenocarcinoma in the tail of pancreas. Regions of interest were drawn on the normal pancreas adjacent to tumor border (orange) and the tumor periphery (blue) on the 70-keV PPP image (top left) and were simultaneously populated to identical locations on other image types. DECT = dual-energy CT, MD = material density, PPP = pancreatic parenchymal phase, PVP = portal venous phase, SECT = single-energy CT.
Eleven tumors were visually isoattenuating on 70-keV images, but in many instances the tumor margins were detectable on 52-keV or iodine MD images, which were used to draw the ROIs. When a lesion was isoattenuating on all dual-energy CT and single-energy CT image sets (two patients), the location of duct cutoff was used to estimate the margins; a 5-mm “tumor periphery” ROI was drawn immediately at the duct cutoff, with the core ROI drawn downstream after a gap of 5 mm. When there was very little measurable “normal parenchyma” upstream to the tumor because of duct dilatation and glandular atrophy, the ROI was tailored to fit the largest area of visible parenchyma.
We calculated the gradient of enhancement across tumor–normal pancreas interface on all image types as follows: delta = (attenuation of normal pancreas adjacent to tumor border – peripheral tumor attenuation) (Fig 1). Patients with a high delta on either the dual-energy CT PPP image or conventional PVP image were considered high delta, as originally described by Koay et al (3). We also explored associations of clinical outcomes with delta measured on each dual-energy CT image type without the PVP counterparts. For the purpose of validation of delta as a predictive and prognostic candidate biomarker, we used a cutoff point of 40 HU as previously determined using conventional single-energy CT by Koay et al. Patients who had a delta value greater than or equal to 40 HU on either 70-keV PPP or conventional PVP images were considered as high delta, and those with a delta value measuring less than 40 HU on both PPP and conventional PVP were classified as low delta (3).
Qualitative PDAC Tumor Interface Conspicuity Analysis
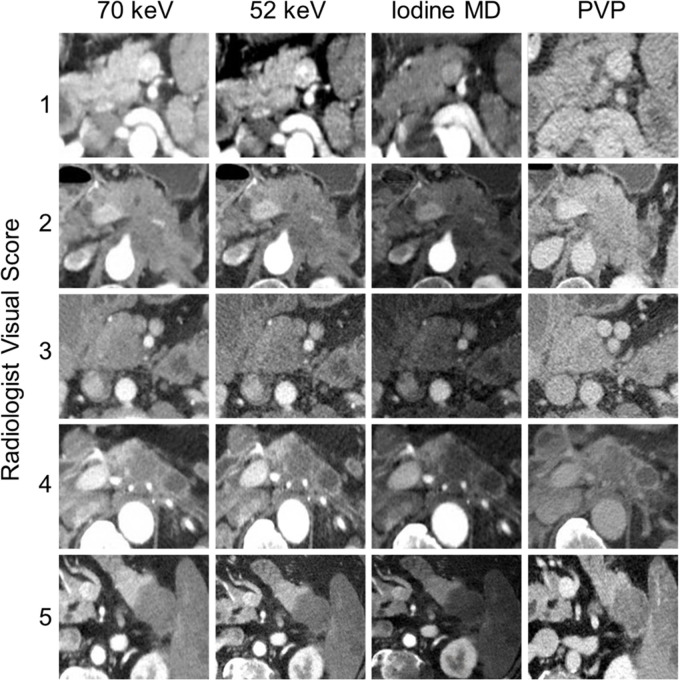
Subjective, qualitative visual tumor interface conspicuity was assessed independently by three radiologists (D.E.M., M.M.M., and C.M.B.) with 25, 14, and 4 years of experience, respectively, in abdominal imaging, using a clinical picture archiving and communication system (Philips iSite Intellispace; Philips Medical Systems, Best, the Netherlands). All readers reviewed the images using the same window and width values without alterations but were allowed to page through the images to compare the tumor margins. The readers were blinded to the clinical outcomes and objective delta determination. Each reader interpreted all dual-energy CT images of an individual image type (for example all 70-keV images in all patients) in a single session, with a minimum of 1-week interval between sessions to minimize recall bias. Each reader ranked the conspicuity of the PDAC tumor interface (“subjective delta”) on a 1-to-5 scale (Fig 2). Grade 1 was assigned to tumors that were homogeneously and completely isoattenuating to the surrounding normal parenchyma. Grade 2 was assigned to poorly defined tumors with margins that were difficult to perceive. Grade 3 was assigned to tumors with visually appreciated borders with interdigitating surrounding pancreatic tissue at the tumor interface. Grade 4 was assigned to tumors with well-defined borders that were better defined but not the highest conspicuity. Grade 5 was assigned to optimally visualized tumors with strikingly well-defined interface. Prior to the initial session, each reader was individually coached on a set of images demonstrating the grades of delta described above; the coach was an investigator who did not perform the subjective delta analysis. The qualitative determination of border conspicuity was compared with OS. In cases where discrepancies between readers’ qualitative delta ratings occurred, for this comparison alone, the score was resolved by consensus. Tumors scored as 4 or 5 were considered high delta, while tumors scored 1, 2, and 3 were considered low delta.
Figure 2:
Qualitative assessment of border conspicuity. The figure demonstrates examples of tumors visually scaled from 1 to 5 on 70-keV, 52-keV, and iodine material density (MD) dual-energy CT images and conventional portal venous phase (PVP) images. Tumors scored as 4 or 5 were considered high delta, while tumors scored 1, 2, and 3 were considered low delta.
Statistical Analysis
Descriptive analysis was presented for all variables, including the mean, standard deviation, or median, with first and third quartiles and ranges for continuous variables and frequency count and percentage for categorical variables. Discrete and categorical variables were compared using χ2 or Fisher exact test; differences between continuous variables were assessed using Mann-Whitney U test. Interreader agreement was determined using Cohen κ statistic. The nearest-neighbor estimation of the bivariate distribution for time-dependent receiver operating characteristic curves was used to find the cut point of interested imaging biomarkers that associated with patients’ cumulative incidence (yes or no = death or no death, distant metastasis or no distant metastasis) based on the highest Youden index (9). Survival curves were generated using the Kaplan-Meier method, and comparison between two independent groups (high and low delta) was evaluated with the log-rank test. Hazard ratio (HR) was estimated with Cox regression model for univariate and multivariable survival analysis. We considered a P value less than .05 to be significant. All statistical analyses were performed using JMP 14 (SAS Institute, Cary, NC).
Conflicts of Interest
There was no funding for this study. Our institution receives research support in the form of equipment from GE Healthcare, who manufactures the CT scanner utilized in this study. One author (D.E.M.) has served in the past as a consultant for GE Healthcare for educational materials about pancreatic dual-energy CT and to assess an unrelated segmentation software. Those authors who are not employees of or consultants for GE Healthcare had control of inclusion of any data and information that might present a conflict of interest for those authors who have served as consultants.
Results
Evaluation of Delta Measured on Dual-Energy CT PPP Combined with Conventional PVP Images as a Prognostic Biomarker in Patients with PDAC
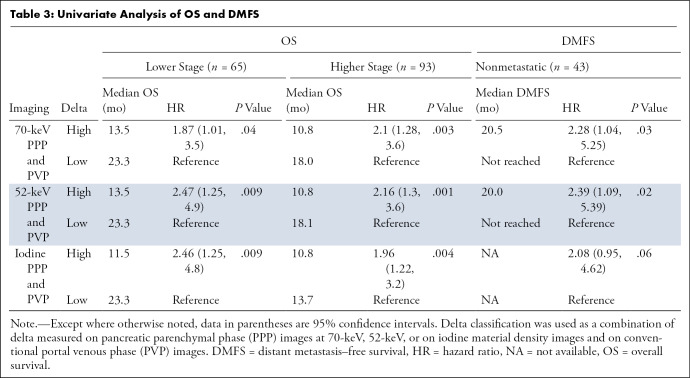
PDAC delta values were determined by calculating the difference in attenuation between normal pancreas adjacent to the tumor border and the peripheral tumor on CT images. Patients with high delta tumors (≥ 40 HU) on either 70-keV PPP images or conventional PVP images had significantly shorter OS compared with those with low delta tumors (< 40 HU) in both early stage PDAC (13.5 months vs 23.3 months; HR, 1.87; 95% confidence interval [CI]: 1.01, 3.5; P = .04) and advanced stage PDAC (10.8 months vs 18.0 months; HR, 2.1; 95% CI: 1.28, 3.6; P = .003) (Table 3, Fig 3). In patients who presented without metastases, high delta tumors had significantly shorter median time to distant metastasis than patients with low delta lesions (20.5 months vs median time to distant metastasis not reached; HR, 2.28; 95% CI: 1.04, 5.25; P = .03). Patients with high delta had significantly lower DMFS at 2 and 5 years (60% and 100%, respectively) than did patients with low delta (30% and 30%, respectively, P = .03) (Table 3, Fig 3).
Table 3:
Univariate Analysis of OS and DMFS
Figure 3a:
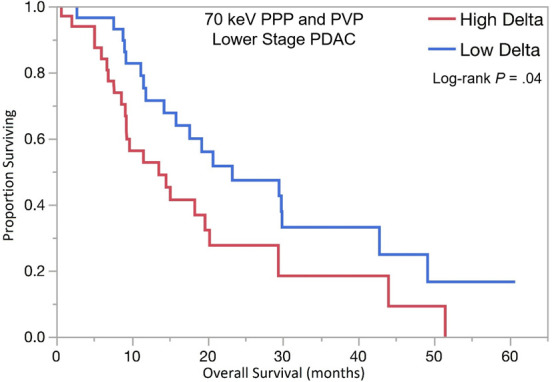
Kaplan-Meier curves for overall survival stratified by quantitative delta measured on dual-energy CT 70-keV pancreatic parenchymal phase (PPP) and conventional portal venous phase (PVP) images in patients with (a) lower stage and (b) higher stage pancreatic ductal adenocarcinoma (PDAC). (c) Kaplan-Meier curve of distant metastasis–free survival stratified by delta measured on 70-keV PPP and PVP.
Figure 3b:
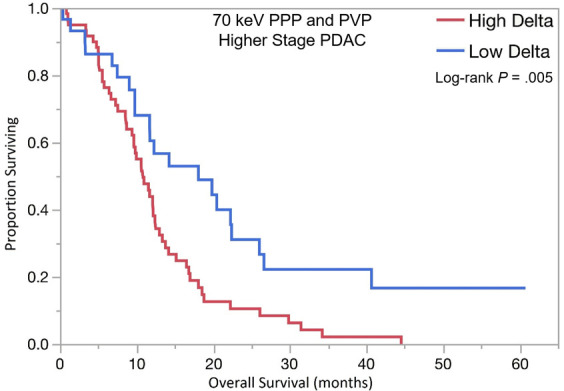
Kaplan-Meier curves for overall survival stratified by quantitative delta measured on dual-energy CT 70-keV pancreatic parenchymal phase (PPP) and conventional portal venous phase (PVP) images in patients with (a) lower stage and (b) higher stage pancreatic ductal adenocarcinoma (PDAC). (c) Kaplan-Meier curve of distant metastasis–free survival stratified by delta measured on 70-keV PPP and PVP.
Figure 3c:
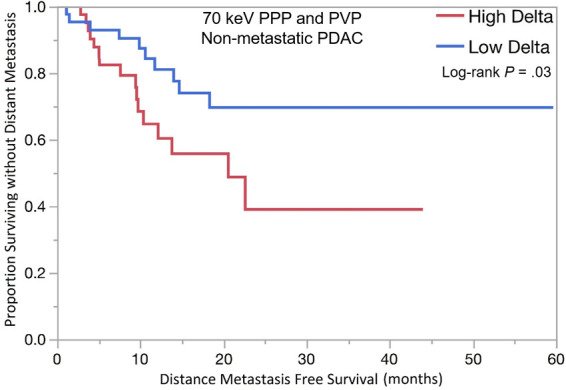
Kaplan-Meier curves for overall survival stratified by quantitative delta measured on dual-energy CT 70-keV pancreatic parenchymal phase (PPP) and conventional portal venous phase (PVP) images in patients with (a) lower stage and (b) higher stage pancreatic ductal adenocarcinoma (PDAC). (c) Kaplan-Meier curve of distant metastasis–free survival stratified by delta measured on 70-keV PPP and PVP.
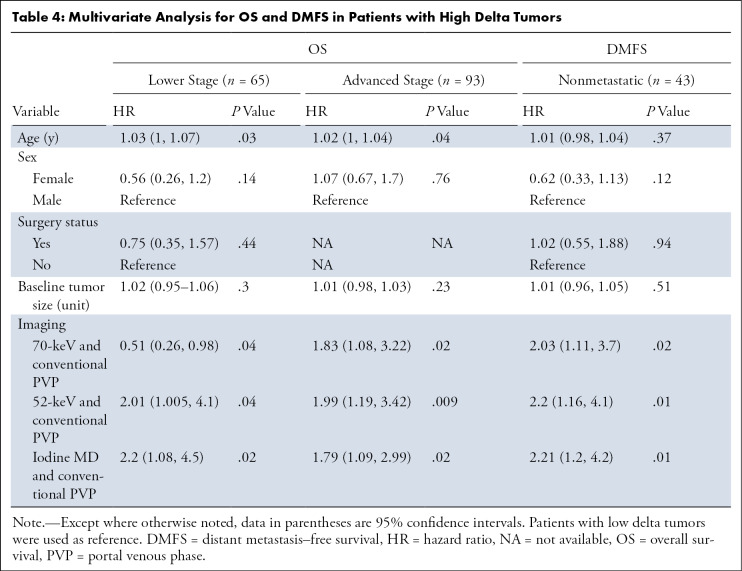
The optimal tumor interface (delta) cut point for determining survival outcomes on 52-keV PPP images was 92 HU and on iodine MD PPP images was 18 mg/mL. Similar to the above results, patients with high delta tumors on either 52-keV PPP images (≥ 92 HU; Fig 4) or conventional PVP images with cut point of less than or equal to 40 HU or on either iodine MD PPP images (≥ 18 mg/mL; Fig 5) or conventional PVP images (with cut point of ≥ 40 HU) had significantly shorter median OS in both early and late stage PDAC and had significantly shorter time to distant metastatic disease (Table 3). For all combinations of imaging reconstructions, similar findings were observed on multivariate Cox regression analysis after adjusting for age, sex, surgery status, and baseline tumor size (Table 4).
Figure 4a:
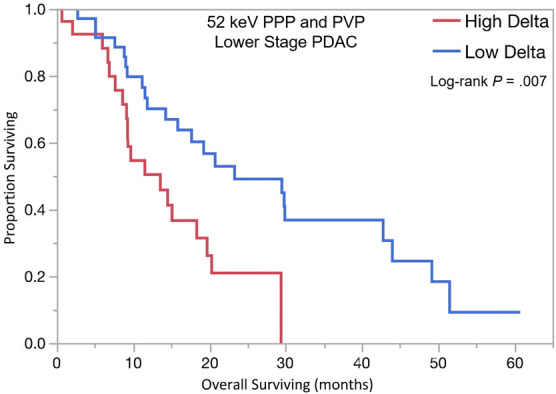
Kaplan-Meier curves for overall survival stratified by delta measured on dual-energy CT 52-keV pancreatic parenchymal phase (PPP) and conventional portal venous phase (PVP) images in patients with (a) lower stage and (b) higher stage pancreatic ductal adenocarcinoma (PDAC). (c) Kaplan-Meier curve of distant metastasis–free survival stratified by delta measured on 52-keV PPP and PVP.
Figure 5a:
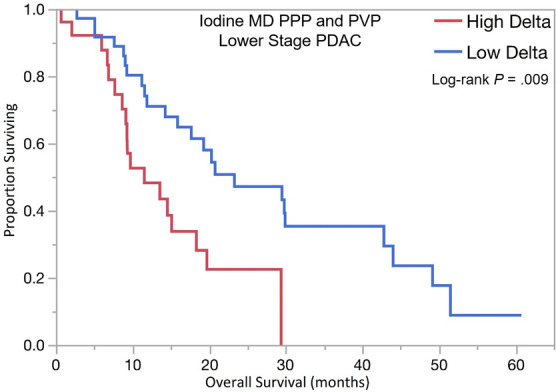
Kaplan-Meier curves for overall survival stratified by delta measured on dual-energy CT iodine material density (MD), pancreatic parenchymal phase (PPP), and conventional portal venous phase (PVP) images in patients with (a) lower stage pancreatic ductal adenocarcinoma (PDAC) and (b) higher stage PDAC. (c) Kaplan-Meier curve of distant metastasis–free survival stratified by delta measured on iodine MD PPP and PVP images.
Table 4:
Multivariate Analysis for OS and DMFS in Patients with High Delta Tumors
Figure 4b:
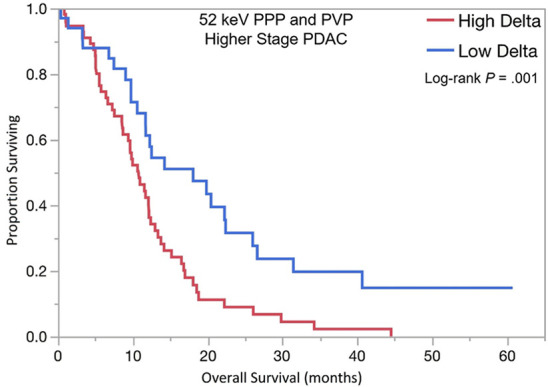
Kaplan-Meier curves for overall survival stratified by delta measured on dual-energy CT 52-keV pancreatic parenchymal phase (PPP) and conventional portal venous phase (PVP) images in patients with (a) lower stage and (b) higher stage pancreatic ductal adenocarcinoma (PDAC). (c) Kaplan-Meier curve of distant metastasis–free survival stratified by delta measured on 52-keV PPP and PVP.
Figure 4c:
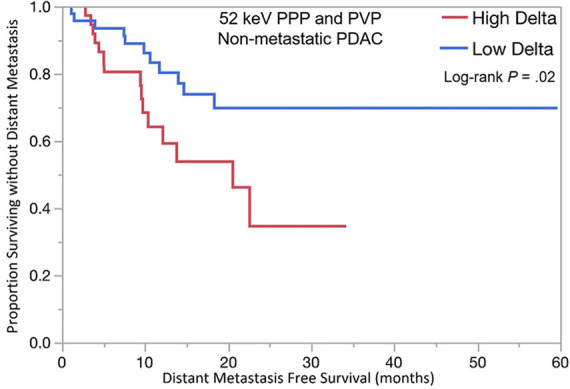
Kaplan-Meier curves for overall survival stratified by delta measured on dual-energy CT 52-keV pancreatic parenchymal phase (PPP) and conventional portal venous phase (PVP) images in patients with (a) lower stage and (b) higher stage pancreatic ductal adenocarcinoma (PDAC). (c) Kaplan-Meier curve of distant metastasis–free survival stratified by delta measured on 52-keV PPP and PVP.
Figure 5b:
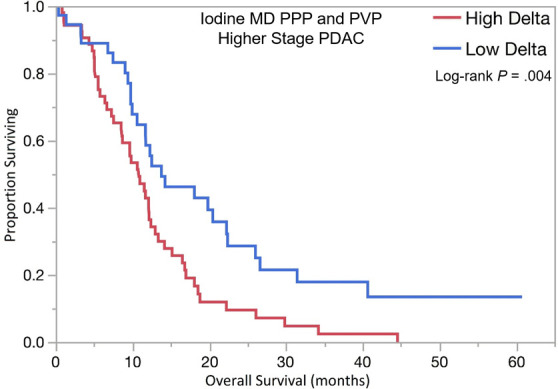
Kaplan-Meier curves for overall survival stratified by delta measured on dual-energy CT iodine material density (MD), pancreatic parenchymal phase (PPP), and conventional portal venous phase (PVP) images in patients with (a) lower stage pancreatic ductal adenocarcinoma (PDAC) and (b) higher stage PDAC. (c) Kaplan-Meier curve of distant metastasis–free survival stratified by delta measured on iodine MD PPP and PVP images.
Figure 5c:
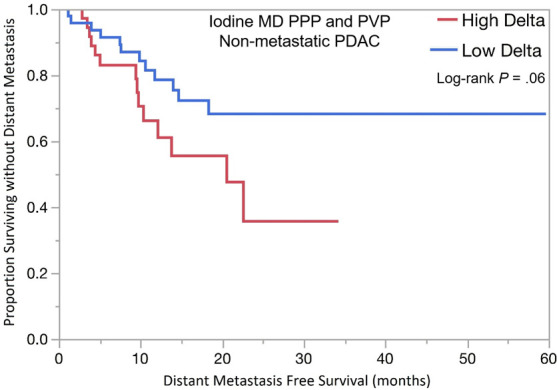
Kaplan-Meier curves for overall survival stratified by delta measured on dual-energy CT iodine material density (MD), pancreatic parenchymal phase (PPP), and conventional portal venous phase (PVP) images in patients with (a) lower stage pancreatic ductal adenocarcinoma (PDAC) and (b) higher stage PDAC. (c) Kaplan-Meier curve of distant metastasis–free survival stratified by delta measured on iodine MD PPP and PVP images.
Evaluation of Delta Measured on Individual Dual-Energy CT Reconstructed PPP Images
The associations between survival outcomes and delta classification using individual imaging series rather than a combination of PPP and conventional PVP are provided in Tables E1 and E2 (supplement). Generally, weaker associations with clinical outcomes were found. While delta measured on 70-keV PPP or 52-keV PPP images alone was associated with OS in patients with advanced stage PDAC, delta on iodine MD PPP alone or conventional PVP alone did not show a statistically significant association with outcomes.
Association of Delta Measurement with Lymphovascular Invasion
In 38 patients with available surgical histopathologic findings on the resected primary PDAC, 26 patients (68%) had no lymphovascular invasion and 12 patients (32%) had documented lymphovascular invasion. Patients with no lymphovascular invasion were more likely to harbor low delta tumors (23 of 26, 88%) on both 52-keV PPP (P = .04) and iodine MD PPP images (P = .04) compared with patients with lymphovascular invasion. No statistically significant association was found using 70-keV PPP (P = .65) or conventional PVP images (P = .86) for delta in patients with versus those without lymphovascular invasion.
Prevalence of High Delta Tumors in Patients with Metastatic PDAC
A total of 43 patients had metastatic PDAC at presentation. Thirty-four of 43 (79%) patients had high delta tumors on 70-keV PPP when combined with conventional PVP images (P = .003); 31 of 43 (72%) and 29 of 43 (67%) had high delta tumors on 52-keV PPP (P = .003) and iodine MD PPP images (P = .009), respectively, when combined with conventional PVP images.
Correlation of Radiologists’ Visual Tumor Interface Scoring System with OS and DMFS
Patients with conspicuous tumors (high “visual” delta scores of 4 or 5) on iodine MD PPP combined with conventional PVP images were associated with shorter OS in both advanced stage PDAC (HR, 2.4; 95% CI: 1.5, 3.88; P = .0003) and lower stage PDAC (HR, 2.79; 95% CI: 1.38, 5.6; P = .003). Similarly, using 52-keV PPP and conventional PVP images, patients with high delta tumors demonstrated lower OS in both the advanced stage group (HR, 1.83; 95% CI: 1.14, 2.93; P = .01) and lower stage group (HR, 2.75; 95% CI: 1.4, 5.41; P = .003). Finally, using 70-keV PPP and conventional PVP images, patients with high delta tumors had significantly lower OS in the advanced PDAC group (HR, 2.1; 95% CI: 1.29, 3.42; P = .002), and lower stage PDAC (HR, 3.11; 95% CI: 1.47, 6.57; P = .003). There was no statistically significant association with subjective delta scores and DMFS.
Assessment of Interobserver Agreement
For evaluation of qualitative tumor interface conspicuity or the “visual” delta score, agreement between the three readers was highest using dual-energy CT PPP iodine MD images (κ of 0.70, 0.63, and 0.73 for reader 1 vs 2, 1 vs 3, 2 vs 3, respectively) compared with 52-keV PPP images (κ of 0.52, 0.60, and 0.45, same order reader comparisons), 70-keV PPP images (κ of 0.42, 0.43, and 0.53, same order reader comparisons), and conventional PVP images (κ of 0.50, 0.53, and 0.59, same order reader comparisons) images.
Discussion
The oncology community continues to lack a biologically and clinically relevant biomarker that can stratify patients with newly diagnosed PDAC into distinct prognostic groups (10). This study has identified dual-energy CT–based candidate imaging biomarkers that are associated with tumor histopathologic features of biologic activity and clinical outcomes in patients with treatment-naive PDAC. These candidate biomarkers are based on tumor border conspicuity, or differential tumor interface enhancement patterns, as measured quantitatively on the different dual-energy CT image types, with cut points determined by receiver operating characteristic analysis. This stratification has consistently shown that conspicuous high delta PDAC is a more aggressive disease, with shorter OS and faster development of metastases than less conspicuous low delta tumors. These noninvasive tumor imaging candidate biomarkers can be determined at the time of diagnosis, before treatment. Importantly, these dual-energy CT candidate biomarkers demonstrated consistent results in patients with different stage PDAC tumors, including metastatic PDAC, at presentation.
The physics of mass transport within body compartments and across biologic barriers differentiate cancer from healthy tissue. This differential mass transport is the basic principle that allows radiologists to differentiate between normal and abnormal tissues in the pancreas, based on iodinated contrast medium distribution. The prognostication of the candidate imaging biomarkers in this study may be explained by pathologic observations in PDAC lesions that limit effective drug delivery, factors that can also affect distribution of iodinated contrast media. Neoplastic leaky vasculature can create high interstitial fluid pressure, preventing the movement of chemotherapy from the vasculature to the extracellular compartment (11,12). Koay et al explored other pathologic, genetic, and cellular bases of pancreas-tumor interface by imaging PDAC subtypes and found that high delta tumors were more likely to carry several poor prognosis mutations in conjunction with KRAS such as SMAD4, p53, and PIK3CA. Additionally, high delta tumors showed lower numbers of stromal cell infiltrates and higher numbers of immunosuppressive T-regulatory cells than low delta tumors (3). This work by Koay’s group utilized single-energy pancreatic protocol CT. In our study we have applied Koay’s work to pancreatic protocol dual-energy CT. Our group has previously shown that viewing lower-energy dual-energy CT images improves PDAC lesion conspicuity, with tumor-to-nontumoral HU quantitative differences that are double those seen on the 70-keV images that are used for routine clinical interpretation (5). This phenomenon explains the nearly double HU cutoff point for the 52-keV compared with the 70-keV cutoff value and is related to the increased contribution of iodine to image contrast at lower-energy dual-energy CT reconstructed images. Extravasation of iodinated contrast agent into the tumoral interstitial space reflects the status of tumor mass transport properties and tissue microcirculation (2,13,14). The less conspicuous margins in patients with lower delta tumors are likely the result of better iodine transport to the tumor periphery and core, and the improved overall outcome in these patients might similarly be due to increased transport of chemotherapeutic agents to the tumor’s actively proliferating edge.
Previous investigations using dual-energy CT to detect small PDAC found that 52-keV images and iodine MD images were subjectively rated better than 70-keV images for lesion conspicuity and reader confidence that a lesion was present (6). Gupta et al showed that independent readers scored lesion conspicuity and edge sharpness higher on iodine maps compared with polychromatic 140-kVp images (4). Our results confirmed that a qualitative or subjective delta characterization is achievable and yielded similar associations with outcomes, as did the quantitative delta measurements. Optimal interreader agreement was achieved using iodine MD and lower-keV dual-energy CT images.
We found that the associations between survival outcomes and delta classification on individual PPP dual-energy images that is not combined with delta on conventional PVP had weaker associations with clinical outcomes. This phenomenon might be explained by variation in achievement of an optimal PPP timing, resulting in a lower gradient of enhancement across the pancreas tumor–normal pancreas interface in this retrospective study. The technical problem related to contrast timing can be overcome when combining the delta score measured on conventional PVP with delta score measured on each dual-energy CT image type. This was also the method of Koay et al in their study (3). In our study, this combination of findings on PPP and PVP yielded more robust associations with OS and DMFS across the different PDAC stages and indicates that tumor delta should be evaluated using both.
We acknowledge that this study had limitations, one being that it represents a heterogeneous retrospective clinical data set. Some heterogeneity in contrast timing that was due to individual patient factors, such as diminished cardiac output, affected our ability to accurately observe delta, both quantitatively and qualitatively, on PPP images in some cases. It will be important for future investigators to verify the utility of PPP dual-energy CT reconstruction individual delta values in a prospective study with strict acquisition quality control to fully explore the potential of this technique. In addition, the population is relatively small, from a single center, and the dual-energy CT scan delta analysis is based on one type of dual-energy CT scanner. Given the differences in scan acquisition and postprocessing software among dual-energy CT manufacturers, it will be important for others to verify these findings with other types of scanners.
In summary, dual-energy CT–based imaging biomarkers can be developed to stratify patients with PDAC into distinct prognostic groups at baseline. The candidate delta biomarker in PDAC is most predictive when PPP dual-energy CT metrics are combined with conventional PVP CT measures. Our findings indicate that patients with well-defined tumor borders have more aggressive disease and poorer clinical outcomes. Evaluation of border conspicuity can be achieved with quantitative methods, and also qualitatively, using subjective visual scoring, with highest interreader agreement using the dual-energy CT iodine MD and 52-keV images. These findings can potentially be used for rational patient stratification in ongoing and future clinical trials. Ultimately, this imaging candidate biomarker can help to provide a more personalized approach to patients with pancreatic cancer.
SUPPLEMENTAL TABLES
Authors declared no funding for this work.
Disclosures of Conflicts of Interest: A.M.A. disclosed no relevant relationships. Y.L. disclosed no relevant relationships. D.S. disclosed no relevant relationships. C.M.B. disclosed no relevant relationships. M.M.M. disclosed no relevant relationships. A.D.S. Activities related to the present article: disclosed grant money paid to institution by General Electric; disclosed money paid to author by AI Metrics, Liver Nodularity, Color Enhanced Detection, and Radiostics, all as CEO. Activities not related to the present article: received royalties from AI Metrics; has multiple patents issued and pending on behalf of AI Metrics, Liver Nodularity, and Color Enhanced Detection. Other relationships: has multiple licenses and patents issued and pending for AI Metrics, Liver Nodularity, and Color Enhanced Detection; received royalties from AI Metrics; is a licensee of AI Metrics. D.E.M. Activities related to the present article: disclosed no relevant relationships. Activities not related to the present article: disclosed money paid to the author by GE Healthcare for unrelated research on liver segmentation; disclosed money paid to institution for research equipment (AW workstation). Other relationships: disclosed no relevant relationships.
Abbreviations:
- CI
- confidence interval
- DMFS
- distant metastasis–free survival
- HR
- hazard ratio
- MD
- material density
- OS
- overall survival
- PDAC
- pancreatic ductal adenocarcinoma
- PPP
- pancreatic parenchymal phase
- PVP
- portal venous phase
- ROI
- region of interest
References
- 1.Koay EJ, Baio FE, Ondari A, et al. Intra-tumoral heterogeneity of gemcitabine delivery and mass transport in human pancreatic cancer. Phys Biol 2014;11(6):065002. [DOI] [PMC free article] [PubMed] [Google Scholar]
- 2.Koay EJ, Truty MJ, Cristini V, et al. Transport properties of pancreatic cancer describe gemcitabine delivery and response. J Clin Invest 2014;124(4):1525–1536. [DOI] [PMC free article] [PubMed] [Google Scholar]
- 3.Koay EJ, Lee Y, Cristini V, et al. A visually apparent and quantifiable CT imaging feature identifies biophysical subtypes of pancreatic ductal adenocarcinoma. Clin Cancer Res 2018;24(23):5883–5894. [DOI] [PMC free article] [PubMed] [Google Scholar]
- 4.Gupta S, Wagner-Bartak N, Jensen CT, et al. Dual-energy CT of pancreatic adenocarcinoma: reproducibility of primary tumor measurements and assessment of tumor conspicuity and margin sharpness. Abdom Radiol (NY) 2016;41(7):1317–1324. [DOI] [PubMed] [Google Scholar]
- 5.Patel BN, Thomas JV, Lockhart ME, Berland LL, Morgan DE. Single-source dual-energy spectral multidetector CT of pancreatic adenocarcinoma: optimization of energy level viewing significantly increases lesion contrast. Clin Radiol 2013;68(2):148–154. [DOI] [PubMed] [Google Scholar]
- 6.McNamara MM, Little MD, Alexander LF, Carroll LV, Beasley TM, Morgan DE. Multireader evaluation of lesion conspicuity in small pancreatic adenocarcinomas: complimentary value of iodine material density and low keV simulated monoenergetic images using multiphasic rapid kVp-switching dual energy CT. Abdom Imaging 2015;40(5):1230–1240. [DOI] [PubMed] [Google Scholar]
- 7.Shuman WP, Green DE, Busey JM, et al. Dual-energy liver CT: effect of monochromatic imaging on lesion detection, conspicuity, and contrast-to-noise ratio of hypervascular lesions on late arterial phase. AJR Am J Roentgenol 2014;203(3):601–606. [DOI] [PubMed] [Google Scholar]
- 8.Tempero MA, Malafa MP, Al-Hawary M, et al. Pancreatic Adenocarcinoma, Version 2.2017, NCCN Clinical Practice Guidelines in Oncology. J Natl Compr Canc Netw 2017;15(8):1028–1061. [DOI] [PubMed] [Google Scholar]
- 9.Heagerty PJ, Lumley T, Pepe MS. Time-dependent ROC curves for censored survival data and a diagnostic marker. Biometrics 2000;56(2):337–344. [DOI] [PubMed] [Google Scholar]
- 10.Koay EJ, Amer AM, Baio FE, Ondari AO, Fleming JB. Toward stratification of patients with pancreatic cancer: Past lessons from traditional approaches and future applications with physical biomarkers. Cancer Lett 2016;381(1):237–243. [DOI] [PubMed] [Google Scholar]
- 11.Azzi S, Hebda JK, Gavard J. Vascular permeability and drug delivery in cancers. Front Oncol 2013;3:211. [DOI] [PMC free article] [PubMed] [Google Scholar]
- 12.Koay EJ, Ferrari M. Transport Oncophysics in silico, in vitro, and in vivo. Preface. Phys Biol 2014;11(6):060201. [DOI] [PubMed] [Google Scholar]
- 13.Brix G, Griebel J, Kiessling F, Wenz F. Tracer kinetic modelling of tumour angiogenesis based on dynamic contrast-enhanced CT and MRI measurements. Eur J Nucl Med Mol Imaging 2010;37(Suppl 1):S30–S51. [DOI] [PubMed] [Google Scholar]
- 14.Kawamoto S, Fuld MK, Laheru D, Huang P, Fishman EK. Assessment of iodine uptake by pancreatic cancer following chemotherapy using dual-energy CT. Abdom Radiol (NY) 2018;43(2):445–456. [DOI] [PMC free article] [PubMed] [Google Scholar]
Associated Data
This section collects any data citations, data availability statements, or supplementary materials included in this article.


