Abstract
Purpose
To evaluate the impact of intratumoral metabolic heterogeneity (IMH) and other quantitative fluorine 18 (18F) fluorodeoxyglucose (FDG) PET/CT parameters for predicting progression-free survival (PFS) and overall survival (OS) in patients with esophageal cancer.
Materials and Methods
In this retrospective study, an automated gradient-based segmentation method was used to assess the maximum standardized uptake value, mean standardized uptake value, metabolic tumor volume (MTV), and IMH index of the primary tumor in patients with biopsy-proven adenocarcinoma or squamous cell carcinoma of the esophagus with an initial staging 18F-FDG PET/CT. Data were collected between July 2006 and February 2016. OS and PFS were calculated using multivariable Cox proportional hazards regression with the adjustment (as covariates) of age, sex, weight, stage, tumor type, tumor grade, and treatment. All PET parameters were standardized before analysis. Log-rank tests were performed, and corresponding Kaplan-Meier survival plots were generated.
Results
A total of 71 patients (mean age, 64 years ± 10 [standard deviation], 62:9 men:women) were included. Median follow-up time was 28.2 months (range, 4–38 months), and median survival was 16.1 months (range, 0.1–60.3 months). Higher MTV was associated with reduced PFS for every standard deviation increase (hazard ratio [HR], 0.193; 95% CI: 0.052, 0.711; P = .01). Higher IMH was associated with reduced PFS for every standard deviation decrease in the area under the curve (HR, 10.78; 95% CI: 1.31, 88.96; P = .03).
Conclusion
PFS for patients with esophageal cancer was associated with MTV and with IMH.
Keywords: Esophagus, Neoplasms-Primary, PET/CT, Tumor Response
© RSNA, 2020
Summary
In patients with esophageal cancer, intratumoral metabolic heterogeneity and metabolic tumor volume of the primary tumor derived from pretreatment fluorine 18 fluorodeoxyglucose PET/CT were the only quantitative parameters that were predictive of progression-free survival.
Key Points
■ There was an association of metabolic tumor volume (hazard ratio [HR], 0.193; P = .01) and intratumoral metabolic heterogeneity (HR, 10.78; P = .03) with progression-free survival for patients with esophageal cancer.
■ 18F fluorodeoxyglucose PET/CT quantitative parameters on initial staging scan can provide prognostic information, potentially leading to a more personalized approach for a patient’s treatment.
Introduction
Esophageal cancer is the sixth most common cause of cancer-related death worldwide and continues to be a major health challenge (1). It is estimated that 13 200 people in the United States are diagnosed annually with esophageal cancer, and approximately 12 500 people die of the disease (2). Histologically, esophageal cancer is classified as either squamous cell carcinoma (ESCC) or adenocarcinoma (EAC) (3). ESCC and EAC have different predisposing factors, as smoking and alcohol use are risk factors for ESCC and Barrett esophagus, obesity, and smoking are major risk factors for EAC (4). In the past, ESCC used to account for the majority of the esophageal cancer worldwide; however, the incidence of EAC has increased by 350% over the past 25 years (1), faster than any other malignancy in the Western world. EAC currently accounts for more than 60% of all esophageal cancers in the United States, related to the recent changes in lifestyle of this population (5,6).
Both types of esophageal cancer carry a poor prognosis both in the locally advanced and metastatic setting (7) with most patients requiring extensive treatment, including chemotherapy, chemoradiotherapy, and/or surgical resection (1). Tumor stage (based on the American Joint Committee on Cancer) and lymph node involvement generally correlate with outcome (8); however, staging based on clinical and pathologic assessment only is often inaccurate (9). Therefore, imaging modalities such as fluorine 18 (18F) fluorodeoxyglucose (FDG) PET with simultaneous acquisition of CT are currently encouraged, depending on availability, with findings incorporated into the treatment plans (2,10,11). 18F-FDG PET/CT has been proven to be the most sensitive and specific imaging modality for detection of distant metastasis and the most specific test for detection of lymph node involvement of local-regional disease (12).
Multiple studies demonstrated the use of 18F-FDG PET/CT parameters as imaging markers to predict outcomes in patients with esophageal cancer (8,13–18). The most common PET/CT parameters assessed in esophageal tumors are maximum standardized uptake value (SUVmax), metabolic tumor volume (MTV), and total lesion glycolysis (TLG). SUVmax has traditionally been acknowledged as the best imaging marker to predict response (13,14). Several studies have found positive associations between high SUVmax and high risk for recurrence in both types of esophageal cancer (8,13,14). Similarly, increased MTV has also been associated with poor overall survival (OS), with few studies suggesting that of the most commonly used PET/CT parameters, MTV has more prognostic importance than SUVmax (17). Other studies showed that MTV and TLG should be used together to predict OS prior to treatment (15), whereas a few showed only TLG as the best prognostic parameter (18). In short, the literature indicates that some combination of SUVmax, MTV, and/or TLG is helpful in predicting prognosis, although it is unclear which parameter or combinations of parameters are superior. However, a few studies have found that SUVmax (19), MTV (20), and TLG (21) did not correlate with survival.
Furthermore, there is increasing interest to assess the impact of intratumoral metabolic heterogeneity (IMH) using 18F-FDG PET/CT imaging (22,23). Increased IMH has been associated with a significant decrease in progression-free survival (PFS) and/or OS in other tumors such as breast cancer (24), colorectal cancer (25), adenocarcinoma, and squamous cell carcinoma of the lung (26,27). Preliminary studies have suggested that IMH has the potential to identify esophageal cancers with adverse biologic features and provide a prognostic indicator of survival (23). Chang and Kim (28) concluded that in locally advanced esophageal cancer, IMH could be a prognostic factor but that MTV was still the most important, whereas Dong et al (29) found that in resectable ESCC, IMH was the only significant risk factor for postoperative recurrence and reduced OS. The literature is still unsettled on the value of IMH, SUVmax, MTV, and TLG and the role it should play in patient management. The objective of this study was to evaluate the impact of IMH as well as other quantitative parameters for predicting PFS and OS in patients with esophageal cancer.
Materials and Methods
Study Design
The retrospective study was approved by the institutional review board and was compliant with the Health Insurance Portability and Accountability Act guidelines. The need for written informed consent was waived. An initial search was performed in our database to identify all the patients with biopsy-proven ESCC and EAC who had undergone a baseline 18F-FDG PET/CT study (prior to any treatment) for initial staging between July 2006 and February 2016. Of 175 possible patients, patients without a baseline study (n = 81), with alternative histopathologic findings (n = 6), or with predominately gastric cancer with only minimal involvement of the esophagus (n = 17) were excluded. A total of 71 patients met the study criteria consisting of 61 patients with EAC and 10 with ESCC. These patients were not used in previous research studies. Date of death or last day of follow-up as well as date of progression per the medical chart were noted. Patient demographics and tumor staging were also collected. The median follow-up time from biopsy was 28.2 months (range, 4–38 months). Endpoints were PFS and OS, which were calculated from the time of the tumor biopsy to the time of recurrence or death.
PET/CT Technical Parameters
18F-FDG PET/CT scans were acquired according to our clinical protocol. Patient preparation included fasting for at least 4 hours before the study and a blood glucose level lower than 200 mg/dL (11.1 mmol/L) at the time of 18F-FDG injection (PETNET Solutions of Siemens Healthineers). Patients drank 450 mL of Bracco Readi-Cat 2 barium sulfate (2% weight/volume) as oral contrast medium before radiotracer was injected and were oriented to void before initiation of the study. PET/CT images were acquired following an uptake time of 60 minutes ± 10 (standard deviation) after 18F-FDG injection (dose 0.07 mCi [2.59 MBq] per pound, 10 mCi [370 MBq] minimum, 20 mCi [740 MBq] maximum) with a Biograph TruePoint PET/CT 64-section scanner (Siemens Healthcare). No intravenous contrast material was used. The PET images were reconstructed using iterative reconstruction (four iterations and eight subsets), with Gaussian filter and matrix of 168 × 168. For the CT acquisition, section thickness of 5 mm, matrix of 512 × 512, 120 kVp, 200 mAs, and field of view of 70 cm2 were used.
PET/CT Image Analysis
The MIMvista software was used to review all 18F-FDG PET/CT studies (version 6.2, MIM Software, Cleveland, Ohio). A physician who is board certified in nuclear medicine and in radiology with 10 years of experience reviewed the PET/CT images, blinded to any clinical information. The PET, CT, and fused PET/CT axial, coronal, and sagittal images were used for identification of the primary tumor. The IMH was calculated as the area under the curve (AUC) of a cumulative SUV-volume histogram (CSH) by using a gradient-based method, consisting of an edge detection tool that automatically generated the region of interest based on the boundaries of the 18F-FDG-avid lesion as described by Chirindel et al (30). The lower AUC corresponded to a higher degree of IMH. The segmentation method was generated automatically and reviewed manually to ensure that adjacent 18F-FDG-avid structures were not included in the region of interest. This method was previously described by van Velden et al (31).
Other parameters that were evaluated using the gradient-based method were SUVmax, representing the maximum single-pixel value of the volume of interest adjusted for lean body mass; mean standardized uptake volume (SUVmean), representing the average of SUV in the volume of interest; the MTV, representing the 18F-FDG-avid tumor volume; and the TLG, defined as the MTV multiplied by average SUV of included voxels.
Statistical Analysis
To put different imaging parameters to the same scale, variable standardization (minus mean then divided by standard deviation) was performed. Cox proportion hazard regression model was used for both PFS and OS. Estimated hazard ratios (HRs), therefore, can be interpreted as HR associated with change in 1 standard deviation in the imaging parameter. To adjust for possible confounders, age, sex, weight, stage, tumor type, tumor grade, and treatment were also included in the Cox regression models (as covariates). To investigate whether a combination of imaging parameters had more association with survival than a single parameter, stepwise variable selection algorithm (on all imaging parameters) was used with multivariable analysis. Age, sex, stage, weight, tumor type, tumor grade, and treatment were adjusted as covariates as well. A subanalysis was performed to include only the patients with adenocarcinoma (n = 61). Firth penalized likelihood adjustment was used to reduce bias from data. For significant imaging measurements, patients were further grouped according to their median value, and Kaplan-Meier curves were used to illustrate the difference in survival between the groups. Log-rank tests were also performed to test the difference in the distributions of survival. A P value of .05 or less was considered as statistically significant. All analysis was performed using SAS 9.4 software (SAS Institute, Cary, NC).
Results
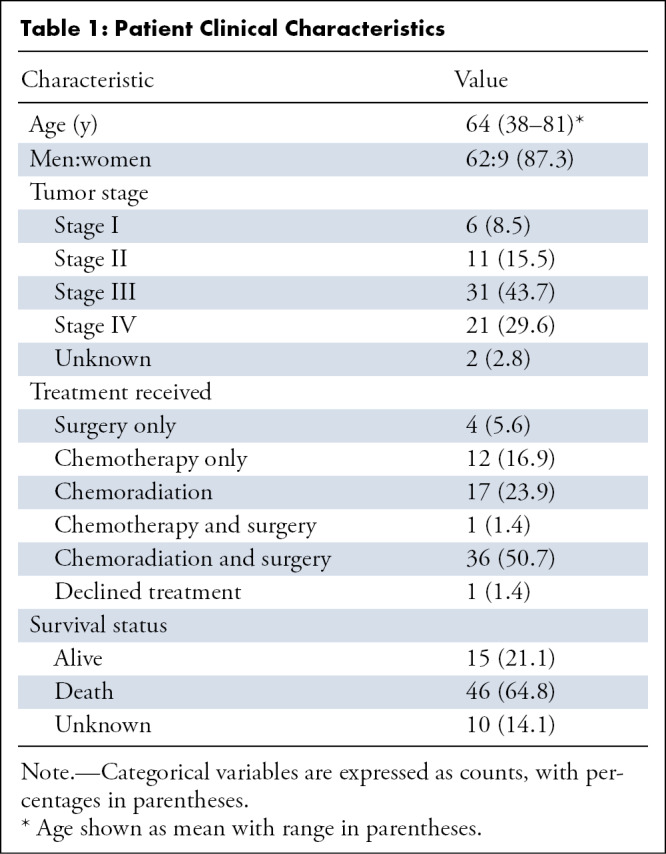
Patient demographics are shown in Table 1. Of the 71 patients, 61 patients had EAC and 10 patients had ESCC. The mean age of the patients was 64 years ± 10; 43% of patients had stage III and 30% had stage IV cancer on initial staging. Approximately half (36 of 71) of the patients underwent chemoradiation and surgery as treatment. A total of 65% of the patients (46 of 71) were confirmed dead by the end of this study, with 21% alive (15 of 71), and 14% with no recent survival data (10 of 71), which were consequently censored in the last day of contact. The median survival was 16.1 months (range, 0.1–60.3 months). Of all 71 patients, 18 patients had progression. The average time for progression was 15.4 months (range, 0.8–64.6 months).
Table 1:
Patient Clinical Characteristics
The average SUVmax was 9.6 ± 4.8, the average SUVmean was 5.4 ± 2.2, the average MTV was 29.4 mL ± 42.1, the average TLG was 185 ± 303, and the average AUC-CSH was 6056.8 ± 1099.7. In the univariable analysis adjusted for age, sex, weight, stage, tumor type, tumor grade, and treatment, a lower AUC-CSH (greater IMH) was associated with reduced PFS for every standard deviation decrease in the AUC (HR, 10.78; 95% CI: 1.31, 88.96; P = .03). Higher MTV was associated with reduced PFS for every standard deviation increase (HR, 0.193; 95% CI: 0.052, 0.711; P = .01) (Table 2). In multivariable Cox regression analysis, with AUC-CSH included in the model, addition of any other variable did not increase the association with PFS. There was no significant correlation of any of the imaging parameters with OS (Table 3). Kaplan-Meier survival curves showed lower survival in patients with greater IMH (higher AUC-CSH index) (P = .03) (Fig 1) and lower survival in patients with higher MTV.
Table 2:
Estimated Adjusted Hazard Ratios for PFS for Each Imaging Parameter
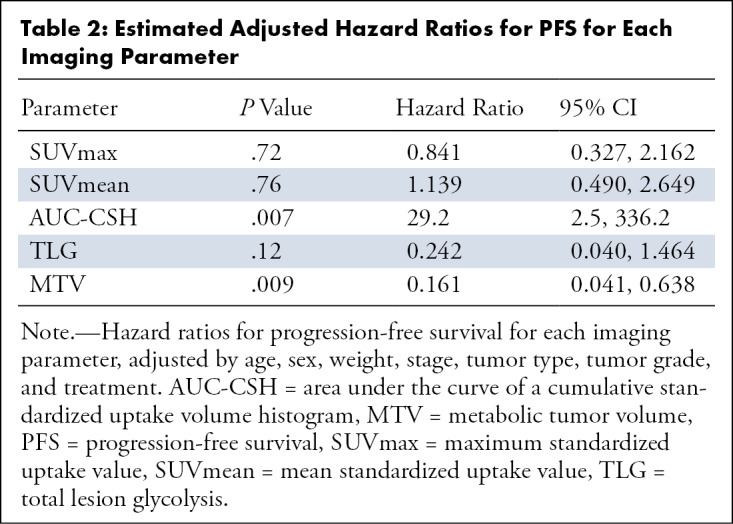
Table 3:
Estimated Hazard Ratios for OS for Each Imaging Parameter
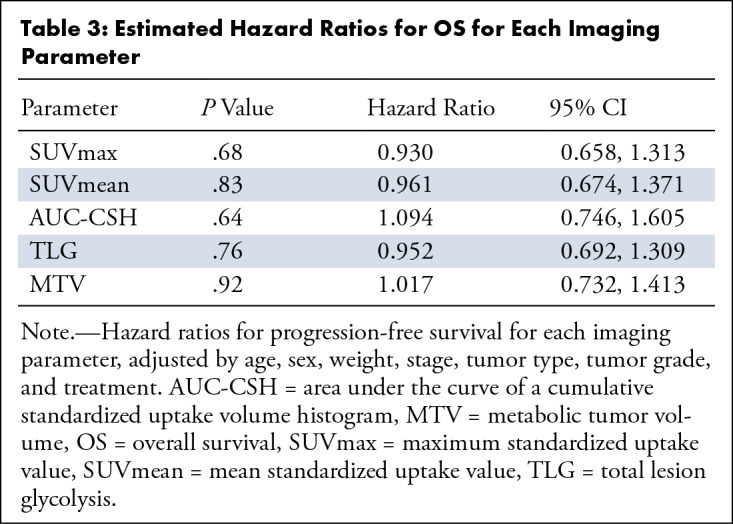
Figure 1:
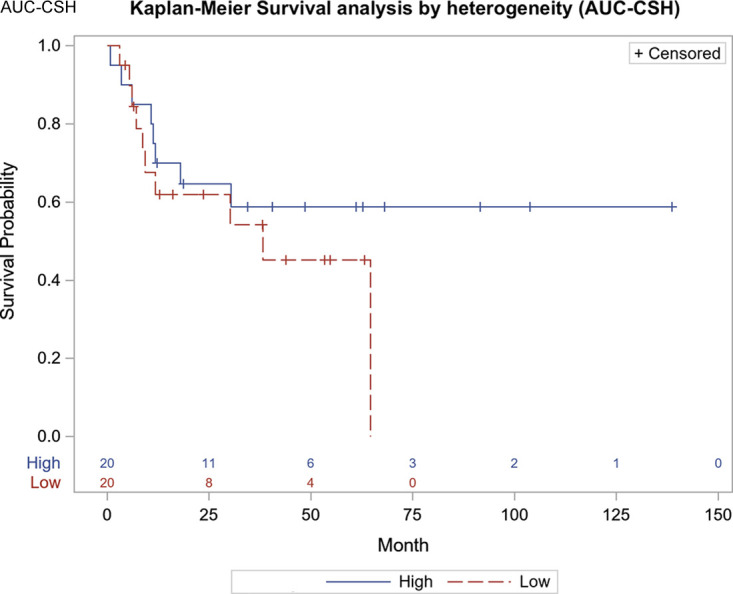
Progression-free survival curve based on median cutoff points for area under the curve of cumulative standardized uptake value volume histogram (P = .03). AUC-CSH = area under the curve of a cumulative standardized uptake-volume histogram.
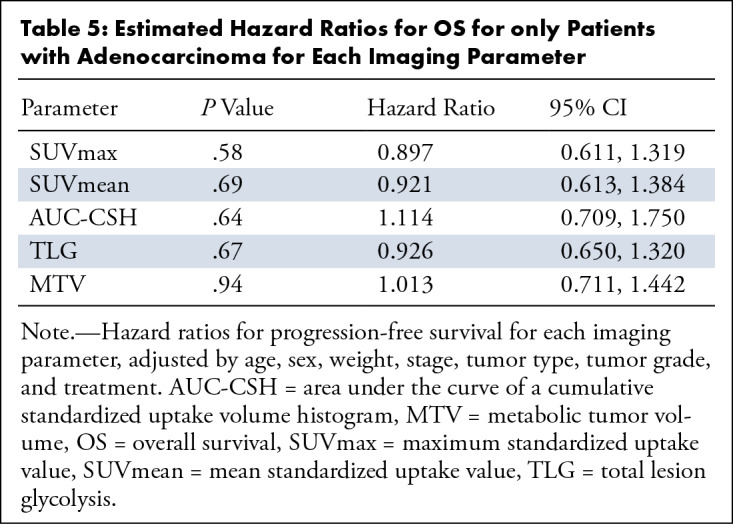
A subanalysis of the data, including only patients with EAC, is shown in Tables 4 and 5. The findings of the subanalysis were similar to the combined data showing that a lower AUC-CSH (greater IMH) was also associated with reduced PFS for every standard deviation decrease in the AUC (HR, 47; 95% CI: 2.1, 1090; P = .02) and a higher MTV was associated with reduced PFS for every standard deviation increase (HR, 0.192; 95% CI: 0.039, 0.942; P = .04). No significant association was observed for any of the imaging parameters and OS for the EAC-only subset of data.
Table 4:
Estimated Hazard Ratios for PFS for only Patients with Adenocarcinoma for Each Imaging Parameter
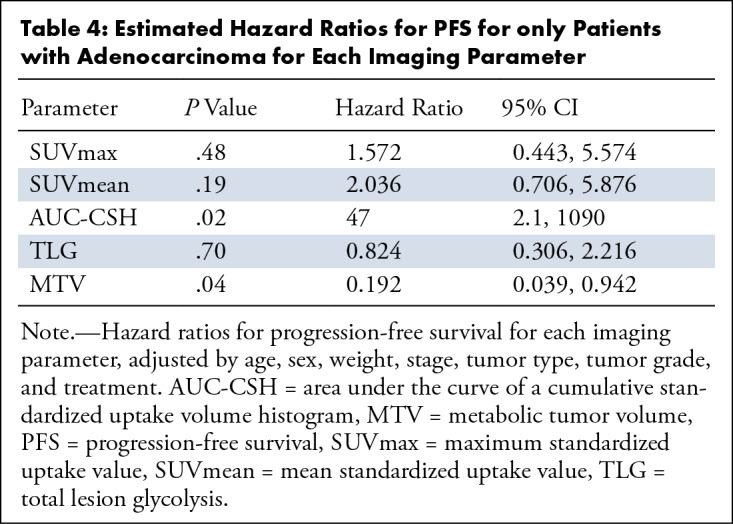
Table 5:
Estimated Hazard Ratios for OS for only Patients with Adenocarcinoma for Each Imaging Parameter
Discussion
Our objective was to assess the prognostic value of the quantitative parameters taken during the baseline pretreatment 18F-FDG PET/CT in patients with esophageal cancer by correlating the quantitative parameters with PFS and OS. We evaluated SUVmax, SUVmean, MTV, TLG, and specifically IMH, which was calculated using AUC-CSH indexes. We found a statistically significant association of AUC-CSH with PFS, both on the combined ESCC and EAC data and the EAC data only, but not with OS. MTV also showed a significant association with PFS, but not with OS.
The purpose of having accurate prognostic information at the time of diagnosis is to provide an individual risk assessment for patients to tailor treatment and provide individualized care (Fig 2). Although there has been an increased interest to evaluate quantitative parameters (SUVmax, MTV, TLG, and IMH) to predict outcomes, it is still unclear which parameters should primarily be used.
Figure 2:
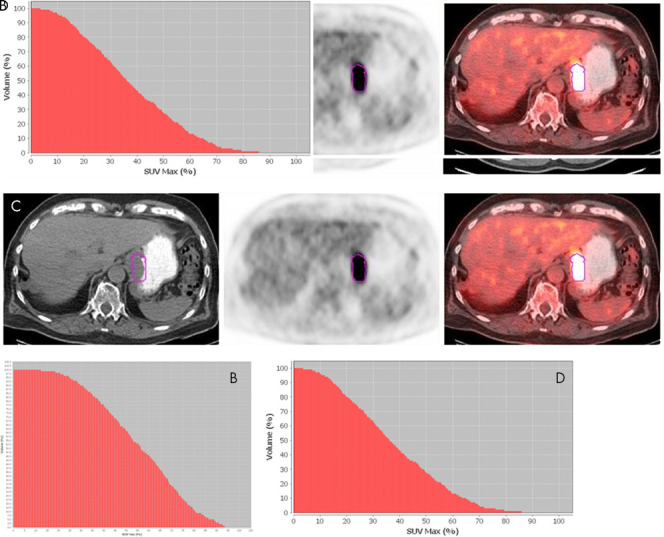
A, Axial 18F fluorodeoxyglucose (18F-FDG) PET/CT images in a 55-year-old man with stage III moderately differentiated adenocarcinoma (outlined in purple), with maximum standardized uptake value (SUVmax) of 9.54, metabolic tumor volume (MTV) of 19.12 mL, area under the curve of cumulative standardized uptake value volume histogram (AUC-CSH) of 6458, and a large area under the curve, corresponding to low IMH, B. This patient survived for 91 months after diagnosis. C, Axial 18F-FDG PET/CT images in an 80-year-old man with stage III moderately differentiated adenocarcinoma, with a higher SUVmax of 20.4 and slightly higher MTV of 22.45 mL (compared with the patient in A and B), D, but a lower AUC-CSH of 4805 (significantly smaller area under the curve), corresponding to high IMH. This patient survived for 60 months after diagnosis.
Dong et al (32) conducted a study in patients with ESCC who underwent initial staging PET/CT who underwent surgical resection as part of the treatment plan. They found that AUC-CSH and MTV were significant prognostic factors for PFS. In their multivariable analysis, AUC-CSH was identified as the only significant risk factor for PFS and OS. Our study paralleled the findings of Dong et al because both AUC-CSH and MTV were prognostic of PFS. Our multivariable analysis also found AUC-CSH was an independent predictor of PFS, however, not OS. A possible explanation could be that the patient populations were slightly different. In the Dong et al study, only patients undergoing surgical resection were included, in comparison with our study which included patients undergoing not only surgery, but also chemoradiation.
Tixier et al (33) studied patients with newly diagnosed esophageal cancer treated with chemoradiation only, who were classified as nonresponders (progressive or stable disease), partial responders, or complete responders. Tixier et al computed IMH by textural features defined as a spatial arrangement of a predefined number of voxels which was different than the AUC-CSH method used in our study, yet still found that IMH was the best method of stratification of patients with esophageal cancer in the context of therapy-response prediction. Another similar study done by Ganeshan et al (23), which evaluated heterogeneity using CT texture analysis carried out using a software algorithm that selectively filters and extracts textures at different anatomic scales, found that CT heterogeneity was an independent predictor of survival. However, this study evaluated CT heterogeneity instead of IMH and did not select patients by treatment type.
On the basis of the previously mentioned studies, IMH appears to be a promising prognostic indicator in patients who underwent surgical treatment as well as chemoradiation. However, Nakajo et al (16) found that in patients with initial staging PET/CT prior to chemoradiation, MTV, TLG, or IMH were not independent prognostic factors on univariate or multivariate analysis. Nakajo et al concluded that while PET/CT parameters can predict tumor response, these parameters have limited value in prognosis prediction. However, Nakajo et al characterized IMH through analysis at the level of groups of voxels to calculate intensity variability, size-zone variability, and zone percentage as the parameters. Hatt et al (17) analyzed a database that included patients with cancers of the breast, cervix, esophagus, head and neck, and lung for prognosis prediction from initial PET/CT. This study found that while both MTV and IMH were independent prognostic factors in non–small cell lung cancers, in esophageal cancer specifically, volume and IMH had less value in prognosis prediction because of smaller overall tumors volumes. In the studies by Nakajo et al and Hatt et al, they found that IMH may not be as valuable of a marker as we expected, but the method in which IMH of a tumor is calculated could potentially explain the difference.
Although measuring IMH is an innovative marker for characterizing malignancies, only a few studies have evaluated this parameter in esophageal cancer. Among the studies that have conducted evaluations, there have been differences in diagnosis (adenocarcinoma vs squamous cell carcinoma), treatment (surgery vs chemoradiation), and the approach to quantifying IMH between studies. As outlined by Wilson et al (34), currently the sensitivity and specificity of PET/CT parameters to predict survival is not currently high enough to significantly impact treatment plans, and therefore we suggest that a multiparameter combined approach may be more useful in the future.
Although our findings were promising for using IMH as a prognostic indicator, there were some notable limitations of our retrospective study. We used a public registry to search for patient death, which can have variable accuracy compared with patients who were followed closely by our hospital until death. Few patients were altogether lost to follow-up which limited our sample size of usable patients, leading to a small decrease in power. Another limitation included the inherent bias related to the retrospective nature of the study. The patients in our sample had a wide variety of clinical stages at diagnosis, and consequently underwent different treatment regimens, which included chemoradiation or radiation only at varying doses and/or surgery, which could have affected the outcome. Patients included in this study had several nonsignificant findings at PET/CT, but there was no particular association with any of the quantitative PET parameters. Also, although the obtained HRs related specifically to our institution, it can be generalized to some extent. Future studies should evaluate larger cohorts with more patients to better control for differences in tumor type, stage, and treatment, as well as establish a standard clinically feasible method for calculating IMH in PET/CT imaging to allow for optimal application.
Our study evaluated a large cohort of patients with either adenocarcinoma or squamous cell carcinoma of the esophagus and demonstrated that IMH and MTV of the primary tumor derived from pretreatment 18F-FDG PET/CT were the only quantitative parameters that were predictive of PFS. 18F-FDG PET/CT quantitative parameters on initial staging scan can provide prognostic information, potentially leading to a more personalized approach for a patient’s treatment.
Current address: Otago Medical School, University of Otago, Dunedin, New Zealand.
Authors declared no funding for this work.
Disclosures of Conflicts of Interest: A.G. disclosed no relevant relationships. D.F.P. disclosed no relevant relationships. Y.X. Activities related to the present article: disclosed no relevant relationships. Activities not related to the present article: employed by UT Southwestern Medical Center. Other relationships: disclosed no relevant relationships. R.S. disclosed no relevant relationships.
Abbreviations:
- AUC
- area under the curve
- CSH
- cumulative SUV-volume histogram
- EAC
- esophageal adenocarcinoma
- ESCC
- esophageal squamous cell carcinoma
- FDG
- fluorodeoxyglucose
- HR
- hazard ratio
- IMH
- intratumoral metabolic heterogeneity
- MTV
- metabolic tumor volume
- OS
- overall survival
- PFS
- progression-free survival
- SUVmax
- maximum standardized uptake value
- SUVmean
- mean standardized uptake value
- TLG
- tumor lesion glycolysis
References
- 1.Smyth EC, Lagergren J, Fitzgerald RC, et al. Oesophageal cancer. Nat Rev Dis Primers 2017;3:17048. [DOI] [PMC free article] [PubMed] [Google Scholar]
- 2.Koshy M, Esiashvilli N, Landry JC, Thomas CR Jr, Matthews RH. Multiple management modalities in esophageal cancer: epidemiology, presentation and progression, work-up, and surgical approaches. Oncologist 2004;9(2):137–146. [DOI] [PubMed] [Google Scholar]
- 3.Dong J, Thrift AP. Alcohol, smoking and risk of oesophago-gastric cancer. Best Pract Res Clin Gastroenterol 2017;31(5):509–517. [DOI] [PubMed] [Google Scholar]
- 4.Engel LS, Chow WH, Vaughan TL, et al. Population attributable risks of esophageal and gastric cancers. J Natl Cancer Inst 2003;95(18):1404–1413. [DOI] [PubMed] [Google Scholar]
- 5.Glenn TF. Esophageal cancer. Facts, figures, and screening. Gastroenterol Nurs 2001;24(6):271–273; quiz 274–275. [PubMed] [Google Scholar]
- 6.Thrift AP. The epidemic of oesophageal carcinoma: Where are we now? Cancer Epidemiol 2016;41:88–95. [DOI] [PubMed] [Google Scholar]
- 7.Zaidi N, Kelly RJ. The management of localized esophageal squamous cell carcinoma: Western approach. Chin Clin Oncol 2017;6(5):46. [DOI] [PubMed] [Google Scholar]
- 8.Zhu WQ, Sun X, Xing L, et al. Oesophageal squamous cell carcinoma: relationship between fluorine-18 fludeoxyglucose positron emission tomography CT maximum standardised uptake value, metabolic tumour volume, and tumour, node and metastasis classification. Br J Radiol 2012;85(1016):e383–e387. [DOI] [PMC free article] [PubMed] [Google Scholar]
- 9.Rice TW, Apperson-Hansen C, DiPaola LM, et al. Worldwide Esophageal Cancer Collaboration: clinical staging data. Dis Esophagus 2016;29(7):707–714. [DOI] [PMC free article] [PubMed] [Google Scholar]
- 10.Rice TW. Clinical staging of esophageal carcinoma. CT, EUS, and PET. Chest Surg Clin N Am 2000;10(3):471–485. [PubMed] [Google Scholar]
- 11.Wallace MB, Nietert PJ, Earle C, et al. An analysis of multiple staging management strategies for carcinoma of the esophagus: computed tomography, endoscopic ultrasound, positron emission tomography, and thoracoscopy/laparoscopy. Ann Thorac Surg 2002;74(4):1026–1032. [DOI] [PubMed] [Google Scholar]
- 12.van Vliet EP, Heijenbrok-Kal MH, Hunink MG, Kuipers EJ, Siersema PD. Staging investigations for oesophageal cancer: a meta-analysis. Br J Cancer 2008;98(3):547–557. [DOI] [PMC free article] [PubMed] [Google Scholar]
- 13.Feng R, Li MH, Kong L, Shi F, Yang GR, Yu JM. Correlation between PET-CT 18FDG uptake in primary lesions and clinicopathological parameters in esophageal carcinoma patients [in Chinese]. Zhonghua Zhong Liu Za Zhi 2009;31(6):452–454. [PubMed] [Google Scholar]
- 14.Pan L, Gu P, Huang G, Xue H, Wu S. Prognostic significance of SUV on PET/CT in patients with esophageal cancer: a systematic review and meta-analysis. Eur J Gastroenterol Hepatol 2009;21(9):1008–1015. [DOI] [PubMed] [Google Scholar]
- 15.Han S, Kim YJ, Woo S, Suh CH, Lee JJ. Prognostic Value of Volumetric Parameters of Pretreatment 18F-FDG PET/CT in Esophageal Cancer: A Systematic Review and Meta-analysis. Clin Nucl Med 2018;43(12):887–894. [DOI] [PubMed] [Google Scholar]
- 16.Nakajo M, Jinguji M, Nakabeppu Y, et al. Texture analysis of 18F-FDG PET/CT to predict tumour response and prognosis of patients with esophageal cancer treated by chemoradiotherapy. Eur J Nucl Med Mol Imaging 2017;44(2):206–214. [DOI] [PubMed] [Google Scholar]
- 17.Hatt M, Majdoub M, Vallières M, et al. 18F-FDG PET uptake characterization through texture analysis: investigating the complementary nature of heterogeneity and functional tumor volume in a multi-cancer site patient cohort. J Nucl Med 2015;56(1):38–44. [DOI] [PubMed] [Google Scholar]
- 18.Cervino AR, Evangelista L, Alfieri R, et al. Positron emission tomography/computed tomography and esophageal cancer in the clinical practice: How does it affect the prognosis? J Cancer Res Ther 2012;8(4):619–625. [DOI] [PubMed] [Google Scholar]
- 19.Vatankulu B, Şanlı Y, Kaytan Sağlam E, et al. Does Metastatic Lymph Node SUVmax Predict Survival in Patients with Esophageal Cancer? Mol Imaging Radionucl Ther 2015;24(3):120–127. [DOI] [PMC free article] [PubMed] [Google Scholar]
- 20.Blom RL, Steenbakkers IR, Lammering G, et al. PET/CT-based metabolic tumour volume for response prediction of neoadjuvant chemoradiotherapy in oesophageal carcinoma. Eur J Nucl Med Mol Imaging 2013;40(10):1500–1506. [DOI] [PubMed] [Google Scholar]
- 21.Hofheinz F, Li Y, Steffen IG, et al. Confirmation of the prognostic value of pretherapeutic tumor SUR and MTV in patients with esophageal squamous cell carcinoma. Eur J Nucl Med Mol Imaging 2019;46(7):1485–1494. [DOI] [PubMed] [Google Scholar]
- 22.Dong X, Wu P, Sun X, et al. Intra-tumour 18F-FDG uptake heterogeneity decreases the reliability on target volume definition with positron emission tomography/computed tomography imaging. J Med Imaging Radiat Oncol 2015;59(3):338–345. [DOI] [PubMed] [Google Scholar]
- 23.Ganeshan B, Skogen K, Pressney I, Coutroubis D, Miles K. Tumour heterogeneity in oesophageal cancer assessed by CT texture analysis: preliminary evidence of an association with tumour metabolism, stage, and survival. Clin Radiol 2012;67(2):157–164. [DOI] [PubMed] [Google Scholar]
- 24.Gong C, Ma G, Hu X, et al. Pretreatment 18F-FDG Uptake Heterogeneity Predicts Treatment Outcome of First-Line Chemotherapy in Patients with Metastatic Triple-Negative Breast Cancer. Oncologist 2018;23(10):1144–1152. [DOI] [PMC free article] [PubMed] [Google Scholar]
- 25.Han YH, Jeong HJ, Sohn MH, Lim ST. Clinical value of intratumoral metabolic heterogeneity in [18F]FDG PET/CT for prediction of recurrence in patients with locally advanced colorectal cancer. Q J Nucl Med Mol Imaging 2018;62(4):445–452. [DOI] [PubMed] [Google Scholar]
- 26.Kang SR, Song HC, Byun BH, et al. Intratumoral Metabolic Heterogeneity for Prediction of Disease Progression After Concurrent Chemoradiotherapy in Patients with Inoperable Stage III Non-Small-Cell Lung Cancer. Nucl Med Mol Imaging 2014;48(1):16–25. [DOI] [PMC free article] [PubMed] [Google Scholar]
- 27.Kim DH, Jung JH, Son SH, et al. Prognostic Significance of Intratumoral Metabolic Heterogeneity on 18F-FDG PET/CT in Pathological N0 Non-Small Cell Lung Cancer. Clin Nucl Med 2015;40(9):708–714. [DOI] [PubMed] [Google Scholar]
- 28.Chang S, Kim SJ. Prediction of Recurrence and Mortality of Locally Advanced Esophageal Cancer Patients Using Pretreatment F-18 FDG PET/CT Parameters: Intratumoral Heterogeneity, SUV, and Volumetric Parameters. Cancer Biother Radiopharm 2016;31(1):1–6. [DOI] [PubMed] [Google Scholar]
- 29.Dong X, Xing L, Wu P, et al. Three-dimensional positron emission tomography image texture analysis of esophageal squamous cell carcinoma: relationship between tumor 18F-fluorodeoxyglucose uptake heterogeneity, maximum standardized uptake value, and tumor stage. Nucl Med Commun 2013;34(1):40–46. [DOI] [PubMed] [Google Scholar]
- 30.Chirindel A, Alluri KC, Chaudhry MA, et al. Prognostic Value of FDG PET/CT-Derived Parameters in Pancreatic Adenocarcinoma at Initial PET/CT Staging. AJR Am J Roentgenol 2015;204(5):1093–1099. [DOI] [PubMed] [Google Scholar]
- 31.van Velden FH, Cheebsumon P, Yaqub M, et al. Evaluation of a cumulative SUV-volume histogram method for parameterizing heterogeneous intratumoural FDG uptake in non-small cell lung cancer PET studies. Eur J Nucl Med Mol Imaging 2011;38(9):1636–1647. [DOI] [PMC free article] [PubMed] [Google Scholar]
- 32.Dong X, Sun X, Zhao X, et al. The impact of intratumoral metabolic heterogeneity on postoperative recurrence and survival in resectable esophageal squamous cell carcinoma. Oncotarget 2017;8(9):14969–14977. [DOI] [PMC free article] [PubMed] [Google Scholar]
- 33.Tixier F, Le Rest CC, Hatt M, et al. Intratumor heterogeneity characterized by textural features on baseline 18F-FDG PET images predicts response to concomitant radiochemotherapy in esophageal cancer. J Nucl Med 2011;52(3):369–378. [DOI] [PMC free article] [PubMed] [Google Scholar]
- 34.Wilson JM, Partridge M, Hawkins M. The application of functional imaging techniques to personalise chemoradiotherapy in upper gastrointestinal malignancies. Clin Oncol (R Coll Radiol) 2014;26(9):581–596. [DOI] [PMC free article] [PubMed] [Google Scholar]


