Abstract
Nearly 80% of cirrhotic patients diagnosed with hepatocellular carcinoma (HCC) are not eligible for surgical resection and instead undergo local-regional treatment. After therapy for HCC, patients undergo imaging surveillance to assess treatment efficacy and identify potential sites of progressive tumor elsewhere within the liver. Accurate interpretation of posttreatment imaging is essential for guiding further management decisions, and radiologists must understand expected treatment-specific imaging findings for each of the local-regional therapies. Of interest, expected imaging findings seen after radiation-based therapies (transarterial radioembolization and stereotactic body radiation therapy) are different than those seen after thermal ablation and transarterial chemoembolization. Given differences in expected posttreatment imaging findings, the current radiologic treatment response assessment algorithms used for HCC (modified Response Evaluation Criteria in Solid Tumors classification, European Association for the Study of Liver Diseases criteria, and Liver Imaging and Reporting Data System Treatment Response Algorithm) must be applied cautiously for radiation-based therapies in which persistent arterial phase hyperenhancement in the early posttreatment period is common and expected. This article will review the concept of tumor response assessment for HCC, the forms of local-regional therapy for HCC, and the expected posttreatment findings for each form of therapy.
Keywords: Abdomen/GI, Liver, MR-Imaging, Treatment Effects, Tumor Response
© RSNA, 2020
Summary
MRI findings vary for each form of local-regional treatment for hepatocellular carcinoma, particularly radiation therapies, and thus an understanding of expected findings for each therapy is essential for accurate tumor response assessment to help guide appropriate clinical management.
Essentials
■ After thermal ablation or transarterial chemoembolization, a hypervascular rim surrounding the treated tumor may be differentiated from residual or recurrent tumor by its smooth, thin, and continuous morphology; any disruption of this smooth continuous rim should raise concern for a viable tumor.
■ Persistent central, nodular, or masslike arterial phase hyperenhancement after transarterial radioembolization (TARE) should be cautiously interpreted early posttreatment, as this does not definitively indicate viable tumor.
■ After stereotactic body radiation therapy (SBRT) for hepatocellular carcinoma, persistent arterial phase enhancement is an expected finding that can be seen for 1 year or even longer after treatment.
■ The modified Response Evaluation Criteria in Solid Tumors, European Association for the Study of Liver Disease, and Liver Imaging and Reporting Data System tumor response classification systems should be applied cautiously for radiation-based therapies (TARE, SBRT) for which persistent arterial phase hyperenhancement in the early posttreatment period is common.
Introduction
There are many treatment options for patients with a diagnosis of hepatocellular carcinoma (HCC). The American Association for the Study of Liver Diseases recommends a variety of curative or noncurative treatment options (1). Curative treatments include orthotopic liver transplantation, surgical resection, and ablation. Noncurative treatments, aimed at slowing tumor progression, palliating symptoms, or prolonging survival, include transarterial chemoembolization (TACE), transarterial radioembolization (TARE), stereotactic body radiation therapy (SBRT), and systemic chemotherapy and immunotherapy.
Local-regional therapies have been shown to improve disease-free and overall survival in patients with HCC who cannot undergo resection (2,3). They are commonly used as a bridge to transplant or for downstaging borderline transplant-eligible patients into Milan criteria (4). Choosing the optimal treatment for patients with HCC is commonly made by a multidisciplinary liver tumor board and influenced by a variety of factors including tumor location and T-stage, liver function, medical comorbidity, functional status, substance abuse, transplant eligibility, locally available expertise, and availability of different treatment options (5,6).
After therapy for HCC, patients undergo multiphasic imaging surveillance to assess treatment efficacy and to identify potential sites of progressive tumor elsewhere within the liver. Surveillance imaging time intervals depend on the treatment modality and usually range from 1 to 3 months after treatment for the first imaging study, followed by every 3 months for 2 years, and will be detailed in each treatment section below. Accurate interpretation of posttreatment imaging is essential for guiding further management decisions, particularly after local-regional therapy where there is risk for incomplete tumor response. It is essential that the radiologist understands expected treatment-specific imaging findings for each of the local-regional therapies. This includes findings within the treatment zone as well as findings within surrounding off-target hepatic parenchyma. Current radiologic treatment response assessment algorithms used for HCC include: modified Response Evaluation Criteria in Solid Tumors (mRECIST) classification (7), European Association for the Study of Liver Diseases (EASL) criteria (8), and American College of Radiology Liver Imaging and Reporting Data System (LI-RADS) treatment response algorithm (9).
This article will review the concept of tumor response assessment for HCC, the forms of local-regional therapy for HCC, and the expected posttreatment findings for each form of therapy.
Classification Systems for HCC Treatment Response Assessment
Imaging assessment after local-regional therapy heavily influences management decisions in clinical care and outcome determinations in clinical trials (10). As a result, there are several image-based treatment response assessment criteria that have been modified over time to improve accuracy in response assessment.
For most solid tumors, the World Health Organization criteria and RECIST classification are used for treatment response assessment. Both classification systems aid in quantifying and qualifying the cytotoxic effect of chemotherapeutic agents and thus rely on tumor size change as an indicator of tumor response (11) (Fig 1).
Figure 1a:
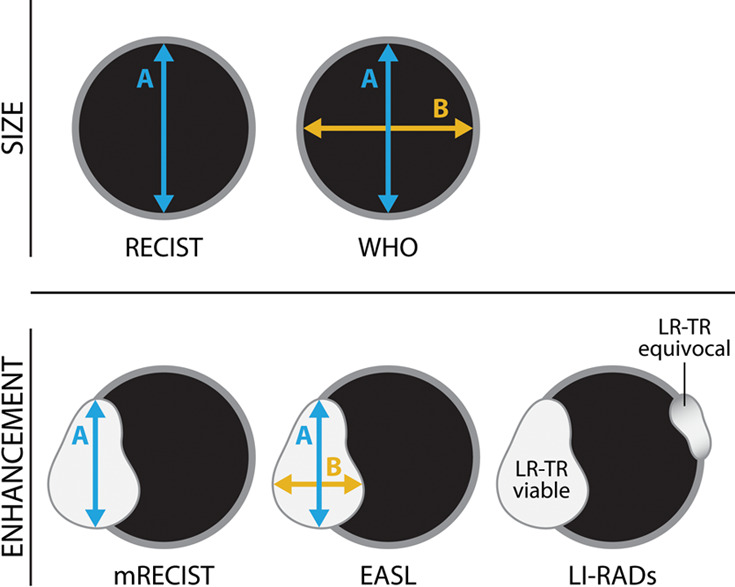
(a) Current tumor response classification systems used to report tumor response after treatment. Size-based classification systems include World Health Organization (WHO) criteria (bidimensional) and RECIST (unidimensional), where the size of the treated lesion is measured, regardless of enhancement. Enhancement-based classification systems include EASL (bidimensional), mRECIST (unidimensional), and more recently, LI-RADs (presence or absence of enhancement), where the size of the residual enhancing component is measured for the former two. (b) The LI-RADS treatment response classification system is shown. EASL = European Association for the Study of Liver Diseases, HCC = hepatocellular carcinoma, LI-RAD = Liver Imaging and Reporting Data System, LR-TR = LI-RADS treatment response, mRECIST = modified RECIST, RECIST = Response Evaluation Criteria for Solid Tumors.
Figure 1b:
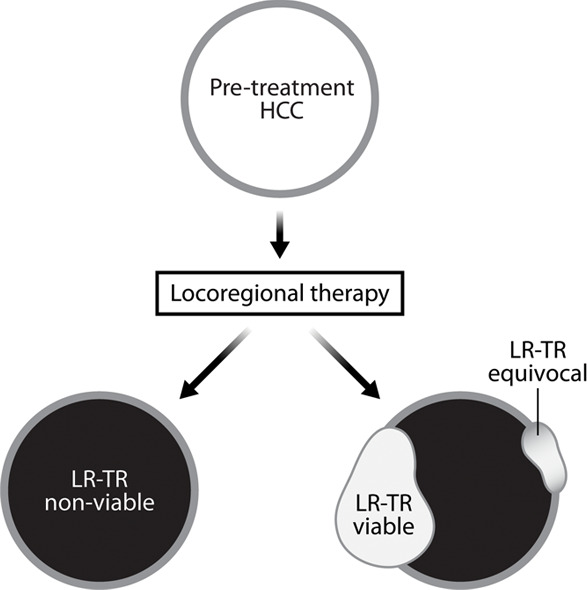
(a) Current tumor response classification systems used to report tumor response after treatment. Size-based classification systems include World Health Organization (WHO) criteria (bidimensional) and RECIST (unidimensional), where the size of the treated lesion is measured, regardless of enhancement. Enhancement-based classification systems include EASL (bidimensional), mRECIST (unidimensional), and more recently, LI-RADs (presence or absence of enhancement), where the size of the residual enhancing component is measured for the former two. (b) The LI-RADS treatment response classification system is shown. EASL = European Association for the Study of Liver Diseases, HCC = hepatocellular carcinoma, LI-RAD = Liver Imaging and Reporting Data System, LR-TR = LI-RADS treatment response, mRECIST = modified RECIST, RECIST = Response Evaluation Criteria for Solid Tumors.
However, for HCC, the degree of change in size after local-regional therapy is not always correlated to the degree of treatment success. For example, after thermal ablation, the treatment zone is expected to be larger than the index HCC, and after SBRT, shrinkage of a successfully treated tumor occurs in a delayed fashion. To account for HCC-specific considerations, HCC-specific classification systems such as EASL and mRECIST were developed to incorporate change in tumor enhancement, rather than temporal size change, to quantify the degree of treatment success (7,8). In contrast to World Health Organization criteria and RECIST, EASL and mRECIST use arterial phase hyperenhancement as the standard for tumor viability, and linear measurements are limited to enhancing components rather than the entire treated lesion (Fig 1). Response assessment categories are based on changes in enhancement compared with baseline or nadir studies and are reported as: complete response if there is no residual enhancement, partial response if there is greater than 30% decrease in ”viable” or enhancing tumor, progressive disease if there is greater than 20% increase in viable or enhancing tumor, or stable disease when none of the above criteria fit.
The American College of Radiology LI-RADS treatment response criteria is a relatively new classification system used to assess tumor response. LI-RADS treatment response (LR-TR) includes three possible categories (LR-TR viable, LR-TR equivocal, LR-TR nonviable) based on presence or absence of residual enhancement of the treated tumor (Fig 1) (9). In this classification system, the mRECIST categories of partial response, stable disease, and progressive disease would all be deemed LR-TR viable, whereas only complete response would be LR-TR nonviable.
Unfortunately, none of the HCC-specific classification systems (eg, mRECIST, EASL, LR-TR) reliably account for radiation-related treatment response (ie, SBRT, TARE) because completely treated HCCs can retain arterial phase hyperenhancement for months after therapy. Therefore, an HCC completely treated with a radiation-based modality can be misinterpreted to have residual viable disease.
Posttreatment Imaging Follow-up
Posttreatment follow-up imaging protocols vary by institution and type of local-regional therapy. There is no official widely accepted imaging protocol for postablation surveillance. However, at our institution the first posttreatment imaging for thermal ablation is ideally performed immediately following treatment to assess for residual tumor (12), assess for intraprocedural complications, and to provide a new baseline for future examinations. The advantage of intraprocedural postablation imaging is that it allows the operator to immediately assess completeness of the ablation; immediate detection of residual tumor permits immediate retreatment.
Routine follow-up imaging after thermal ablation and TACE is commonly performed 1 month after ablation and every 3 months thereafter. Follow-up after TARE and SBRT varies but is generally first performed 3 months after treatment, and every 3 months thereafter (1,12,13). Imaging performed earlier than 3 months after radiation-based therapy often shows exuberant arterial phase hyperenhancement within the targeted HCC and in off-target hepatic parenchyma which may confound interpretation.
Multiphasic contrast-enhanced liver MRI or CT are essential for accurate assessment of therapeutic response. The subsequent sections will focus on MRI findings only; however, postcontrast CT findings are analogous to those of MRI.
Thermal Ablation
The fundamental principle of thermal ablation is percutaneous (or intraoperative) application of thermal energy through a needle electrode placed directly into a targeted tumor, inducing cell death and local tumor control with minimal damage to adjacent hepatic parenchyma (14,15). Radiofrequency ablation (RFA) and microwave ablation (MWA) are currently the most common forms of thermal ablation. Cryoablation also falls into this category (well described by Song et al [16]) but will not be discussed in this review. Although mechanistically different, both microwave ablation and radiofrequency ablation heat tissue to lethal temperatures inducing denaturation of cell proteins and subsequent coagulation necrosis (17,18).
Appearance of Nonviable Tumors
During thermal ablation, boiling fluid created during tissue destruction results in tissue vaporization and gas production (ie, carbonization) (18). While the majority of the gas produced will dissipate into the bloodstream, a small volume can become trapped within the ablation cavity and persist for several weeks (19). Thus, gas identified within an ablation cavity early after the procedure should not necessarily be interpreted as infection.
An essential component of creating an adequate thermal ablation zone is creation of a “surgical” margin. The size of the treatment zone must be at least 0.5–1.0 cm larger than the HCC in all directions to eradicate potential microscopic tumor foci along the tumor margin (20). Understanding this concept is important for accurate postablation image interpretation. Additionally, necrosis, edema, and inflammation induced by ablation can further increase the size of the treated tumor (21). Careful analysis of preprocedural imaging, intraprocedural imaging, and postprocedural imaging should be performed to ensure that the ablation zone is appropriately located and adequately sized in relation to the originally targeted mass.
After assessing the size and location of the ablation zone with respect to the targeted tumor, the postcontrast sequences should be scrutinized for evidence of enhancement; a fully treated tumor will completely lack internal enhancement (20) (Figs 2, 3). On T1-weighted precontrast imaging, the central aspect of the ablation cavity usually appears hyperintense to background parenchyma secondary to coagulation necrosis. Thus, subtraction images, if appropriately registered, are helpful in confirming lack of residual enhancing tumor.
Figure 2a:
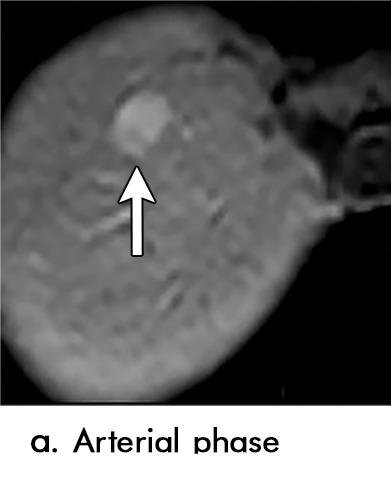
Expected imaging findings after microwave ablation (MWA). Axial images from a 57-year-old woman with cirrhosis show a (a) 2.3-cm arterial enhancing lesion (arrow) with washout (b), consistent with hepatocellular carcinoma LI-RADS 5/OPTN 5B. (c) One month after MWA, the tumor size increased by more than 25%, with central T1 precontrast hyperintense signal secondary to coagulation necrosis after MWA. (d) Arterial phase imaging 1 month after MWA shows no residual central tumoral enhancement, confirmed with subtraction images (not shown) (mRECIST CR, LI-RADS TR nonviable). Peripheral rim of smooth continuous enhancement represents granulation tissue (arrowhead). (e) Image from 9 months after MWA shows the lesion regressed in size, with persistence of the thin smooth continuous peripheral rim of enhancement. CR = complete response, LI-RADS = Liver Imaging and Reporting Data System, mRECIST = modified Response Evaluation Criteria for Solid Tumors, OPTN = Organ Procurement and Transplantation Network, TR = treatment response.
Figure 3a:
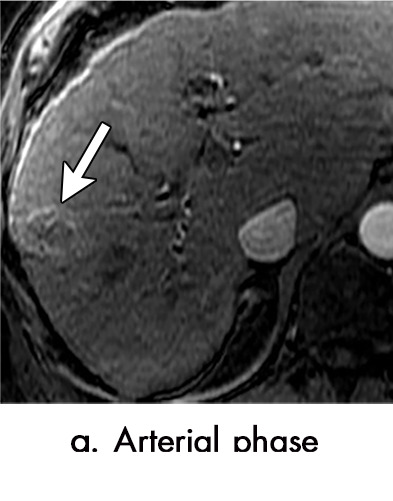
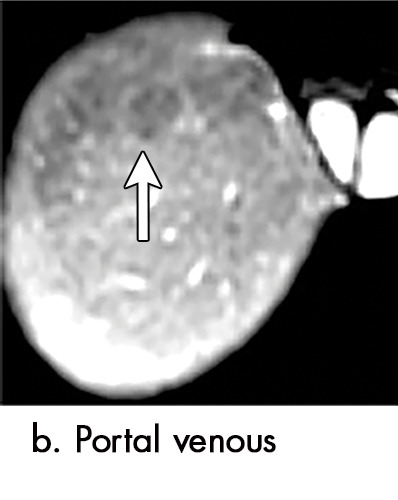
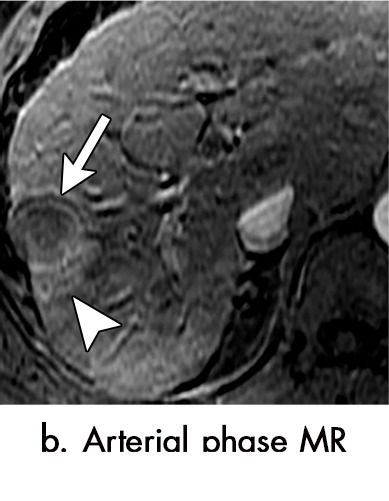
Evolution of imaging findings after microwave ablation (MWA) with subsequent recurrent disease. Images from a 62-year-old woman with biopsy-proven hepatocellular carcinoma (HCC) (arrow). (a) A 3.0-cm peripheral arterial enhancing lesion with central hypoenhancement pretreatment, compatible with an LR M lesion. (b) One month after MWA therapy there was an expected increase in size of the treated lesion with a complete lack of central enhancement, consistent with treated HCC (mRECIST CR, LI-RADS TR nonviable). Adjacent to the ablation zone there was a peripheral wedge-shaped area of arterial phase hyperenhancement (arrowhead) which persists on the portal venous phase without washout (c), favored to represent posttreatment perfusional changes. (d) Twelve months after ablation, the treated HCC continues to decrease in size with no central enhancement. However, there is a large nodular area of arterial enhancement (arrowhead in d) demonstrating washout (arrowhead in e), compatible with recurrent HCC (mRECIST PD, LI-RADS TR viable). CR = complete response, LI-RADS = Liver Imaging and Reporting Data System, mRECIST = modified Response Evaluation Criteria for Solid Tumors, PD = progressive disease, TR = treatment response.
Figure 2b:
Expected imaging findings after microwave ablation (MWA). Axial images from a 57-year-old woman with cirrhosis show a (a) 2.3-cm arterial enhancing lesion (arrow) with washout (b), consistent with hepatocellular carcinoma LI-RADS 5/OPTN 5B. (c) One month after MWA, the tumor size increased by more than 25%, with central T1 precontrast hyperintense signal secondary to coagulation necrosis after MWA. (d) Arterial phase imaging 1 month after MWA shows no residual central tumoral enhancement, confirmed with subtraction images (not shown) (mRECIST CR, LI-RADS TR nonviable). Peripheral rim of smooth continuous enhancement represents granulation tissue (arrowhead). (e) Image from 9 months after MWA shows the lesion regressed in size, with persistence of the thin smooth continuous peripheral rim of enhancement. CR = complete response, LI-RADS = Liver Imaging and Reporting Data System, mRECIST = modified Response Evaluation Criteria for Solid Tumors, OPTN = Organ Procurement and Transplantation Network, TR = treatment response.
Figure 2c:
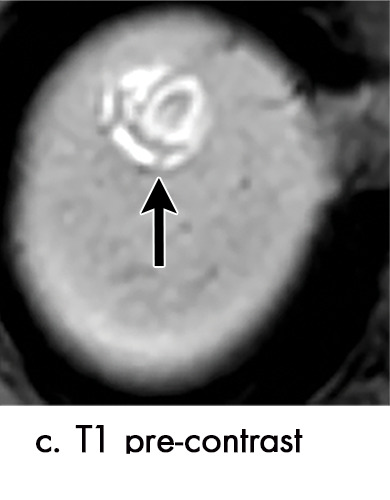
Expected imaging findings after microwave ablation (MWA). Axial images from a 57-year-old woman with cirrhosis show a (a) 2.3-cm arterial enhancing lesion (arrow) with washout (b), consistent with hepatocellular carcinoma LI-RADS 5/OPTN 5B. (c) One month after MWA, the tumor size increased by more than 25%, with central T1 precontrast hyperintense signal secondary to coagulation necrosis after MWA. (d) Arterial phase imaging 1 month after MWA shows no residual central tumoral enhancement, confirmed with subtraction images (not shown) (mRECIST CR, LI-RADS TR nonviable). Peripheral rim of smooth continuous enhancement represents granulation tissue (arrowhead). (e) Image from 9 months after MWA shows the lesion regressed in size, with persistence of the thin smooth continuous peripheral rim of enhancement. CR = complete response, LI-RADS = Liver Imaging and Reporting Data System, mRECIST = modified Response Evaluation Criteria for Solid Tumors, OPTN = Organ Procurement and Transplantation Network, TR = treatment response.
Figure 2d:

Expected imaging findings after microwave ablation (MWA). Axial images from a 57-year-old woman with cirrhosis show a (a) 2.3-cm arterial enhancing lesion (arrow) with washout (b), consistent with hepatocellular carcinoma LI-RADS 5/OPTN 5B. (c) One month after MWA, the tumor size increased by more than 25%, with central T1 precontrast hyperintense signal secondary to coagulation necrosis after MWA. (d) Arterial phase imaging 1 month after MWA shows no residual central tumoral enhancement, confirmed with subtraction images (not shown) (mRECIST CR, LI-RADS TR nonviable). Peripheral rim of smooth continuous enhancement represents granulation tissue (arrowhead). (e) Image from 9 months after MWA shows the lesion regressed in size, with persistence of the thin smooth continuous peripheral rim of enhancement. CR = complete response, LI-RADS = Liver Imaging and Reporting Data System, mRECIST = modified Response Evaluation Criteria for Solid Tumors, OPTN = Organ Procurement and Transplantation Network, TR = treatment response.
Figure 2e:

Expected imaging findings after microwave ablation (MWA). Axial images from a 57-year-old woman with cirrhosis show a (a) 2.3-cm arterial enhancing lesion (arrow) with washout (b), consistent with hepatocellular carcinoma LI-RADS 5/OPTN 5B. (c) One month after MWA, the tumor size increased by more than 25%, with central T1 precontrast hyperintense signal secondary to coagulation necrosis after MWA. (d) Arterial phase imaging 1 month after MWA shows no residual central tumoral enhancement, confirmed with subtraction images (not shown) (mRECIST CR, LI-RADS TR nonviable). Peripheral rim of smooth continuous enhancement represents granulation tissue (arrowhead). (e) Image from 9 months after MWA shows the lesion regressed in size, with persistence of the thin smooth continuous peripheral rim of enhancement. CR = complete response, LI-RADS = Liver Imaging and Reporting Data System, mRECIST = modified Response Evaluation Criteria for Solid Tumors, OPTN = Organ Procurement and Transplantation Network, TR = treatment response.
Figure 3b:
Evolution of imaging findings after microwave ablation (MWA) with subsequent recurrent disease. Images from a 62-year-old woman with biopsy-proven hepatocellular carcinoma (HCC) (arrow). (a) A 3.0-cm peripheral arterial enhancing lesion with central hypoenhancement pretreatment, compatible with an LR M lesion. (b) One month after MWA therapy there was an expected increase in size of the treated lesion with a complete lack of central enhancement, consistent with treated HCC (mRECIST CR, LI-RADS TR nonviable). Adjacent to the ablation zone there was a peripheral wedge-shaped area of arterial phase hyperenhancement (arrowhead) which persists on the portal venous phase without washout (c), favored to represent posttreatment perfusional changes. (d) Twelve months after ablation, the treated HCC continues to decrease in size with no central enhancement. However, there is a large nodular area of arterial enhancement (arrowhead in d) demonstrating washout (arrowhead in e), compatible with recurrent HCC (mRECIST PD, LI-RADS TR viable). CR = complete response, LI-RADS = Liver Imaging and Reporting Data System, mRECIST = modified Response Evaluation Criteria for Solid Tumors, PD = progressive disease, TR = treatment response.
Figure 3c:
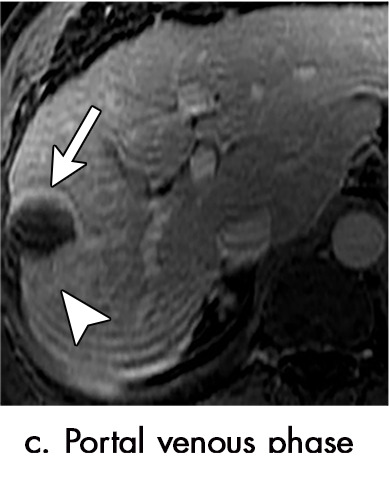
Evolution of imaging findings after microwave ablation (MWA) with subsequent recurrent disease. Images from a 62-year-old woman with biopsy-proven hepatocellular carcinoma (HCC) (arrow). (a) A 3.0-cm peripheral arterial enhancing lesion with central hypoenhancement pretreatment, compatible with an LR M lesion. (b) One month after MWA therapy there was an expected increase in size of the treated lesion with a complete lack of central enhancement, consistent with treated HCC (mRECIST CR, LI-RADS TR nonviable). Adjacent to the ablation zone there was a peripheral wedge-shaped area of arterial phase hyperenhancement (arrowhead) which persists on the portal venous phase without washout (c), favored to represent posttreatment perfusional changes. (d) Twelve months after ablation, the treated HCC continues to decrease in size with no central enhancement. However, there is a large nodular area of arterial enhancement (arrowhead in d) demonstrating washout (arrowhead in e), compatible with recurrent HCC (mRECIST PD, LI-RADS TR viable). CR = complete response, LI-RADS = Liver Imaging and Reporting Data System, mRECIST = modified Response Evaluation Criteria for Solid Tumors, PD = progressive disease, TR = treatment response.
Figure 3d:

Evolution of imaging findings after microwave ablation (MWA) with subsequent recurrent disease. Images from a 62-year-old woman with biopsy-proven hepatocellular carcinoma (HCC) (arrow). (a) A 3.0-cm peripheral arterial enhancing lesion with central hypoenhancement pretreatment, compatible with an LR M lesion. (b) One month after MWA therapy there was an expected increase in size of the treated lesion with a complete lack of central enhancement, consistent with treated HCC (mRECIST CR, LI-RADS TR nonviable). Adjacent to the ablation zone there was a peripheral wedge-shaped area of arterial phase hyperenhancement (arrowhead) which persists on the portal venous phase without washout (c), favored to represent posttreatment perfusional changes. (d) Twelve months after ablation, the treated HCC continues to decrease in size with no central enhancement. However, there is a large nodular area of arterial enhancement (arrowhead in d) demonstrating washout (arrowhead in e), compatible with recurrent HCC (mRECIST PD, LI-RADS TR viable). CR = complete response, LI-RADS = Liver Imaging and Reporting Data System, mRECIST = modified Response Evaluation Criteria for Solid Tumors, PD = progressive disease, TR = treatment response.
Figure 3e:

Evolution of imaging findings after microwave ablation (MWA) with subsequent recurrent disease. Images from a 62-year-old woman with biopsy-proven hepatocellular carcinoma (HCC) (arrow). (a) A 3.0-cm peripheral arterial enhancing lesion with central hypoenhancement pretreatment, compatible with an LR M lesion. (b) One month after MWA therapy there was an expected increase in size of the treated lesion with a complete lack of central enhancement, consistent with treated HCC (mRECIST CR, LI-RADS TR nonviable). Adjacent to the ablation zone there was a peripheral wedge-shaped area of arterial phase hyperenhancement (arrowhead) which persists on the portal venous phase without washout (c), favored to represent posttreatment perfusional changes. (d) Twelve months after ablation, the treated HCC continues to decrease in size with no central enhancement. However, there is a large nodular area of arterial enhancement (arrowhead in d) demonstrating washout (arrowhead in e), compatible with recurrent HCC (mRECIST PD, LI-RADS TR viable). CR = complete response, LI-RADS = Liver Imaging and Reporting Data System, mRECIST = modified Response Evaluation Criteria for Solid Tumors, PD = progressive disease, TR = treatment response.
T2-weighted images show variable signal intensity depending on the initial imaging appearance of the mass and the degree and type of necrosis within the treated tumor. Coagulation necrosis is typically hypointense to background parenchyma on T2-weighted images (21). Over time, ablation zones will slowly decrease in size; some may even liquefy, becoming hyperintense to background parenchyma at T2-weighted imaging (22).
A well-described normal postablation finding is a smooth thin continuous rim of peripheral hyperenhancement surrounding the ablation zone. This usually disappears within 1 month but may persist for longer (23). This is the result of inflammation and hyperemia at the interface between the ablation zone and functioning hepatic parenchyma (20). It is most apparent in the arterial phase and gradually becomes isointense to background liver on delayed phase, without washout appearance (19). The hypervascular rim may be differentiated from residual or recurrent tumor by its smooth, thin, continuous morphology; any thickened or irregular enhancement about the margin of an ablation zone or disruption of the smooth continuous rim should raise concern for viable tumor.
Geographic arterial phase hyperenhancement in the hepatic parenchyma adjacent or peripheral to the treatment zone is a normal finding and related to small arteriovenous shunts generated during needle puncture (24). These findings usually gradually disappear 3–6 months after ablation. Growth or washout within these areas of geographic peritumoral arterial enhancement could suggest underlying tumor recurrence (Fig 3). Other benign findings include dilated peripheral biliary radicals (caused by heat-induced bile duct strictures), fibrosis, and nearby hepatic parenchymal atrophy (18).
Appearance of Viable Tumors
When viable tumor is present, it is almost always located along the periphery of the ablation zone, either just within or just outside the ablation zone margin. It is rare for recurrence to be within the center of the treated tumor (at the site of maximum energy deposition). In ideal circumstances, the viable tumor would mimic the major features of untreated HCC (ie, arterial phase hyperenhancement, “washout,” and “capsule”) and would thus be easy to identify. However, recurrent or residual tumor have a variety of imaging appearances. Many cases of recurrent tumor will present with arterial phase hyperenhancment only, or “washout” only. Thus, differentiating viable tumor from posttreatment perfusional aberrations can be difficult, particularly when viable tumor is small. When faced with an equivocal finding, serial examinations may be needed for differentiation. This concept underpins the importance of frequent follow-up examinations (spaced every 3 months) after thermal ablation of an HCC.
Irregular thick rim of enhancement, peripheral nodular arterial phase hyperenhancement along the ablation margin, or disruption of the normal smooth peripheral rim of hyperemia suggest the presence of viable tumor (Fig 3). As arterial phase hyperenhancement and “washout” of viable tumor may be subtle or nondetectable, it is important to assess other sequences for enlarging masslike regions of signal abnormality. Detection of nodular or enlarging regions of impeded diffusion or moderate T2-weighted hyperintensity (24,25) aids in the detection of viable tumor; occasionally, viable tumor may be more readily discernable on unenhanced sequences. In addition, the presence of residual or new microscopic fat can aid in the detection of subtle areas of viable tumor, a finding not formally reported in the literature.
In addition to identifying viable tumor, it is important to classify viable tumor as residual versus recurrent tumor. If viable tumor is identified within 1 month of ablation, findings are indicative of residual tumor, likely related to incomplete ablation (26). However, if initial imaging shows complete treatment response and new viable tumor is identified more than 1 month later, that is classified as tumor recurrence (27). The importance of delineating residual or recurrent disease is in cases of potential liver transplant, where tumor burden plays a role in transplant eligibility. In that instance, new tumor would affect transplant eligibility, as it increases tumor burden and thus affects Milan criteria, whereas residual tumor from incomplete treatment would not affect transplant eligibility, as the residual viable tumor is still part of the original tumor burden, as per Milan criteria (1,28).
Transarterial Chemoembolization
TACE is the intra-arterial administration of chemotherapeutic agent(s) directly into an HCC from the artery or arteries supplying it, and transarterial embolization is bland embolization of the HCC arterial blood supply. HCC is primarily supplied from the arterial circulation, while nonneoplastic liver parenchyma derives the majority of its blood flow from the portal vein. Consequently, arterial-directed treatments of TACE and transarterial embolization allow preferential delivery of chemotherapeutic agents and embolic material to the tumor with relative sparing of surrounding nonneoplastic hepatic parenchyma (29). When TACE is performed, tumor cell death (necrosis) occurs by two mechanisms: ischemic injury from arterial embolization and chemotoxic injury from the administered chemotherapeutic agent (30,31).
There are two commonly performed TACE procedures which use different embolic agents. Conventional TACE is performed with a mixture of chemotherapeutic agents and iodized oil (Lipiodol), which acts as the drug-transport agent. Drug-eluting bead TACE uses microspheres which release chemotherapeutic agents in a controlled manner after the embolization is performed. In both cases, concentration of the chemotherapeutic agent within the tumor maximizes its cytotoxic effect while limiting systemic toxicity (32).
Appearance of Nonviable Tumors
The ischemic and chemotoxic effects of TACE result in cell necrosis, which usually does not immediately alter the overall size of the tumor. Therefore, at initial imaging after treatment, a completely treated tumor will usually be similar in size to the tumor at pretreatment imaging (29). However, postprocedural hemorrhage or edema may result in a temporary increase in the size of the treated tumor, with eventual regression over time.
As with thermal ablation, a tumor effectively treated with TACE immediately becomes nonenhancing. Hemorrhage, inflammation, and liquefactive necrosis can also be present in the treatment zone (33). The treatment cavity may have a variety of appearances on unenhanced T1- and T2-weighted images, but the most important finding for a completely treated HCC is lack of internal enhancement (21,31,33) (Fig 4). Treated masses usually demonstrate low signal intensity on T1- and T2-weighted images unless there is hemorrhagic or proteinaceous debris, in which case there is high signal intensity on T1-weighted images (34). In such instances, subtraction imaging may help identify subtle areas of arterial hyperenhancement indicative of viable tumor.
Figure 4a:
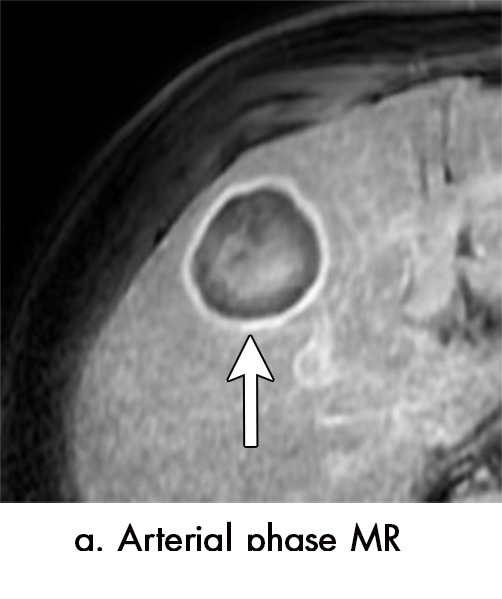
Multiple different MRI appearances seen after transarterial chemoembolization (TACE) therapy of hepatocellular carcinoma (HCC) (arrow in a and d) in three different patients (b and c in the same patient). (a) Axial T1-weighted postcontrast fat-suppressed image 1 month after TACE therapy shows a smooth continuous rim of arterial phase hyperenhancement (APHE), an expected posttreatment finding. There was no central APHE, consistent with treated tumor (mRECIST CR, LR-TR nonviable). (b) Axial T2-weighted image 1 month after TACE therapy shows high signal with a fluid-fluid level (arrow in b and c) within the treatment cavity with corresponding T1 precontrast hypointense signal (c), compatible with TACE liquefaction necrosis after treatment. Additionally, the lesion has areas of T2 hypointense signal (* in b) and T1 hyperintense signal (* in c) in other areas of the treated lesion. (d) Axial T1-weighted precontrast fat-suppressed image 1 month after TACE shows intrinsic hyperintense signal in the treated lesion, which did not enhance (confirmed on subtraction images, not shown), thus consistent with nonviable treated HCC. CR = complete response, LR = LI-RADS, mRECIST = modified Response Evaluation Criteria for Solid Tumors, TR = treatment response.
Figure 4b:
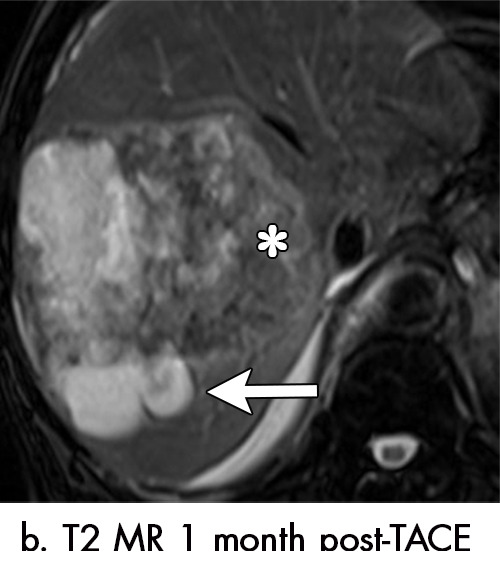
Multiple different MRI appearances seen after transarterial chemoembolization (TACE) therapy of hepatocellular carcinoma (HCC) (arrow in a and d) in three different patients (b and c in the same patient). (a) Axial T1-weighted postcontrast fat-suppressed image 1 month after TACE therapy shows a smooth continuous rim of arterial phase hyperenhancement (APHE), an expected posttreatment finding. There was no central APHE, consistent with treated tumor (mRECIST CR, LR-TR nonviable). (b) Axial T2-weighted image 1 month after TACE therapy shows high signal with a fluid-fluid level (arrow in b and c) within the treatment cavity with corresponding T1 precontrast hypointense signal (c), compatible with TACE liquefaction necrosis after treatment. Additionally, the lesion has areas of T2 hypointense signal (* in b) and T1 hyperintense signal (* in c) in other areas of the treated lesion. (d) Axial T1-weighted precontrast fat-suppressed image 1 month after TACE shows intrinsic hyperintense signal in the treated lesion, which did not enhance (confirmed on subtraction images, not shown), thus consistent with nonviable treated HCC. CR = complete response, LR = LI-RADS, mRECIST = modified Response Evaluation Criteria for Solid Tumors, TR = treatment response.
Figure 4c:
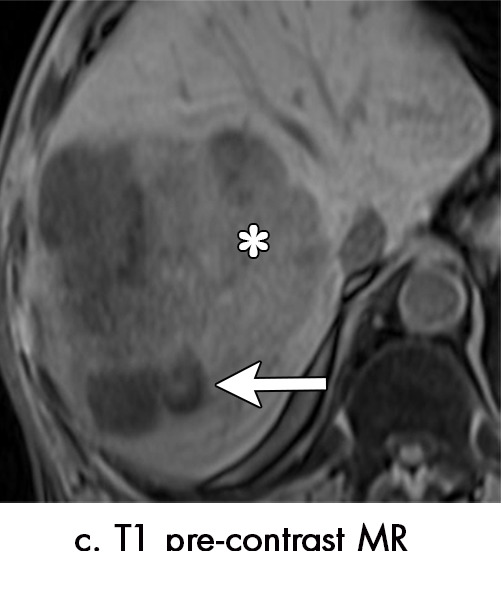
Multiple different MRI appearances seen after transarterial chemoembolization (TACE) therapy of hepatocellular carcinoma (HCC) (arrow in a and d) in three different patients (b and c in the same patient). (a) Axial T1-weighted postcontrast fat-suppressed image 1 month after TACE therapy shows a smooth continuous rim of arterial phase hyperenhancement (APHE), an expected posttreatment finding. There was no central APHE, consistent with treated tumor (mRECIST CR, LR-TR nonviable). (b) Axial T2-weighted image 1 month after TACE therapy shows high signal with a fluid-fluid level (arrow in b and c) within the treatment cavity with corresponding T1 precontrast hypointense signal (c), compatible with TACE liquefaction necrosis after treatment. Additionally, the lesion has areas of T2 hypointense signal (* in b) and T1 hyperintense signal (* in c) in other areas of the treated lesion. (d) Axial T1-weighted precontrast fat-suppressed image 1 month after TACE shows intrinsic hyperintense signal in the treated lesion, which did not enhance (confirmed on subtraction images, not shown), thus consistent with nonviable treated HCC. CR = complete response, LR = LI-RADS, mRECIST = modified Response Evaluation Criteria for Solid Tumors, TR = treatment response.
Figure 4d:
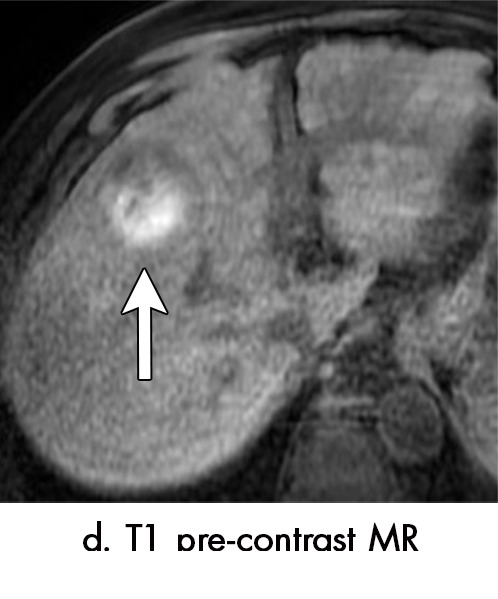
Multiple different MRI appearances seen after transarterial chemoembolization (TACE) therapy of hepatocellular carcinoma (HCC) (arrow in a and d) in three different patients (b and c in the same patient). (a) Axial T1-weighted postcontrast fat-suppressed image 1 month after TACE therapy shows a smooth continuous rim of arterial phase hyperenhancement (APHE), an expected posttreatment finding. There was no central APHE, consistent with treated tumor (mRECIST CR, LR-TR nonviable). (b) Axial T2-weighted image 1 month after TACE therapy shows high signal with a fluid-fluid level (arrow in b and c) within the treatment cavity with corresponding T1 precontrast hypointense signal (c), compatible with TACE liquefaction necrosis after treatment. Additionally, the lesion has areas of T2 hypointense signal (* in b) and T1 hyperintense signal (* in c) in other areas of the treated lesion. (d) Axial T1-weighted precontrast fat-suppressed image 1 month after TACE shows intrinsic hyperintense signal in the treated lesion, which did not enhance (confirmed on subtraction images, not shown), thus consistent with nonviable treated HCC. CR = complete response, LR = LI-RADS, mRECIST = modified Response Evaluation Criteria for Solid Tumors, TR = treatment response.
Intralesional accumulation of ethiodized oil correlates with a greater degree of tumor necrosis but can make assessment for enhancement at CT difficult. As the presence of iodized oil only minimally affects MRI signal, intralesional enhancement is usually easier to detect with MRI. The microfatty composition of the oil results in loss of signal on out-of-phase imaging when compared with in-phase imaging; this is helpful to assess the distribution of ethiodized oil at MRI and should not be confused with microscopic fat associated with HCC (34) (Fig 5).
Figure 5a:
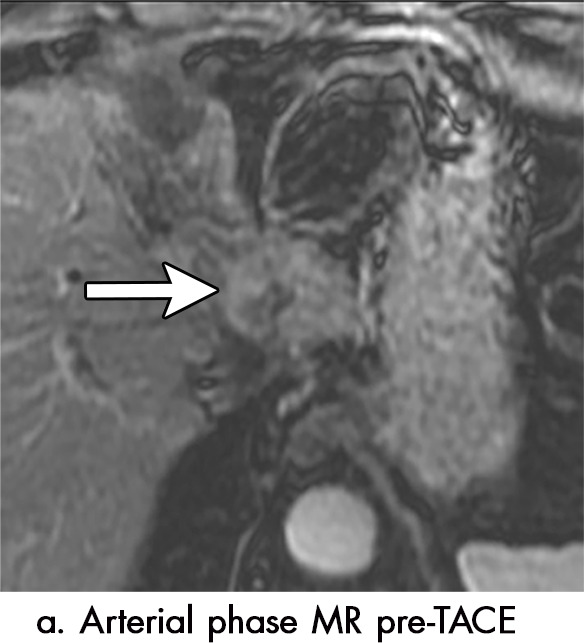
Imaging findings seen after transarterial chemoembolization (TACE) therapy with residual disease. Axial images from a 59-year-old woman with LR 5/OPTN 5B hepatocellular carcinoma (arrow). (a) A 3.8-cm arterial phase hyperenhancement hepatocellular carcinoma with washout (b) at pretreatment imaging. (c) Noncontrast CT image confirms ethiodized oil within the entire volume of tumor at immediate posttreatment imaging. (d) One month after TACE, the treatment cavity was unchanged in size, with loss of signal on the out-of-phase images, when compared with in-phase images (e). (f) Arterial phase postcontrast images 1 month after TACE demonstrate peripheral nodular enhancement, with washout (not shown), confirmed on subtraction images, with some central areas of necrosis (*), compatible with residual disease (mRECIST PR, LR-TR viable). LR = LI-RADS, mRECIST = modified Response Evaluation Criteria for Solid Tumors, OPTN = Organ Procurement and Transplantation Network, PR = partial response, PV = portal venous, TR = treatment response.
Figure 5b:
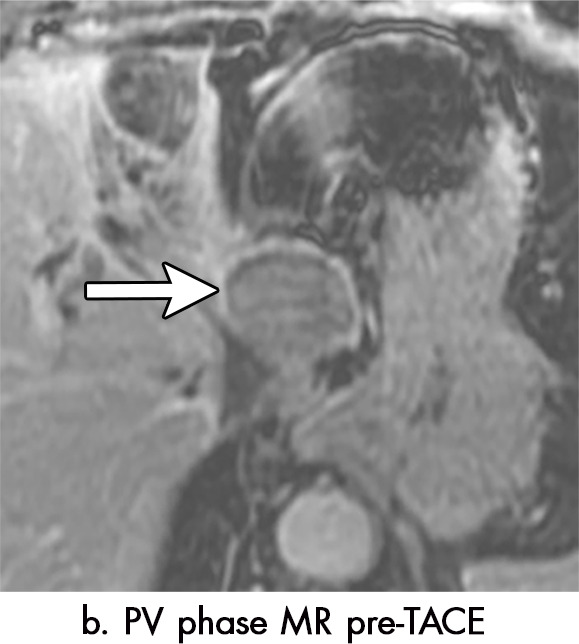
Imaging findings seen after transarterial chemoembolization (TACE) therapy with residual disease. Axial images from a 59-year-old woman with LR 5/OPTN 5B hepatocellular carcinoma (arrow). (a) A 3.8-cm arterial phase hyperenhancement hepatocellular carcinoma with washout (b) at pretreatment imaging. (c) Noncontrast CT image confirms ethiodized oil within the entire volume of tumor at immediate posttreatment imaging. (d) One month after TACE, the treatment cavity was unchanged in size, with loss of signal on the out-of-phase images, when compared with in-phase images (e). (f) Arterial phase postcontrast images 1 month after TACE demonstrate peripheral nodular enhancement, with washout (not shown), confirmed on subtraction images, with some central areas of necrosis (*), compatible with residual disease (mRECIST PR, LR-TR viable). LR = LI-RADS, mRECIST = modified Response Evaluation Criteria for Solid Tumors, OPTN = Organ Procurement and Transplantation Network, PR = partial response, PV = portal venous, TR = treatment response.
Figure 5c:
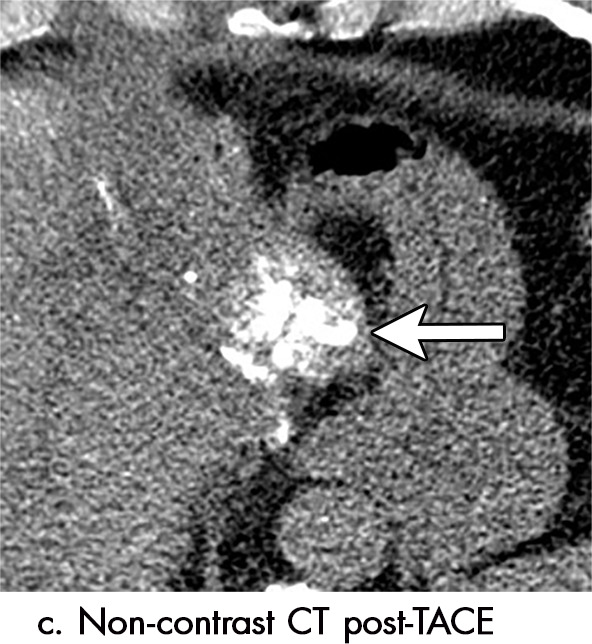
Imaging findings seen after transarterial chemoembolization (TACE) therapy with residual disease. Axial images from a 59-year-old woman with LR 5/OPTN 5B hepatocellular carcinoma (arrow). (a) A 3.8-cm arterial phase hyperenhancement hepatocellular carcinoma with washout (b) at pretreatment imaging. (c) Noncontrast CT image confirms ethiodized oil within the entire volume of tumor at immediate posttreatment imaging. (d) One month after TACE, the treatment cavity was unchanged in size, with loss of signal on the out-of-phase images, when compared with in-phase images (e). (f) Arterial phase postcontrast images 1 month after TACE demonstrate peripheral nodular enhancement, with washout (not shown), confirmed on subtraction images, with some central areas of necrosis (*), compatible with residual disease (mRECIST PR, LR-TR viable). LR = LI-RADS, mRECIST = modified Response Evaluation Criteria for Solid Tumors, OPTN = Organ Procurement and Transplantation Network, PR = partial response, PV = portal venous, TR = treatment response.
Figure 5d:
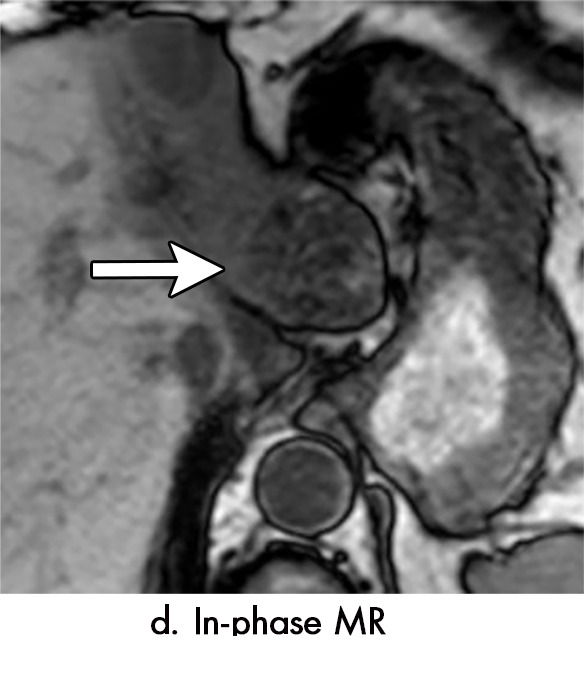
Imaging findings seen after transarterial chemoembolization (TACE) therapy with residual disease. Axial images from a 59-year-old woman with LR 5/OPTN 5B hepatocellular carcinoma (arrow). (a) A 3.8-cm arterial phase hyperenhancement hepatocellular carcinoma with washout (b) at pretreatment imaging. (c) Noncontrast CT image confirms ethiodized oil within the entire volume of tumor at immediate posttreatment imaging. (d) One month after TACE, the treatment cavity was unchanged in size, with loss of signal on the out-of-phase images, when compared with in-phase images (e). (f) Arterial phase postcontrast images 1 month after TACE demonstrate peripheral nodular enhancement, with washout (not shown), confirmed on subtraction images, with some central areas of necrosis (*), compatible with residual disease (mRECIST PR, LR-TR viable). LR = LI-RADS, mRECIST = modified Response Evaluation Criteria for Solid Tumors, OPTN = Organ Procurement and Transplantation Network, PR = partial response, PV = portal venous, TR = treatment response.
Figure 5e:
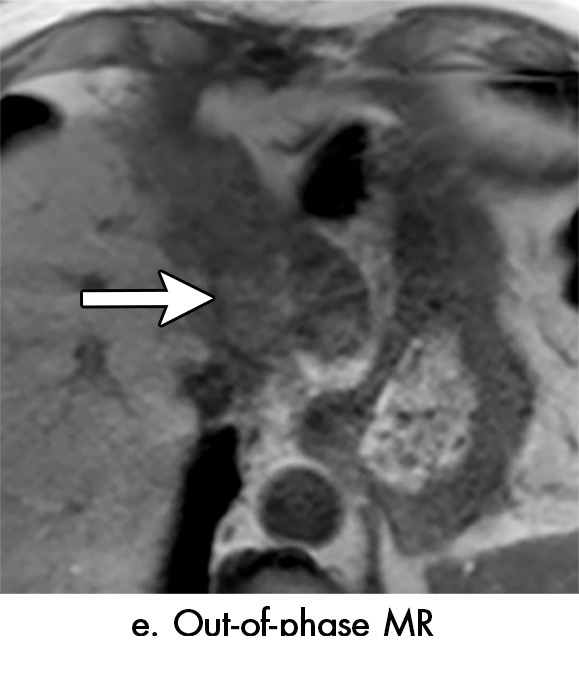
Imaging findings seen after transarterial chemoembolization (TACE) therapy with residual disease. Axial images from a 59-year-old woman with LR 5/OPTN 5B hepatocellular carcinoma (arrow). (a) A 3.8-cm arterial phase hyperenhancement hepatocellular carcinoma with washout (b) at pretreatment imaging. (c) Noncontrast CT image confirms ethiodized oil within the entire volume of tumor at immediate posttreatment imaging. (d) One month after TACE, the treatment cavity was unchanged in size, with loss of signal on the out-of-phase images, when compared with in-phase images (e). (f) Arterial phase postcontrast images 1 month after TACE demonstrate peripheral nodular enhancement, with washout (not shown), confirmed on subtraction images, with some central areas of necrosis (*), compatible with residual disease (mRECIST PR, LR-TR viable). LR = LI-RADS, mRECIST = modified Response Evaluation Criteria for Solid Tumors, OPTN = Organ Procurement and Transplantation Network, PR = partial response, PV = portal venous, TR = treatment response.
Figure 5f:
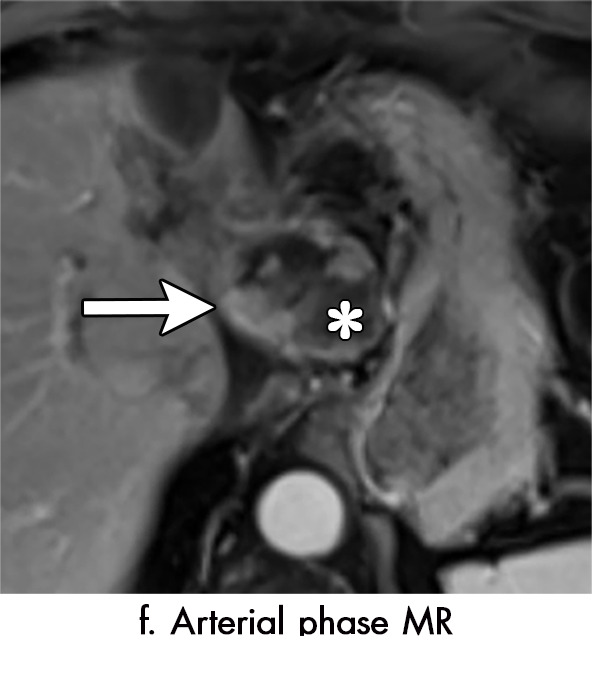
Imaging findings seen after transarterial chemoembolization (TACE) therapy with residual disease. Axial images from a 59-year-old woman with LR 5/OPTN 5B hepatocellular carcinoma (arrow). (a) A 3.8-cm arterial phase hyperenhancement hepatocellular carcinoma with washout (b) at pretreatment imaging. (c) Noncontrast CT image confirms ethiodized oil within the entire volume of tumor at immediate posttreatment imaging. (d) One month after TACE, the treatment cavity was unchanged in size, with loss of signal on the out-of-phase images, when compared with in-phase images (e). (f) Arterial phase postcontrast images 1 month after TACE demonstrate peripheral nodular enhancement, with washout (not shown), confirmed on subtraction images, with some central areas of necrosis (*), compatible with residual disease (mRECIST PR, LR-TR viable). LR = LI-RADS, mRECIST = modified Response Evaluation Criteria for Solid Tumors, OPTN = Organ Procurement and Transplantation Network, PR = partial response, PV = portal venous, TR = treatment response.
As with thermal ablation, there is commonly an inflammatory thin, smooth rim of arterial phase hyperenhancement surrounding an effectively treated tumor after TACE (33) (Fig 4). Unlike thermal ablation, this rim persists for a longer period of time and may be present for greater than 1 year. As with thermal ablation, the rim should be thin, continuous, and smooth (35). Any associated thickening or nodularity should raise suspicion for viable tumor.
Geographic regions of arterial phase hyperenhancement in the parenchyma surrounding a treated tumor are common immediately after TACE due to the embolic effect of treatment. These transient regions of altered perfusion are most pronounced in the arterial phase and correspond to the volume of treated liver. Lack of associated washout supports the diagnosis and helps differentiate the enhancement from viable tumor (29). Over time, these perfusional changes will regress; they typically resolve faster than the inflammatory rim surrounding the treated HCC.
Appearance of Viable Tumor
Recurrent or residual viable HCC at a site of prior TACE most often presents as an irregular, nodular region of arterial phase hyperenhancement within or surrounding a treated tumor with corresponding washout (Fig 5). However, as with recurrent tumor at thermal ablation zones, not all recurrent tumors show typical imaging characteristics; rarely, TACE-related changes in tumor perfusion may result in viable tumor that is isoenhancing or hypoenhancing in the arterial phase. When faced with findings equivocal for recurrent or viable tumor after TACE, short-term follow-up within 3 months is helpful for clarification; this allows for the identification of growing regions of arterial phase hyperenhancement or washout to confirm the presence of growing tumor. When there is recurrent tumor with an infiltrative growth pattern at a prior TACE site, the arterial phase hyperenhancement and washout associated with the tumor may be exceedingly subtle and not readily detectable with MRI. In such situations, the T2-weighted and diffusion-weighted sequences are helpful in the identification of local tumor progression with an infiltrative pattern.
Application of Tumor Response Criteria after Thermal Ablation, TACE, and Transarterial Embolization
After subjectively assessing the treated mass and adjacent parenchyma, tumor response should be determined. Unidimensional (mRECIST) or bidimensional (EASL) measurements of any suspicious enhancing observations should be reported. Complete response is documented by mRECIST or EASL when there is complete lack of tumor enhancement, which would be classified as “LR-TR nonviable” by the LI-RADS treatment response classification. The presence of peripheral nodular or irregular rim enhancement would be classified by mRECIST or EASL as partial response, stable disease, or progressive disease (depending on percentage of necrosis and a comparison to baseline or nadir imaging), and by LI-RADS criteria as “LR-TR viable.” If the suspicious enhancement is new or increasing, without additional major features such as washout, it would still be classified by mRECIST or EASL as partial response, stable disease or progressive disease (as above), or as “LR-TR equivocal” using LI-RADS nomenclature. Although none of the classification systems take into account washout or the appearance of the treatment zone on the T2-weighted, diffusion-weighted, or precontrast T1-weighted images when assessing tumor response, as the interpreting radiologist it is critical to identify areas of washout or growing regions of masslike signal abnormality, which frequently help to suggest the presence of residual or recurrent viable HCC.
Transarterial Radioembolization
TARE, also referred to as selective internal radiation or yttrium 90 (90Y) radioembolization, is an arterially directed catheter-based local-regional therapy that delivers targeted microspheres (glass or resin) coated with 90Y to treat HCC (36). 90Y is an unstable isotope with a short half-life of 2.67 days, during which time it releases a beta particle during its decay into a stable element, zirconium 90 (36). These high-energy beta particles induce destruction of the targeted tumor with a limited depth of penetration (2.6–11 mm), thus minimizing radiation exposure to adjacent uninvolved parenchyma and reducing the possibility of radiation-induced liver disease (37).
90Y microspheres are injected into the hepatic arteries and have a dual effect by both delivering targeted radiation and producing a small microembolic effect (38). The microspheres have a diameter of 20–60 µm and thus the embolic effect is less than that of conventional TACE; therefore, tumor necrosis related to TARE is largely radiation induced. This has a theoretical advantage in that benign or malignant portal venous thrombosis is not a contraindication to TARE (as it is for TACE) since the arterial flow to adjacent parenchyma is largely maintained (39).
Appearance of Nonviable Tumor
Unlike ablation and TACE, tumor necrosis and shrinkage after TARE is often delayed and slow, partially a result of the cytostatic effects of TARE (37,40). In fact, transient increases in tumor size from the treatment and immediate edema after TARE can persist for months after TARE. Therefore, size measurements prior to 3 months after treatment are not reliable for prediction of tumor response. Studies have shown that reduction in tumor size begins approximately 120 days after TARE (37,40,41), and cystic changes related to necrosis and hemorrhage can persist for months after treatment (42). Occasionally, a slight increase in size may be detected on the first examination after treatment that is not due to tumor growth after TARE, but rather tumor growth that occurred between the pretreatment examination and the start of treatment. Thus, when HCC size is assessed on the first MRI after TARE, one must take into account the length of time between the pretreatment MRI and the TARE procedure.
Enhancement after TARE is highly variable. Completely treated tumors will eventually become completely necrotic and nonenhancing. However, necrosis is not immediate, and in the first few months after treatment, persistent enhancement is common, even if the mass is completely treated (43). Thus, persistent tumor enhancement within the first 90 days after TARE treatment does not necessarily indicate incomplete treatment (40).
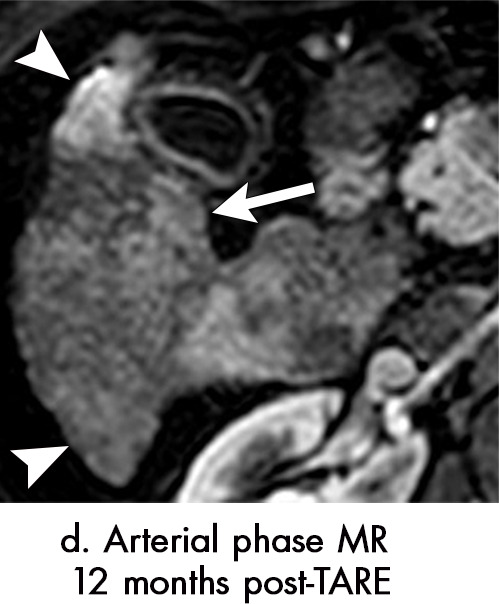
It is critical to be aware of different patterns of tumoral and peritumoral enhancement after TARE to not mistakenly suggest treatment failure. Typical enhancement patterns include: (a) intratumoral arterial hyperenhancement, (b) geographic or nodular peritumoral arterial hyperenhancement, (c) peritumoral thin ring enhancement, and (d) complete lack of enhancement (Figs 6, 7). Persistent central arterial hyperenhancement can be seen at 3 months in tumors that have been completely treated by TARE.
Figure 6a:
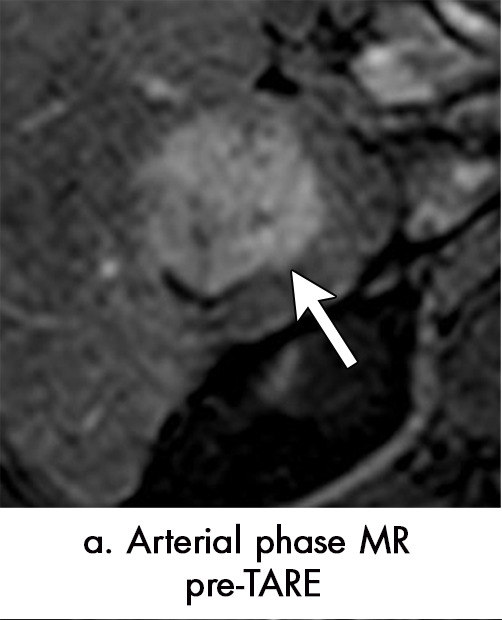
Persistent tumoral enhancement (diffuse central, nodular central, or peripheral) after transarterial radioembolization (TARE) in a 67-year-old man. (a) Axial arterial phase pretreatment MR image demonstrates a 7.2-cm LI-RADS 5/OPTN 5× hepatocellular carcinoma (arrow) with arterial phase hyperenhancement (APHE), “washout” and “capsule” (b). (c) Axial arterial phase MR image 3 months after TARE shows the tumor is unchanged in size with persistent diffuse central APHE, “washout” and “capsule” (d) (mRECIST SD, LR-TR equivocal vs nonviable). (e) Six months after TARE therapy, the tumor measures 3.3 cm with decreasing central enhancement and persistent peripheral nodular APHE, seen at arterial phase MRI, which persists at portal venous (PV) phase of imaging (f) (mRECIST PR, LR-TR nonviable). (g) Twelve months after TARE, the tumor continues to decrease in size, measuring 3.0 cm, with no residual tumoral enhancement, confirmed with subtraction imaging (mRECIST CR, LR-TR nonviable). CR = complete response, LR = LI-RADS, mRECIST = modified Response Evaluation Criteria for Solid Tumors, OPTN = Organ Procurement and Transplantation Network, SD = stable disease, TR = treatment response.
Figure 7a:
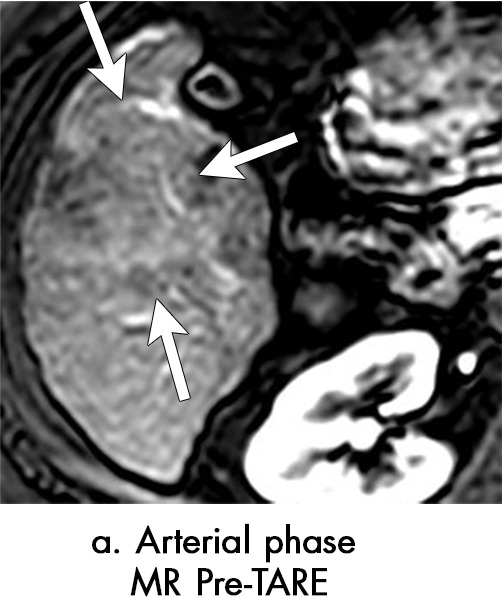
Axial MR images show various enhancement patterns after transarterial radioembolization (TARE) therapy in (a–d) a 56-year-old man, (e–f) an 82-year-old man, and (g–h) a 65-year-old woman. Geographic peritumoral arterial enhancement: (a) Pretreatment arterial phase MR image shows a 6.8-cm LI-RADS 5/OPTN 5× hepatocellular carcinoma (HCC). (b) Three months after TARE therapy, the tumor measured 7 cm with persistent central arterial phase hyperenhancement (mRECIST SD, LR-TR equivocal). (c) Six months after TARE therapy, the treated tumor was smaller with decreased central enhancement, but new peripheral geographic and nodular peritumoral hyperenhancement (arrowheads). These areas did not demonstrate washout on portal venous imaging (mRECIST PR, LR TR equivocal or nonviable). (d) Twelve months after TARE therapy, the tumor decreased in size with lack of central tumoral enhancement. There was persistent peripheral geographic and nodular peritumoral hyperenhancment, again without corresponding washout appearance. Note overlying hepatic capsular retraction, consistent with posttreatment parenchymal volume loss (mRECIST PR, LR-TR nonviable). Thin peritumoral ring of enhancement: (e) Pretreatment arterial phase MR image shows a 2.9-cm LI-RADS 5/OPTN 5b HCC. (f) Three months after TARE therapy there was a complete lack of central enhancement secondary to necrosis from 90Y therapy, with a smooth peritumoral ring of arterial enhancement (mRECIST PR, LR-TR nonviable). Complete nonenhancement: (g) Pretreatment arterial phase MR image shows a 6.2-cm LI-RADS 5/OPTN 5× HCC. (h) Three months after TARE therapy there was a decrease in size and central nonenhancement secondary to necrosis from 90Y therapy (mRECIST PR, LR TR nonviable). LR = LI-RADS, mRECIST = modified Response Evaluation Criteria for Solid Tumors, OPTN = Organ Procurement and Transplantation Network, PR = partial response, SD = stable disease, TR = treatment response.
Figure 6b:
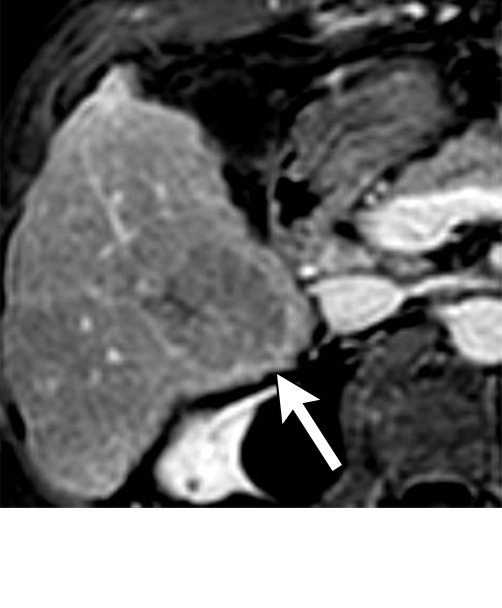
Persistent tumoral enhancement (diffuse central, nodular central, or peripheral) after transarterial radioembolization (TARE) in a 67-year-old man. (a) Axial arterial phase pretreatment MR image demonstrates a 7.2-cm LI-RADS 5/OPTN 5× hepatocellular carcinoma (arrow) with arterial phase hyperenhancement (APHE), “washout” and “capsule” (b). (c) Axial arterial phase MR image 3 months after TARE shows the tumor is unchanged in size with persistent diffuse central APHE, “washout” and “capsule” (d) (mRECIST SD, LR-TR equivocal vs nonviable). (e) Six months after TARE therapy, the tumor measures 3.3 cm with decreasing central enhancement and persistent peripheral nodular APHE, seen at arterial phase MRI, which persists at portal venous (PV) phase of imaging (f) (mRECIST PR, LR-TR nonviable). (g) Twelve months after TARE, the tumor continues to decrease in size, measuring 3.0 cm, with no residual tumoral enhancement, confirmed with subtraction imaging (mRECIST CR, LR-TR nonviable). CR = complete response, LR = LI-RADS, mRECIST = modified Response Evaluation Criteria for Solid Tumors, OPTN = Organ Procurement and Transplantation Network, SD = stable disease, TR = treatment response.
Figure 6c:
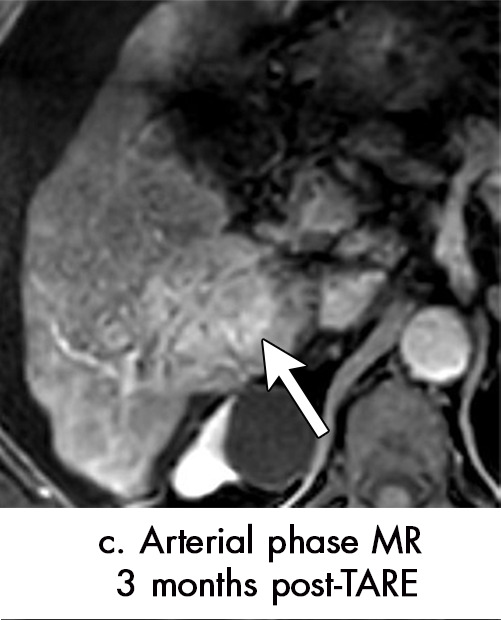
Persistent tumoral enhancement (diffuse central, nodular central, or peripheral) after transarterial radioembolization (TARE) in a 67-year-old man. (a) Axial arterial phase pretreatment MR image demonstrates a 7.2-cm LI-RADS 5/OPTN 5× hepatocellular carcinoma (arrow) with arterial phase hyperenhancement (APHE), “washout” and “capsule” (b). (c) Axial arterial phase MR image 3 months after TARE shows the tumor is unchanged in size with persistent diffuse central APHE, “washout” and “capsule” (d) (mRECIST SD, LR-TR equivocal vs nonviable). (e) Six months after TARE therapy, the tumor measures 3.3 cm with decreasing central enhancement and persistent peripheral nodular APHE, seen at arterial phase MRI, which persists at portal venous (PV) phase of imaging (f) (mRECIST PR, LR-TR nonviable). (g) Twelve months after TARE, the tumor continues to decrease in size, measuring 3.0 cm, with no residual tumoral enhancement, confirmed with subtraction imaging (mRECIST CR, LR-TR nonviable). CR = complete response, LR = LI-RADS, mRECIST = modified Response Evaluation Criteria for Solid Tumors, OPTN = Organ Procurement and Transplantation Network, SD = stable disease, TR = treatment response.
Figure 6d:
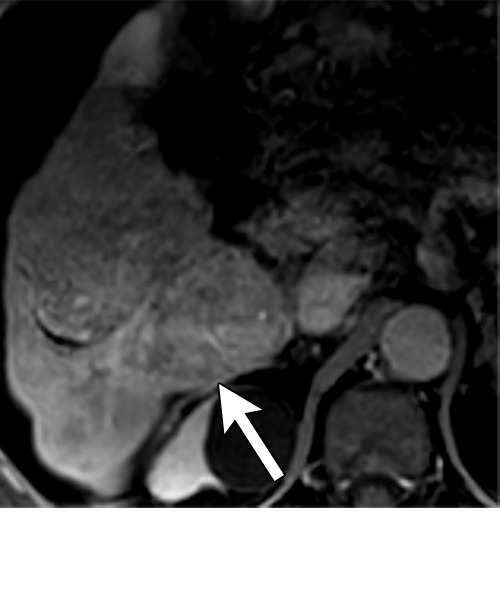
Persistent tumoral enhancement (diffuse central, nodular central, or peripheral) after transarterial radioembolization (TARE) in a 67-year-old man. (a) Axial arterial phase pretreatment MR image demonstrates a 7.2-cm LI-RADS 5/OPTN 5× hepatocellular carcinoma (arrow) with arterial phase hyperenhancement (APHE), “washout” and “capsule” (b). (c) Axial arterial phase MR image 3 months after TARE shows the tumor is unchanged in size with persistent diffuse central APHE, “washout” and “capsule” (d) (mRECIST SD, LR-TR equivocal vs nonviable). (e) Six months after TARE therapy, the tumor measures 3.3 cm with decreasing central enhancement and persistent peripheral nodular APHE, seen at arterial phase MRI, which persists at portal venous (PV) phase of imaging (f) (mRECIST PR, LR-TR nonviable). (g) Twelve months after TARE, the tumor continues to decrease in size, measuring 3.0 cm, with no residual tumoral enhancement, confirmed with subtraction imaging (mRECIST CR, LR-TR nonviable). CR = complete response, LR = LI-RADS, mRECIST = modified Response Evaluation Criteria for Solid Tumors, OPTN = Organ Procurement and Transplantation Network, SD = stable disease, TR = treatment response.
Figure 6e:
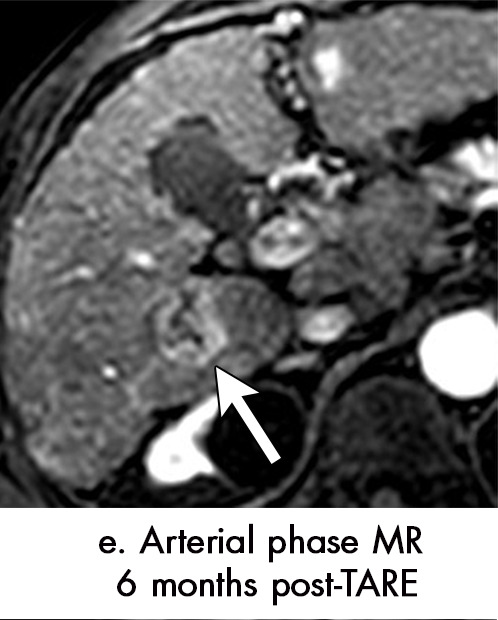
Persistent tumoral enhancement (diffuse central, nodular central, or peripheral) after transarterial radioembolization (TARE) in a 67-year-old man. (a) Axial arterial phase pretreatment MR image demonstrates a 7.2-cm LI-RADS 5/OPTN 5× hepatocellular carcinoma (arrow) with arterial phase hyperenhancement (APHE), “washout” and “capsule” (b). (c) Axial arterial phase MR image 3 months after TARE shows the tumor is unchanged in size with persistent diffuse central APHE, “washout” and “capsule” (d) (mRECIST SD, LR-TR equivocal vs nonviable). (e) Six months after TARE therapy, the tumor measures 3.3 cm with decreasing central enhancement and persistent peripheral nodular APHE, seen at arterial phase MRI, which persists at portal venous (PV) phase of imaging (f) (mRECIST PR, LR-TR nonviable). (g) Twelve months after TARE, the tumor continues to decrease in size, measuring 3.0 cm, with no residual tumoral enhancement, confirmed with subtraction imaging (mRECIST CR, LR-TR nonviable). CR = complete response, LR = LI-RADS, mRECIST = modified Response Evaluation Criteria for Solid Tumors, OPTN = Organ Procurement and Transplantation Network, SD = stable disease, TR = treatment response.
Figure 6f:
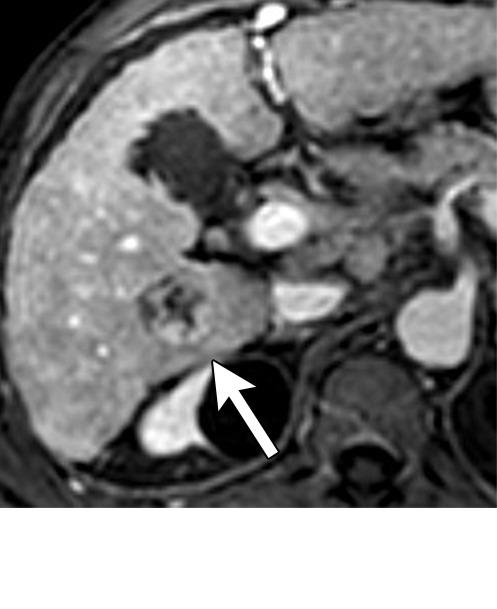
Persistent tumoral enhancement (diffuse central, nodular central, or peripheral) after transarterial radioembolization (TARE) in a 67-year-old man. (a) Axial arterial phase pretreatment MR image demonstrates a 7.2-cm LI-RADS 5/OPTN 5× hepatocellular carcinoma (arrow) with arterial phase hyperenhancement (APHE), “washout” and “capsule” (b). (c) Axial arterial phase MR image 3 months after TARE shows the tumor is unchanged in size with persistent diffuse central APHE, “washout” and “capsule” (d) (mRECIST SD, LR-TR equivocal vs nonviable). (e) Six months after TARE therapy, the tumor measures 3.3 cm with decreasing central enhancement and persistent peripheral nodular APHE, seen at arterial phase MRI, which persists at portal venous (PV) phase of imaging (f) (mRECIST PR, LR-TR nonviable). (g) Twelve months after TARE, the tumor continues to decrease in size, measuring 3.0 cm, with no residual tumoral enhancement, confirmed with subtraction imaging (mRECIST CR, LR-TR nonviable). CR = complete response, LR = LI-RADS, mRECIST = modified Response Evaluation Criteria for Solid Tumors, OPTN = Organ Procurement and Transplantation Network, SD = stable disease, TR = treatment response.
Figure 6g:
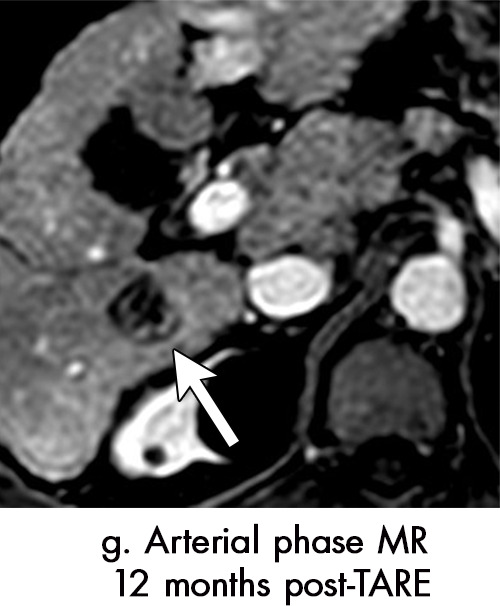
Persistent tumoral enhancement (diffuse central, nodular central, or peripheral) after transarterial radioembolization (TARE) in a 67-year-old man. (a) Axial arterial phase pretreatment MR image demonstrates a 7.2-cm LI-RADS 5/OPTN 5× hepatocellular carcinoma (arrow) with arterial phase hyperenhancement (APHE), “washout” and “capsule” (b). (c) Axial arterial phase MR image 3 months after TARE shows the tumor is unchanged in size with persistent diffuse central APHE, “washout” and “capsule” (d) (mRECIST SD, LR-TR equivocal vs nonviable). (e) Six months after TARE therapy, the tumor measures 3.3 cm with decreasing central enhancement and persistent peripheral nodular APHE, seen at arterial phase MRI, which persists at portal venous (PV) phase of imaging (f) (mRECIST PR, LR-TR nonviable). (g) Twelve months after TARE, the tumor continues to decrease in size, measuring 3.0 cm, with no residual tumoral enhancement, confirmed with subtraction imaging (mRECIST CR, LR-TR nonviable). CR = complete response, LR = LI-RADS, mRECIST = modified Response Evaluation Criteria for Solid Tumors, OPTN = Organ Procurement and Transplantation Network, SD = stable disease, TR = treatment response.
Figure 7b:
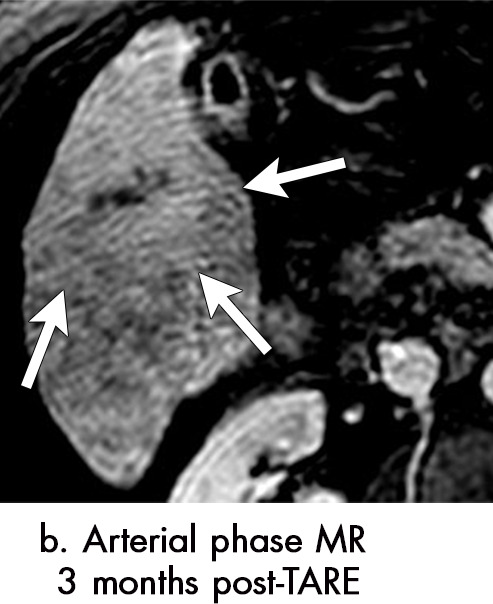
Axial MR images show various enhancement patterns after transarterial radioembolization (TARE) therapy in (a–d) a 56-year-old man, (e–f) an 82-year-old man, and (g–h) a 65-year-old woman. Geographic peritumoral arterial enhancement: (a) Pretreatment arterial phase MR image shows a 6.8-cm LI-RADS 5/OPTN 5× hepatocellular carcinoma (HCC). (b) Three months after TARE therapy, the tumor measured 7 cm with persistent central arterial phase hyperenhancement (mRECIST SD, LR-TR equivocal). (c) Six months after TARE therapy, the treated tumor was smaller with decreased central enhancement, but new peripheral geographic and nodular peritumoral hyperenhancement (arrowheads). These areas did not demonstrate washout on portal venous imaging (mRECIST PR, LR TR equivocal or nonviable). (d) Twelve months after TARE therapy, the tumor decreased in size with lack of central tumoral enhancement. There was persistent peripheral geographic and nodular peritumoral hyperenhancment, again without corresponding washout appearance. Note overlying hepatic capsular retraction, consistent with posttreatment parenchymal volume loss (mRECIST PR, LR-TR nonviable). Thin peritumoral ring of enhancement: (e) Pretreatment arterial phase MR image shows a 2.9-cm LI-RADS 5/OPTN 5b HCC. (f) Three months after TARE therapy there was a complete lack of central enhancement secondary to necrosis from 90Y therapy, with a smooth peritumoral ring of arterial enhancement (mRECIST PR, LR-TR nonviable). Complete nonenhancement: (g) Pretreatment arterial phase MR image shows a 6.2-cm LI-RADS 5/OPTN 5× HCC. (h) Three months after TARE therapy there was a decrease in size and central nonenhancement secondary to necrosis from 90Y therapy (mRECIST PR, LR TR nonviable). LR = LI-RADS, mRECIST = modified Response Evaluation Criteria for Solid Tumors, OPTN = Organ Procurement and Transplantation Network, PR = partial response, SD = stable disease, TR = treatment response.
Figure 7c:
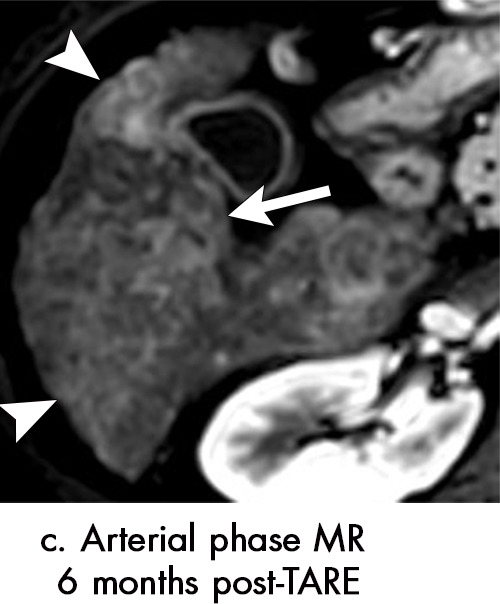
Axial MR images show various enhancement patterns after transarterial radioembolization (TARE) therapy in (a–d) a 56-year-old man, (e–f) an 82-year-old man, and (g–h) a 65-year-old woman. Geographic peritumoral arterial enhancement: (a) Pretreatment arterial phase MR image shows a 6.8-cm LI-RADS 5/OPTN 5× hepatocellular carcinoma (HCC). (b) Three months after TARE therapy, the tumor measured 7 cm with persistent central arterial phase hyperenhancement (mRECIST SD, LR-TR equivocal). (c) Six months after TARE therapy, the treated tumor was smaller with decreased central enhancement, but new peripheral geographic and nodular peritumoral hyperenhancement (arrowheads). These areas did not demonstrate washout on portal venous imaging (mRECIST PR, LR TR equivocal or nonviable). (d) Twelve months after TARE therapy, the tumor decreased in size with lack of central tumoral enhancement. There was persistent peripheral geographic and nodular peritumoral hyperenhancment, again without corresponding washout appearance. Note overlying hepatic capsular retraction, consistent with posttreatment parenchymal volume loss (mRECIST PR, LR-TR nonviable). Thin peritumoral ring of enhancement: (e) Pretreatment arterial phase MR image shows a 2.9-cm LI-RADS 5/OPTN 5b HCC. (f) Three months after TARE therapy there was a complete lack of central enhancement secondary to necrosis from 90Y therapy, with a smooth peritumoral ring of arterial enhancement (mRECIST PR, LR-TR nonviable). Complete nonenhancement: (g) Pretreatment arterial phase MR image shows a 6.2-cm LI-RADS 5/OPTN 5× HCC. (h) Three months after TARE therapy there was a decrease in size and central nonenhancement secondary to necrosis from 90Y therapy (mRECIST PR, LR TR nonviable). LR = LI-RADS, mRECIST = modified Response Evaluation Criteria for Solid Tumors, OPTN = Organ Procurement and Transplantation Network, PR = partial response, SD = stable disease, TR = treatment response.
Figure 7d:
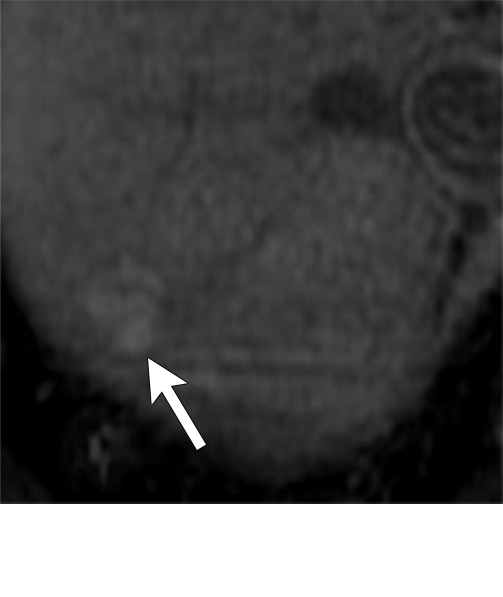
Axial MR images show various enhancement patterns after transarterial radioembolization (TARE) therapy in (a–d) a 56-year-old man, (e–f) an 82-year-old man, and (g–h) a 65-year-old woman. Geographic peritumoral arterial enhancement: (a) Pretreatment arterial phase MR image shows a 6.8-cm LI-RADS 5/OPTN 5× hepatocellular carcinoma (HCC). (b) Three months after TARE therapy, the tumor measured 7 cm with persistent central arterial phase hyperenhancement (mRECIST SD, LR-TR equivocal). (c) Six months after TARE therapy, the treated tumor was smaller with decreased central enhancement, but new peripheral geographic and nodular peritumoral hyperenhancement (arrowheads). These areas did not demonstrate washout on portal venous imaging (mRECIST PR, LR TR equivocal or nonviable). (d) Twelve months after TARE therapy, the tumor decreased in size with lack of central tumoral enhancement. There was persistent peripheral geographic and nodular peritumoral hyperenhancment, again without corresponding washout appearance. Note overlying hepatic capsular retraction, consistent with posttreatment parenchymal volume loss (mRECIST PR, LR-TR nonviable). Thin peritumoral ring of enhancement: (e) Pretreatment arterial phase MR image shows a 2.9-cm LI-RADS 5/OPTN 5b HCC. (f) Three months after TARE therapy there was a complete lack of central enhancement secondary to necrosis from 90Y therapy, with a smooth peritumoral ring of arterial enhancement (mRECIST PR, LR-TR nonviable). Complete nonenhancement: (g) Pretreatment arterial phase MR image shows a 6.2-cm LI-RADS 5/OPTN 5× HCC. (h) Three months after TARE therapy there was a decrease in size and central nonenhancement secondary to necrosis from 90Y therapy (mRECIST PR, LR TR nonviable). LR = LI-RADS, mRECIST = modified Response Evaluation Criteria for Solid Tumors, OPTN = Organ Procurement and Transplantation Network, PR = partial response, SD = stable disease, TR = treatment response.
Figure 7e:
Axial MR images show various enhancement patterns after transarterial radioembolization (TARE) therapy in (a–d) a 56-year-old man, (e–f) an 82-year-old man, and (g–h) a 65-year-old woman. Geographic peritumoral arterial enhancement: (a) Pretreatment arterial phase MR image shows a 6.8-cm LI-RADS 5/OPTN 5× hepatocellular carcinoma (HCC). (b) Three months after TARE therapy, the tumor measured 7 cm with persistent central arterial phase hyperenhancement (mRECIST SD, LR-TR equivocal). (c) Six months after TARE therapy, the treated tumor was smaller with decreased central enhancement, but new peripheral geographic and nodular peritumoral hyperenhancement (arrowheads). These areas did not demonstrate washout on portal venous imaging (mRECIST PR, LR TR equivocal or nonviable). (d) Twelve months after TARE therapy, the tumor decreased in size with lack of central tumoral enhancement. There was persistent peripheral geographic and nodular peritumoral hyperenhancment, again without corresponding washout appearance. Note overlying hepatic capsular retraction, consistent with posttreatment parenchymal volume loss (mRECIST PR, LR-TR nonviable). Thin peritumoral ring of enhancement: (e) Pretreatment arterial phase MR image shows a 2.9-cm LI-RADS 5/OPTN 5b HCC. (f) Three months after TARE therapy there was a complete lack of central enhancement secondary to necrosis from 90Y therapy, with a smooth peritumoral ring of arterial enhancement (mRECIST PR, LR-TR nonviable). Complete nonenhancement: (g) Pretreatment arterial phase MR image shows a 6.2-cm LI-RADS 5/OPTN 5× HCC. (h) Three months after TARE therapy there was a decrease in size and central nonenhancement secondary to necrosis from 90Y therapy (mRECIST PR, LR TR nonviable). LR = LI-RADS, mRECIST = modified Response Evaluation Criteria for Solid Tumors, OPTN = Organ Procurement and Transplantation Network, PR = partial response, SD = stable disease, TR = treatment response.
Figure 7f:
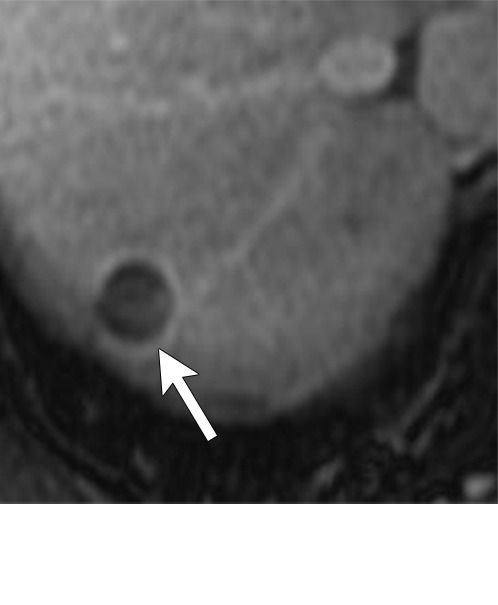
Axial MR images show various enhancement patterns after transarterial radioembolization (TARE) therapy in (a–d) a 56-year-old man, (e–f) an 82-year-old man, and (g–h) a 65-year-old woman. Geographic peritumoral arterial enhancement: (a) Pretreatment arterial phase MR image shows a 6.8-cm LI-RADS 5/OPTN 5× hepatocellular carcinoma (HCC). (b) Three months after TARE therapy, the tumor measured 7 cm with persistent central arterial phase hyperenhancement (mRECIST SD, LR-TR equivocal). (c) Six months after TARE therapy, the treated tumor was smaller with decreased central enhancement, but new peripheral geographic and nodular peritumoral hyperenhancement (arrowheads). These areas did not demonstrate washout on portal venous imaging (mRECIST PR, LR TR equivocal or nonviable). (d) Twelve months after TARE therapy, the tumor decreased in size with lack of central tumoral enhancement. There was persistent peripheral geographic and nodular peritumoral hyperenhancment, again without corresponding washout appearance. Note overlying hepatic capsular retraction, consistent with posttreatment parenchymal volume loss (mRECIST PR, LR-TR nonviable). Thin peritumoral ring of enhancement: (e) Pretreatment arterial phase MR image shows a 2.9-cm LI-RADS 5/OPTN 5b HCC. (f) Three months after TARE therapy there was a complete lack of central enhancement secondary to necrosis from 90Y therapy, with a smooth peritumoral ring of arterial enhancement (mRECIST PR, LR-TR nonviable). Complete nonenhancement: (g) Pretreatment arterial phase MR image shows a 6.2-cm LI-RADS 5/OPTN 5× HCC. (h) Three months after TARE therapy there was a decrease in size and central nonenhancement secondary to necrosis from 90Y therapy (mRECIST PR, LR TR nonviable). LR = LI-RADS, mRECIST = modified Response Evaluation Criteria for Solid Tumors, OPTN = Organ Procurement and Transplantation Network, PR = partial response, SD = stable disease, TR = treatment response.
Figure 7g:
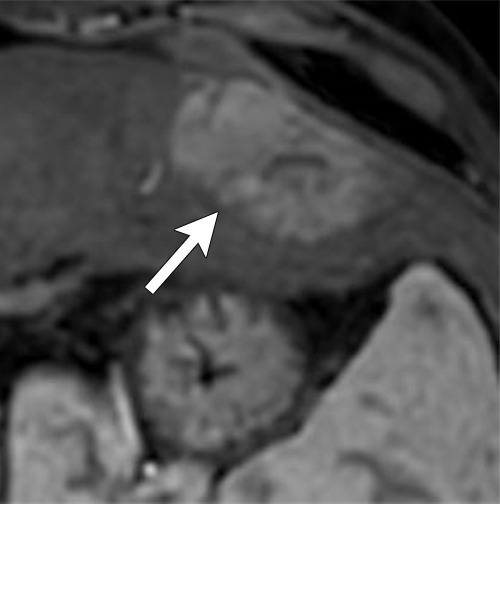
Axial MR images show various enhancement patterns after transarterial radioembolization (TARE) therapy in (a–d) a 56-year-old man, (e–f) an 82-year-old man, and (g–h) a 65-year-old woman. Geographic peritumoral arterial enhancement: (a) Pretreatment arterial phase MR image shows a 6.8-cm LI-RADS 5/OPTN 5× hepatocellular carcinoma (HCC). (b) Three months after TARE therapy, the tumor measured 7 cm with persistent central arterial phase hyperenhancement (mRECIST SD, LR-TR equivocal). (c) Six months after TARE therapy, the treated tumor was smaller with decreased central enhancement, but new peripheral geographic and nodular peritumoral hyperenhancement (arrowheads). These areas did not demonstrate washout on portal venous imaging (mRECIST PR, LR TR equivocal or nonviable). (d) Twelve months after TARE therapy, the tumor decreased in size with lack of central tumoral enhancement. There was persistent peripheral geographic and nodular peritumoral hyperenhancment, again without corresponding washout appearance. Note overlying hepatic capsular retraction, consistent with posttreatment parenchymal volume loss (mRECIST PR, LR-TR nonviable). Thin peritumoral ring of enhancement: (e) Pretreatment arterial phase MR image shows a 2.9-cm LI-RADS 5/OPTN 5b HCC. (f) Three months after TARE therapy there was a complete lack of central enhancement secondary to necrosis from 90Y therapy, with a smooth peritumoral ring of arterial enhancement (mRECIST PR, LR-TR nonviable). Complete nonenhancement: (g) Pretreatment arterial phase MR image shows a 6.2-cm LI-RADS 5/OPTN 5× HCC. (h) Three months after TARE therapy there was a decrease in size and central nonenhancement secondary to necrosis from 90Y therapy (mRECIST PR, LR TR nonviable). LR = LI-RADS, mRECIST = modified Response Evaluation Criteria for Solid Tumors, OPTN = Organ Procurement and Transplantation Network, PR = partial response, SD = stable disease, TR = treatment response.
Figure 7h:
Axial MR images show various enhancement patterns after transarterial radioembolization (TARE) therapy in (a–d) a 56-year-old man, (e–f) an 82-year-old man, and (g–h) a 65-year-old woman. Geographic peritumoral arterial enhancement: (a) Pretreatment arterial phase MR image shows a 6.8-cm LI-RADS 5/OPTN 5× hepatocellular carcinoma (HCC). (b) Three months after TARE therapy, the tumor measured 7 cm with persistent central arterial phase hyperenhancement (mRECIST SD, LR-TR equivocal). (c) Six months after TARE therapy, the treated tumor was smaller with decreased central enhancement, but new peripheral geographic and nodular peritumoral hyperenhancement (arrowheads). These areas did not demonstrate washout on portal venous imaging (mRECIST PR, LR TR equivocal or nonviable). (d) Twelve months after TARE therapy, the tumor decreased in size with lack of central tumoral enhancement. There was persistent peripheral geographic and nodular peritumoral hyperenhancment, again without corresponding washout appearance. Note overlying hepatic capsular retraction, consistent with posttreatment parenchymal volume loss (mRECIST PR, LR-TR nonviable). Thin peritumoral ring of enhancement: (e) Pretreatment arterial phase MR image shows a 2.9-cm LI-RADS 5/OPTN 5b HCC. (f) Three months after TARE therapy there was a complete lack of central enhancement secondary to necrosis from 90Y therapy, with a smooth peritumoral ring of arterial enhancement (mRECIST PR, LR-TR nonviable). Complete nonenhancement: (g) Pretreatment arterial phase MR image shows a 6.2-cm LI-RADS 5/OPTN 5× HCC. (h) Three months after TARE therapy there was a decrease in size and central nonenhancement secondary to necrosis from 90Y therapy (mRECIST PR, LR TR nonviable). LR = LI-RADS, mRECIST = modified Response Evaluation Criteria for Solid Tumors, OPTN = Organ Procurement and Transplantation Network, PR = partial response, SD = stable disease, TR = treatment response.
Intratumoral enhancement may be diffuse or nodular (Fig 6) (5,44), with or without persistent washout or capsule. The diffuse or nodular enhancement may be central or peripheral within the treated tumor. Studies have shown that complete tumor necrosis may occur in a very delayed fashion, taking up to 1 year to occur (44). When there is persistent intratumoral arterial phase hyperenhancement after TARE, mass size is an important factor in judging treatment response. A diagnosis of viable tumor should not be made solely on the presence of persistent arterial phase hyperenhancement; instead, temporal change in size becomes the primary determinant of treatment response. Three months after TARE treatment, a successfully treated HCC should serially decrease in size over time, although it can sometimes be unchanged in size for up to 6 months after treatment. Persistent arterial phase hyperenhancement within a shrinking HCC should be interpreted as an expected finding after TARE and should not be interpreted as persistent viable tumor.
Geographic peritumoral parenchymal arterial phase hyperenhancement is seen in up to 94% of patients after 90Y therapy, typically within the arterial distribution targeted by TARE (Fig 7) (5,45). This pattern of enhancement after TARE is believed to multifactorial. Edema from the microembolic effect of the microspheres within the peritumoral vascular plexus results in perfusional alterations throughout the treated liver volume (37). Additionally, radiation therapy–related veno-occlusion results in additional perfusional changes which may be long-lasting (37). These multifactorial perfusional alterations, which are most clearly appreciated in the arterial phase, are most pronounced directly after treatment. They tend to resolve within 6 months but may persist even longer. In some cases, they never fully resolve. It is important that these regions of perfusional change not be mistaken for infiltrative tumor; lack of washout and absence of masslike T2-weighted or diffusion-weighted signal abnormality are helpful in differentiating benign post-TARE parenchymal enhancement from infiltrative HCC. Over time, fibrosis may develop in the treatment zone, resulting in progressive volume loss and capsular retraction corresponding to the initial sites of radiation-related perfusional change (Fig 7).
Peritumoral thin ring enhancement without asymmetry, nodularity, or masslike morphology is a benign finding related to inflammation or parenchymal fibrosis (Fig 7) (45). Ring enhancement can persist for months after TARE and should be thin (< 3 mm) and smooth. Asymmetry, nodularity, or masslike morphology of the ring enhancement may indicate viable tumor, especially if it is not decreasing in size over time. Complete nonenhancement of the treated HCC indicates complete tumor necrosis. This finding is easy to interpret but is rarely present at immediate postprocedural imaging (Fig 7).
TARE-related complications that can be diagnosed at imaging include biliary necrosis (secondary to microspheres embedded in peribiliary capillary plexuses), radiation-induced cholecystitis, abscess, radiation-induced liver disease resulting in fibrosis, liver volume loss, diminished liver function, ascites, and off-target radioembolization (40).
Appearance of Viable Tumor
The key imaging feature that suggests residual or recurrent tumor after TARE is new or enlarging nodular or masslike arterial phase hyperenhancement within or around the treated tumor (Table). Growth over time is a key indicator. Care should be taken not to mistake TARE-related peritumoral perfusional change with viable tumor. As stated above, the presence of arterial phase hyperenhancement with corresponding washout, capsule, or ancillary signal abnormalities (eg, T2 weighted, diffusion weighted) can be helpful in making this distinction (Fig 8). Occasionally recurrent tumor may appear as heterogeneous hypoenhancing masslike area within or along the treated tumor, in which case ancillary signal abnormalities can be helpful. Correlation with α-fetoprotein, if initially elevated in the pretreatment period, may also be helpful. If there is minimal decrease or unexpected increase in α-fetoprotein after TARE, progressive HCC is likely present in or outside the treatment zone, regardless of what the imaging findings show. If unsure whether a region of arterial phase hyperenhancement reflects tumor or perfusional change after TARE, repeat evaluation in 3 months can be performed for further clarification.
Summary of Key Imaging Features after Local-Regional Therapy for HCC
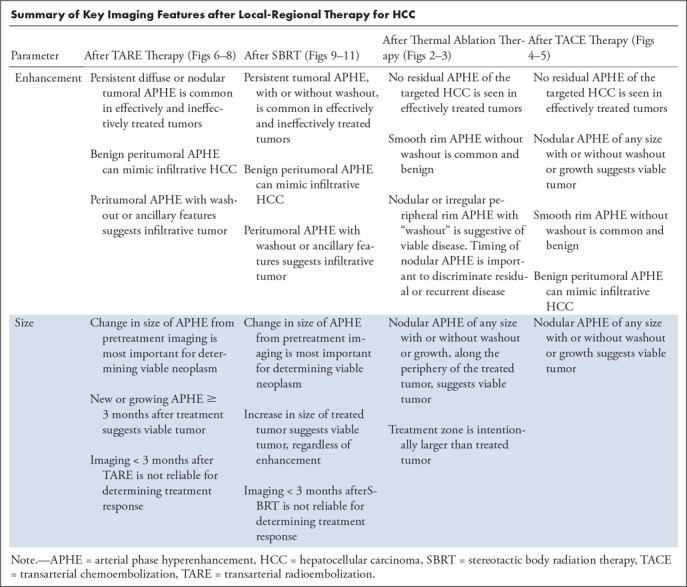
Figure 8a:
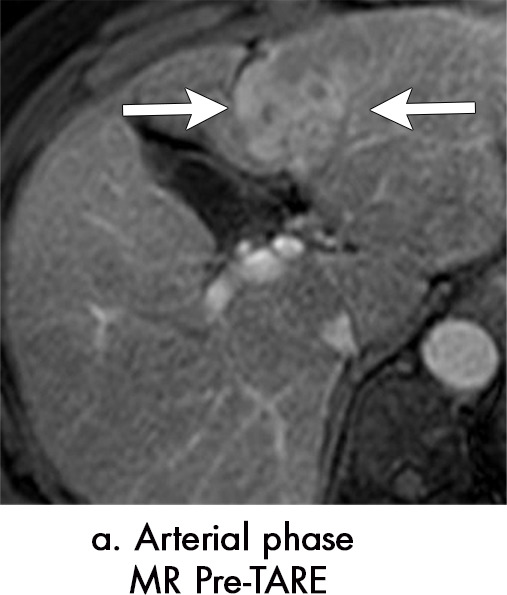
Equivocal and recurrent disease after transarterial radioembolization (TARE) in a 62-year-old woman. (a) Pretreatment axial arterial phase MR image shows a 4.8-cm LI-RADS 5/OPTN 5B hepatocellular carcinoma (HCC) (arrow) with arterial phase hyperenhancement (APHE) and washout (b). (c) Three months after TARE, the tumor is overall smaller in size with a 2.2-cm area of persistent APHE within the treated tumor (arrow), which demonstrates persistent delayed phase enhancement (arrow in d) (mRECIST PR, LR TR equivocal). (e) Five months after TARE, the tumor continues to regress in size, with the previously seen nodular arterial enhancing area measuring 1.6 cm (arrow), but with new “washout” (arrow in f) (mRECIST PR, LR TR equivocal). (g) Eight months after TARE, the treatment cavity itself is unchanged in size; however, there is now an increasing size of the enhancing tumor, measuring 2.6 cm (arrow), with “washout” (arrow) compatible with recurrent HCC (mRECIST PD, LR TR viable). An additional new area of the tumor is seen (arrowhead). LR = LI-RADS, mRECIST = modified Response Evaluation Criteria for Solid Tumors, OPTN = Organ Procurement and Transplantation Network, PD = progressive disease, PV = portal venous, TR = treatment response.
Figure 8b:
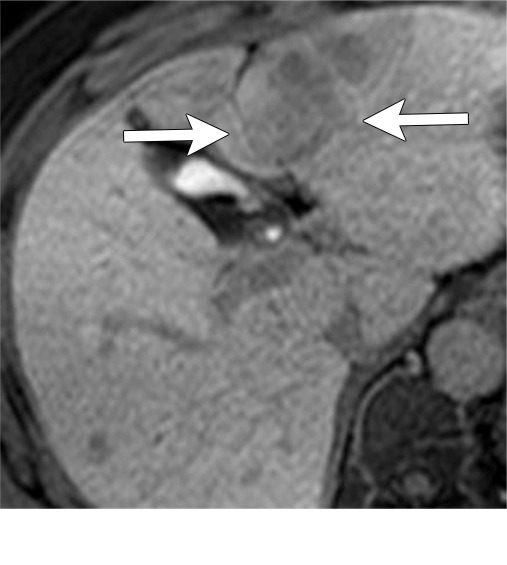
Equivocal and recurrent disease after transarterial radioembolization (TARE) in a 62-year-old woman. (a) Pretreatment axial arterial phase MR image shows a 4.8-cm LI-RADS 5/OPTN 5B hepatocellular carcinoma (HCC) (arrow) with arterial phase hyperenhancement (APHE) and washout (b). (c) Three months after TARE, the tumor is overall smaller in size with a 2.2-cm area of persistent APHE within the treated tumor (arrow), which demonstrates persistent delayed phase enhancement (arrow in d) (mRECIST PR, LR TR equivocal). (e) Five months after TARE, the tumor continues to regress in size, with the previously seen nodular arterial enhancing area measuring 1.6 cm (arrow), but with new “washout” (arrow in f) (mRECIST PR, LR TR equivocal). (g) Eight months after TARE, the treatment cavity itself is unchanged in size; however, there is now an increasing size of the enhancing tumor, measuring 2.6 cm (arrow), with “washout” (arrow) compatible with recurrent HCC (mRECIST PD, LR TR viable). An additional new area of the tumor is seen (arrowhead). LR = LI-RADS, mRECIST = modified Response Evaluation Criteria for Solid Tumors, OPTN = Organ Procurement and Transplantation Network, PD = progressive disease, PV = portal venous, TR = treatment response.
Figure 8c:
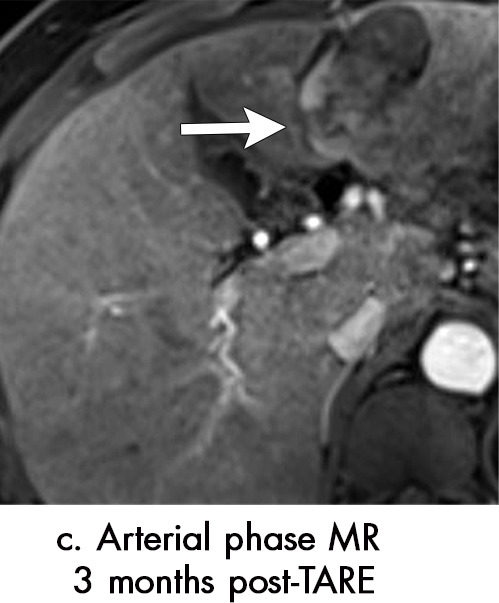
Equivocal and recurrent disease after transarterial radioembolization (TARE) in a 62-year-old woman. (a) Pretreatment axial arterial phase MR image shows a 4.8-cm LI-RADS 5/OPTN 5B hepatocellular carcinoma (HCC) (arrow) with arterial phase hyperenhancement (APHE) and washout (b). (c) Three months after TARE, the tumor is overall smaller in size with a 2.2-cm area of persistent APHE within the treated tumor (arrow), which demonstrates persistent delayed phase enhancement (arrow in d) (mRECIST PR, LR TR equivocal). (e) Five months after TARE, the tumor continues to regress in size, with the previously seen nodular arterial enhancing area measuring 1.6 cm (arrow), but with new “washout” (arrow in f) (mRECIST PR, LR TR equivocal). (g) Eight months after TARE, the treatment cavity itself is unchanged in size; however, there is now an increasing size of the enhancing tumor, measuring 2.6 cm (arrow), with “washout” (arrow) compatible with recurrent HCC (mRECIST PD, LR TR viable). An additional new area of the tumor is seen (arrowhead). LR = LI-RADS, mRECIST = modified Response Evaluation Criteria for Solid Tumors, OPTN = Organ Procurement and Transplantation Network, PD = progressive disease, PV = portal venous, TR = treatment response.
Figure 8d:
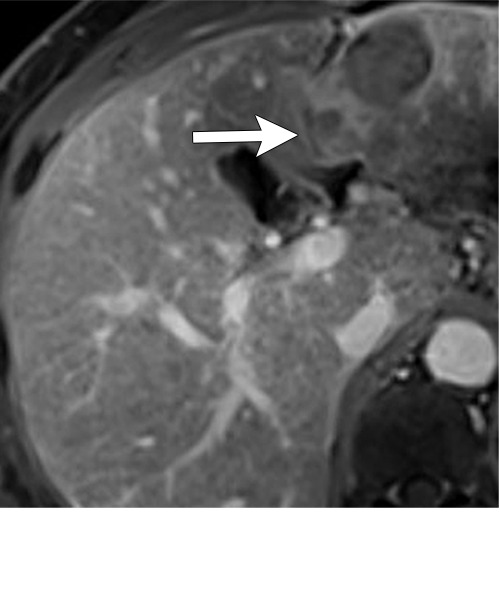
Equivocal and recurrent disease after transarterial radioembolization (TARE) in a 62-year-old woman. (a) Pretreatment axial arterial phase MR image shows a 4.8-cm LI-RADS 5/OPTN 5B hepatocellular carcinoma (HCC) (arrow) with arterial phase hyperenhancement (APHE) and washout (b). (c) Three months after TARE, the tumor is overall smaller in size with a 2.2-cm area of persistent APHE within the treated tumor (arrow), which demonstrates persistent delayed phase enhancement (arrow in d) (mRECIST PR, LR TR equivocal). (e) Five months after TARE, the tumor continues to regress in size, with the previously seen nodular arterial enhancing area measuring 1.6 cm (arrow), but with new “washout” (arrow in f) (mRECIST PR, LR TR equivocal). (g) Eight months after TARE, the treatment cavity itself is unchanged in size; however, there is now an increasing size of the enhancing tumor, measuring 2.6 cm (arrow), with “washout” (arrow) compatible with recurrent HCC (mRECIST PD, LR TR viable). An additional new area of the tumor is seen (arrowhead). LR = LI-RADS, mRECIST = modified Response Evaluation Criteria for Solid Tumors, OPTN = Organ Procurement and Transplantation Network, PD = progressive disease, PV = portal venous, TR = treatment response.
Figure 8e:
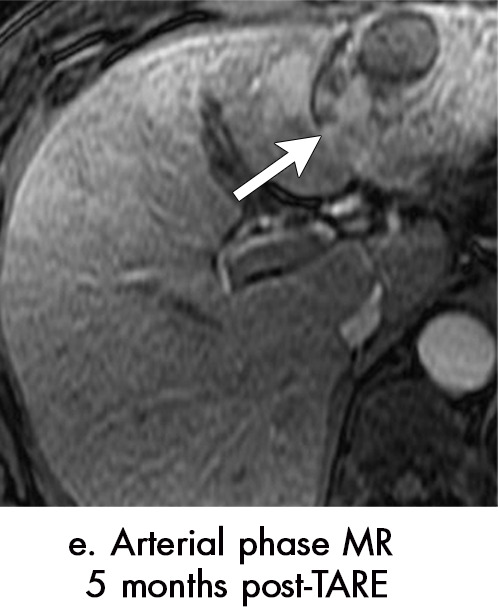
Equivocal and recurrent disease after transarterial radioembolization (TARE) in a 62-year-old woman. (a) Pretreatment axial arterial phase MR image shows a 4.8-cm LI-RADS 5/OPTN 5B hepatocellular carcinoma (HCC) (arrow) with arterial phase hyperenhancement (APHE) and washout (b). (c) Three months after TARE, the tumor is overall smaller in size with a 2.2-cm area of persistent APHE within the treated tumor (arrow), which demonstrates persistent delayed phase enhancement (arrow in d) (mRECIST PR, LR TR equivocal). (e) Five months after TARE, the tumor continues to regress in size, with the previously seen nodular arterial enhancing area measuring 1.6 cm (arrow), but with new “washout” (arrow in f) (mRECIST PR, LR TR equivocal). (g) Eight months after TARE, the treatment cavity itself is unchanged in size; however, there is now an increasing size of the enhancing tumor, measuring 2.6 cm (arrow), with “washout” (arrow) compatible with recurrent HCC (mRECIST PD, LR TR viable). An additional new area of the tumor is seen (arrowhead). LR = LI-RADS, mRECIST = modified Response Evaluation Criteria for Solid Tumors, OPTN = Organ Procurement and Transplantation Network, PD = progressive disease, PV = portal venous, TR = treatment response.
Figure 8f:
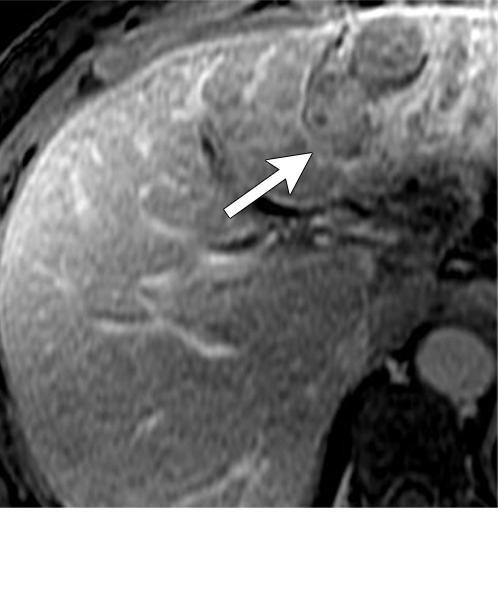
Equivocal and recurrent disease after transarterial radioembolization (TARE) in a 62-year-old woman. (a) Pretreatment axial arterial phase MR image shows a 4.8-cm LI-RADS 5/OPTN 5B hepatocellular carcinoma (HCC) (arrow) with arterial phase hyperenhancement (APHE) and washout (b). (c) Three months after TARE, the tumor is overall smaller in size with a 2.2-cm area of persistent APHE within the treated tumor (arrow), which demonstrates persistent delayed phase enhancement (arrow in d) (mRECIST PR, LR TR equivocal). (e) Five months after TARE, the tumor continues to regress in size, with the previously seen nodular arterial enhancing area measuring 1.6 cm (arrow), but with new “washout” (arrow in f) (mRECIST PR, LR TR equivocal). (g) Eight months after TARE, the treatment cavity itself is unchanged in size; however, there is now an increasing size of the enhancing tumor, measuring 2.6 cm (arrow), with “washout” (arrow) compatible with recurrent HCC (mRECIST PD, LR TR viable). An additional new area of the tumor is seen (arrowhead). LR = LI-RADS, mRECIST = modified Response Evaluation Criteria for Solid Tumors, OPTN = Organ Procurement and Transplantation Network, PD = progressive disease, PV = portal venous, TR = treatment response.
Figure 8g:
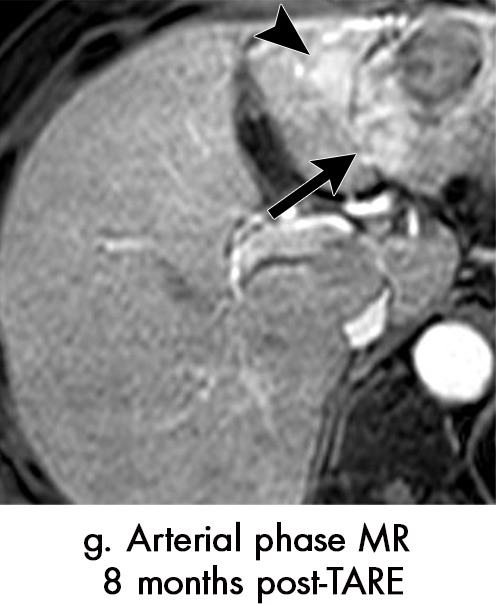
Equivocal and recurrent disease after transarterial radioembolization (TARE) in a 62-year-old woman. (a) Pretreatment axial arterial phase MR image shows a 4.8-cm LI-RADS 5/OPTN 5B hepatocellular carcinoma (HCC) (arrow) with arterial phase hyperenhancement (APHE) and washout (b). (c) Three months after TARE, the tumor is overall smaller in size with a 2.2-cm area of persistent APHE within the treated tumor (arrow), which demonstrates persistent delayed phase enhancement (arrow in d) (mRECIST PR, LR TR equivocal). (e) Five months after TARE, the tumor continues to regress in size, with the previously seen nodular arterial enhancing area measuring 1.6 cm (arrow), but with new “washout” (arrow in f) (mRECIST PR, LR TR equivocal). (g) Eight months after TARE, the treatment cavity itself is unchanged in size; however, there is now an increasing size of the enhancing tumor, measuring 2.6 cm (arrow), with “washout” (arrow) compatible with recurrent HCC (mRECIST PD, LR TR viable). An additional new area of the tumor is seen (arrowhead). LR = LI-RADS, mRECIST = modified Response Evaluation Criteria for Solid Tumors, OPTN = Organ Procurement and Transplantation Network, PD = progressive disease, PV = portal venous, TR = treatment response.
Figure 8h:
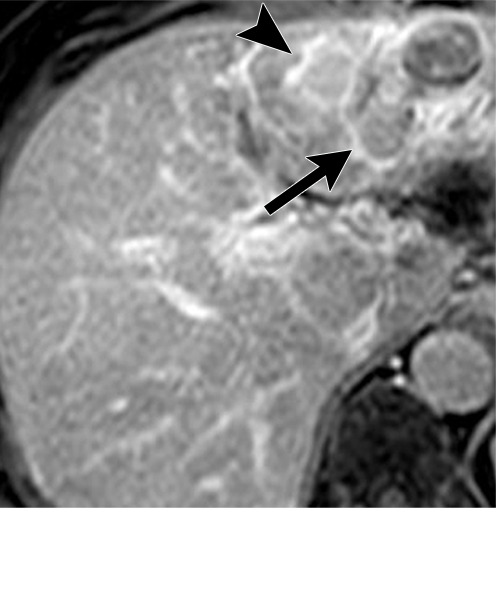
Equivocal and recurrent disease after transarterial radioembolization (TARE) in a 62-year-old woman. (a) Pretreatment axial arterial phase MR image shows a 4.8-cm LI-RADS 5/OPTN 5B hepatocellular carcinoma (HCC) (arrow) with arterial phase hyperenhancement (APHE) and washout (b). (c) Three months after TARE, the tumor is overall smaller in size with a 2.2-cm area of persistent APHE within the treated tumor (arrow), which demonstrates persistent delayed phase enhancement (arrow in d) (mRECIST PR, LR TR equivocal). (e) Five months after TARE, the tumor continues to regress in size, with the previously seen nodular arterial enhancing area measuring 1.6 cm (arrow), but with new “washout” (arrow in f) (mRECIST PR, LR TR equivocal). (g) Eight months after TARE, the treatment cavity itself is unchanged in size; however, there is now an increasing size of the enhancing tumor, measuring 2.6 cm (arrow), with “washout” (arrow) compatible with recurrent HCC (mRECIST PD, LR TR viable). An additional new area of the tumor is seen (arrowhead). LR = LI-RADS, mRECIST = modified Response Evaluation Criteria for Solid Tumors, OPTN = Organ Procurement and Transplantation Network, PD = progressive disease, PV = portal venous, TR = treatment response.
Application of Treatment Response Criteria after TARE
Because solid arterial phase hyperenhancement is a common and expected early imaging finding after TARE, strict application of the mRECIST and EASL criteria may result in misinterpretation of appropriately treated HCC as viable tumor. In contradistinction to mRECIST and EASL, LI-RADS considers “treatment-specific expected enhancement pattern” as “LR-TR nonviable” and “enhancement pattern atypical for treatment-specific enhancement” as “LR-TR equivocal.” Because solid arterial phase hyperenhancement can be seen in both viable and appropriately treated HCC in the early phases after TARE, it can be interpreted as LR-TR equivocal or LR-TR nonviable; further clarification may be obtained at follow-up imaging by interval size change of the treated tumor. If the arterial phase hyperenhancement continues to decrease in size on subsequent imaging examinations, it can be classified as “LR-TR nonviable.” The presence or absence of ancillary features such as restricted diffusion or T2 hyperintense signal are also helpful. If, however, the observation continues to enlarge on subsequent imaging, it should be classified as “LR-TR viable.” Importantly, the presence of nodular or masslike arterial phase hyperenhancement should not be misinterpreted as viable tumor or classified as “LR-TR viable” on the first post-TARE imaging study; temporal change will be required to clarify the presence or absence of tumor at follow-up imaging.
Stereotactic Body Radiation Therapy
SBRT uses multiple tightly focused beams of radiation to treat HCC. The geometry enables higher radiation dose delivery to tumor with less dose to adjacent parenchyma in fewer fractions than traditional external beam techniques. This maximizes oncologic efficacy and minimizes risk of radiation-induced liver disease (46). Liver SBRT is noninvasive, but requires careful preplanning and contouring of target volumes, usually with a combination of four-dimensional CT and MRI. A gross tumor volume is created based on the size of the primary tumor. A clinical target volume is the gross tumor volume plus a surrounding margin of normal tissue, usually 0.3–0.8 cm, to incorporate potential subclinical disease. The internal target volume incorporates all the clinical target volumes from the different respiratory phases, thus accounting for tumor excursion. The internal target volume is used for treatment planning and is equivalent to the planning target volume (47,48). Radiation doses can vary, reported at 24–60 Gy dose in 3–10 fractions, depending on tumor size and location (49).
Appearance of Nonviable Tumor
Most HCCs effectively treated with SBRT exhibit a slow decrease in size and enhancement. Due to the slow change over time, a measurable change in size between adjacent examinations is not always appreciable (50) (Figs 9–11). Occasionally, a slight increase in size may be detected on the first posttreatment examination that is not due to tumor growth after SBRT, but rather tumor growth that occurred between the pretreatment examination and the start of treatment. Thus, when HCC size is assessed at the first post-SBRT MRI, one must take into account the length of time between the preradiation MRI and the start of SBRT.
Figure 9a:
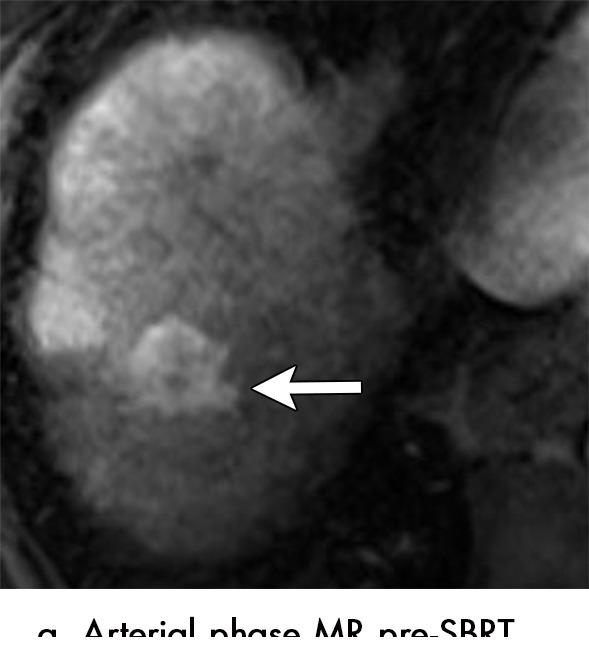
Imaging findings after stereotactic body radiation therapy in a 56-year-old woman. (a) Pretreatment axial MR image shows a 3.4-cm LR-5/OPTN 5B hepatocellular carcinoma (HCC) (arrow) in segment 7 of liver with arterial phase hyperenhancement (APHE) and “washout” (b). (c) Three months after SBRT, the treated HCC measures 3.2 cm and no longer demonstrates APHE, confirmed with subtraction images (not shown) (mRECIST CR, LR-TR nonviable). CR = complete response, LR = LI-RADS, mRECIST = modified Response Evaluation Criteria for Solid Tumors, OPTN = Organ Procurement and Transplantation Network, PV = portal venous, SBRT = stereotactic body radiation therapy, TR = treatment response.
Figure 11a:
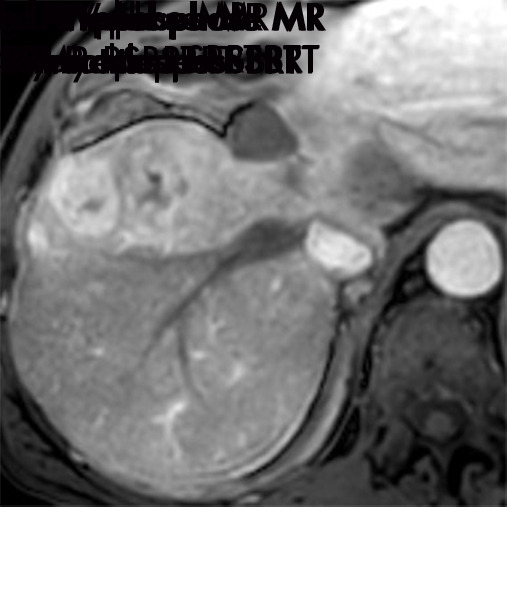
Evolution of imaging findings after stereotactic body radiation therapy (SBRT) with recurrent disease in a 65-year-old woman with hepatocellular carcinoma (HCC) (arrow). (a) Pretreatment MR image shows a 5.4-cm LR-5/OPTN 5× HCC in segment 8 of liver with arterial phase hyperenhancement (APHE), “washout”and “capsule” (b). (c) Three months after SBRT, the treated HCC measures 2.6 cm with persistent APHE and “washout” (d) (mRECIST PR, LR-TR nonviable). (e) Nine months after SBRT, the treated HCC measures 1.3 cm with persistent but decreased intensity of APHE and “washout” (f) (mRECIST PR, LR-TR nonviable). (g) One year after SBRT, the treated tumor begins to increase in size, now measuring 4.8 cm with increased intensity of APHE, “washout” and “capsule” (h). These findings are compatible with local tumor progression and biopsy proven (mRECIST PD, LR-TR viable). (c, e) Evolution of radiation changes in the surrounding parenchyma shows early geographic arterial phase enhancement. (f) Over time, there is conversion to delayed phase geographic parenchymal enhancement and progressive volume loss along the surface of the liver, secondary to fibtrosis. LR = LI-RADS, mRECIST = modified Response Evaluation Criteria for Solid Tumors, OPTN = Organ Procurement and Transplantation Network, PD = progressive disease, PR = partial response, SBRT = stereotactic body radiation therapy, TR = treatment response.
Figure 9b:
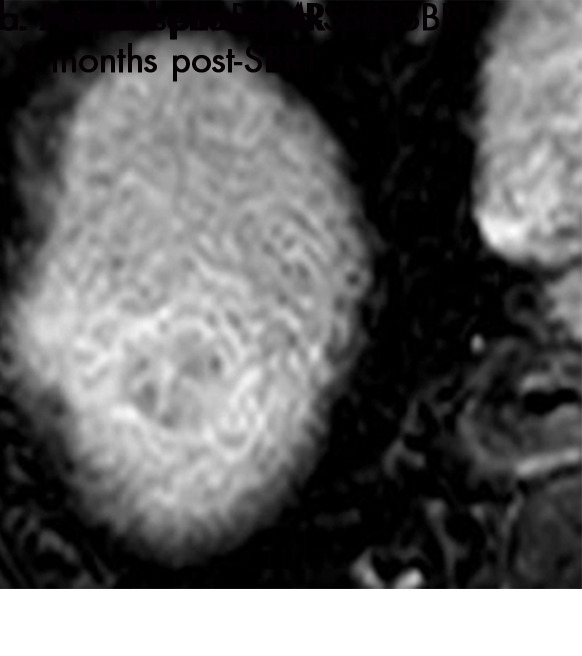
Imaging findings after stereotactic body radiation therapy in a 56-year-old woman. (a) Pretreatment axial MR image shows a 3.4-cm LR-5/OPTN 5B hepatocellular carcinoma (HCC) (arrow) in segment 7 of liver with arterial phase hyperenhancement (APHE) and “washout” (b). (c) Three months after SBRT, the treated HCC measures 3.2 cm and no longer demonstrates APHE, confirmed with subtraction images (not shown) (mRECIST CR, LR-TR nonviable). CR = complete response, LR = LI-RADS, mRECIST = modified Response Evaluation Criteria for Solid Tumors, OPTN = Organ Procurement and Transplantation Network, PV = portal venous, SBRT = stereotactic body radiation therapy, TR = treatment response.
Figure 9c:
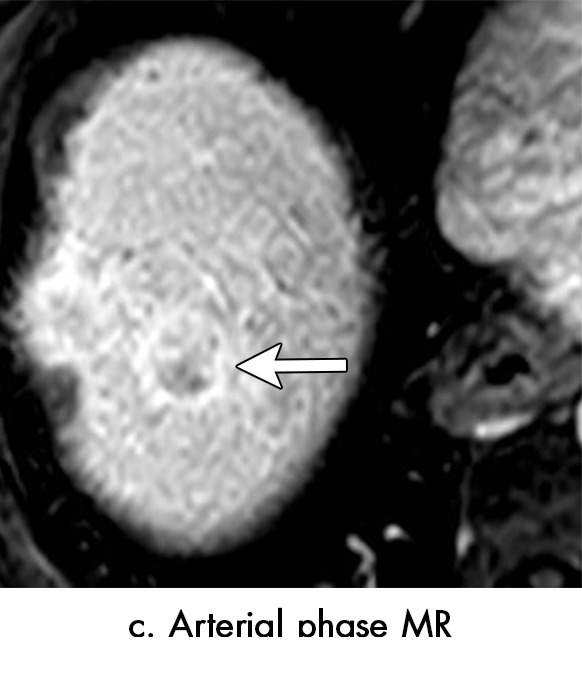
Imaging findings after stereotactic body radiation therapy in a 56-year-old woman. (a) Pretreatment axial MR image shows a 3.4-cm LR-5/OPTN 5B hepatocellular carcinoma (HCC) (arrow) in segment 7 of liver with arterial phase hyperenhancement (APHE) and “washout” (b). (c) Three months after SBRT, the treated HCC measures 3.2 cm and no longer demonstrates APHE, confirmed with subtraction images (not shown) (mRECIST CR, LR-TR nonviable). CR = complete response, LR = LI-RADS, mRECIST = modified Response Evaluation Criteria for Solid Tumors, OPTN = Organ Procurement and Transplantation Network, PV = portal venous, SBRT = stereotactic body radiation therapy, TR = treatment response.
Figure 10b:
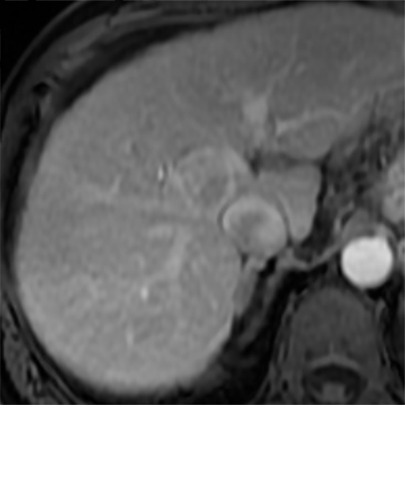
Imaging findings after stereotactic body radiation therapy. Axial images from a 59-year-old man with hepatocellular carcinoma (HCC) (arrow). (a) Pretreatment MR image demonstrates a 2.9-cm LR-5/OPTN 5B HCC in segment 8 of liver with arterial phase hyperenhancement (APHE), “washout” and “capsule” (b). (c) Three months after SBRT, the treated HCC measures 2.4 cm with persistent APHE and “washout” (d) (mRECIST SD, LR TR nonviable). (e) Six months after SBRT, the treated lesion measures 1.3 cm with persistent APHE and “washout” (f) (mRECIST PR, LR-TR nonviable). (g) One year after SBRT, the treated tumor measures 0.8 cm with persistent APHE and “washout” (h) (mRECIST PR, LR-TR nonviable). (i, j) Two years after SBRT the tumor is no longer seen (mRECIST CR, LR-TR nonviable). The surrounding parenchyma undergoes an evolution of radiation changes with early geographic arterial phase enhancement which normalized at portal venous (PV) phase of imaging. Over time, there is conversion to delayed phase geographic parenchymal enhancement, and progressive volume loss along the surface of the liver, secondary to fibrosis. CR = complete response, LR = LI-RADS, mRECIST = modified Response Evaluation Criteria for Solid Tumors, OPTN = Organ Procurement and Transplantation Network, PR = partial response, SBRT = stereotactic body radiation therapy, SD = stable disease, TR = treatment response.
Figure 10c:
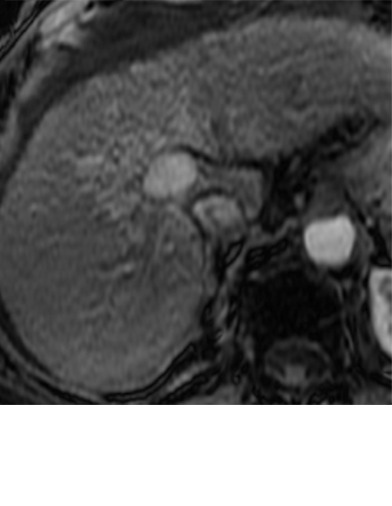
Imaging findings after stereotactic body radiation therapy. Axial images from a 59-year-old man with hepatocellular carcinoma (HCC) (arrow). (a) Pretreatment MR image demonstrates a 2.9-cm LR-5/OPTN 5B HCC in segment 8 of liver with arterial phase hyperenhancement (APHE), “washout” and “capsule” (b). (c) Three months after SBRT, the treated HCC measures 2.4 cm with persistent APHE and “washout” (d) (mRECIST SD, LR TR nonviable). (e) Six months after SBRT, the treated lesion measures 1.3 cm with persistent APHE and “washout” (f) (mRECIST PR, LR-TR nonviable). (g) One year after SBRT, the treated tumor measures 0.8 cm with persistent APHE and “washout” (h) (mRECIST PR, LR-TR nonviable). (i, j) Two years after SBRT the tumor is no longer seen (mRECIST CR, LR-TR nonviable). The surrounding parenchyma undergoes an evolution of radiation changes with early geographic arterial phase enhancement which normalized at portal venous (PV) phase of imaging. Over time, there is conversion to delayed phase geographic parenchymal enhancement, and progressive volume loss along the surface of the liver, secondary to fibrosis. CR = complete response, LR = LI-RADS, mRECIST = modified Response Evaluation Criteria for Solid Tumors, OPTN = Organ Procurement and Transplantation Network, PR = partial response, SBRT = stereotactic body radiation therapy, SD = stable disease, TR = treatment response.
Figure 10d:
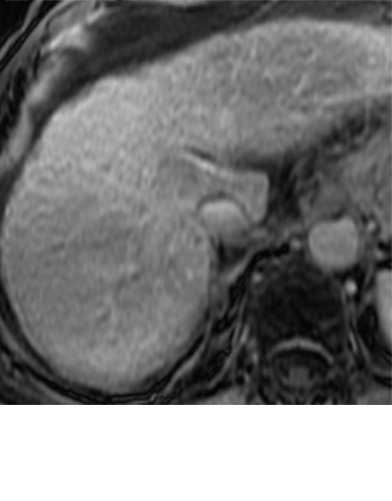
Imaging findings after stereotactic body radiation therapy. Axial images from a 59-year-old man with hepatocellular carcinoma (HCC) (arrow). (a) Pretreatment MR image demonstrates a 2.9-cm LR-5/OPTN 5B HCC in segment 8 of liver with arterial phase hyperenhancement (APHE), “washout” and “capsule” (b). (c) Three months after SBRT, the treated HCC measures 2.4 cm with persistent APHE and “washout” (d) (mRECIST SD, LR TR nonviable). (e) Six months after SBRT, the treated lesion measures 1.3 cm with persistent APHE and “washout” (f) (mRECIST PR, LR-TR nonviable). (g) One year after SBRT, the treated tumor measures 0.8 cm with persistent APHE and “washout” (h) (mRECIST PR, LR-TR nonviable). (i, j) Two years after SBRT the tumor is no longer seen (mRECIST CR, LR-TR nonviable). The surrounding parenchyma undergoes an evolution of radiation changes with early geographic arterial phase enhancement which normalized at portal venous (PV) phase of imaging. Over time, there is conversion to delayed phase geographic parenchymal enhancement, and progressive volume loss along the surface of the liver, secondary to fibrosis. CR = complete response, LR = LI-RADS, mRECIST = modified Response Evaluation Criteria for Solid Tumors, OPTN = Organ Procurement and Transplantation Network, PR = partial response, SBRT = stereotactic body radiation therapy, SD = stable disease, TR = treatment response.
Figure 10e:
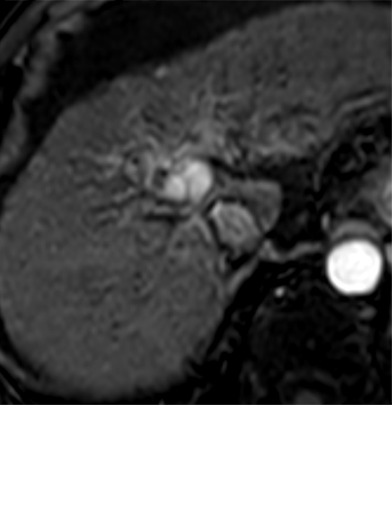
Imaging findings after stereotactic body radiation therapy. Axial images from a 59-year-old man with hepatocellular carcinoma (HCC) (arrow). (a) Pretreatment MR image demonstrates a 2.9-cm LR-5/OPTN 5B HCC in segment 8 of liver with arterial phase hyperenhancement (APHE), “washout” and “capsule” (b). (c) Three months after SBRT, the treated HCC measures 2.4 cm with persistent APHE and “washout” (d) (mRECIST SD, LR TR nonviable). (e) Six months after SBRT, the treated lesion measures 1.3 cm with persistent APHE and “washout” (f) (mRECIST PR, LR-TR nonviable). (g) One year after SBRT, the treated tumor measures 0.8 cm with persistent APHE and “washout” (h) (mRECIST PR, LR-TR nonviable). (i, j) Two years after SBRT the tumor is no longer seen (mRECIST CR, LR-TR nonviable). The surrounding parenchyma undergoes an evolution of radiation changes with early geographic arterial phase enhancement which normalized at portal venous (PV) phase of imaging. Over time, there is conversion to delayed phase geographic parenchymal enhancement, and progressive volume loss along the surface of the liver, secondary to fibrosis. CR = complete response, LR = LI-RADS, mRECIST = modified Response Evaluation Criteria for Solid Tumors, OPTN = Organ Procurement and Transplantation Network, PR = partial response, SBRT = stereotactic body radiation therapy, SD = stable disease, TR = treatment response.
Figure 10f:
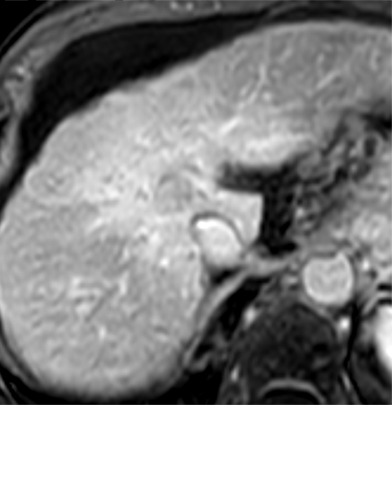
Imaging findings after stereotactic body radiation therapy. Axial images from a 59-year-old man with hepatocellular carcinoma (HCC) (arrow). (a) Pretreatment MR image demonstrates a 2.9-cm LR-5/OPTN 5B HCC in segment 8 of liver with arterial phase hyperenhancement (APHE), “washout” and “capsule” (b). (c) Three months after SBRT, the treated HCC measures 2.4 cm with persistent APHE and “washout” (d) (mRECIST SD, LR TR nonviable). (e) Six months after SBRT, the treated lesion measures 1.3 cm with persistent APHE and “washout” (f) (mRECIST PR, LR-TR nonviable). (g) One year after SBRT, the treated tumor measures 0.8 cm with persistent APHE and “washout” (h) (mRECIST PR, LR-TR nonviable). (i, j) Two years after SBRT the tumor is no longer seen (mRECIST CR, LR-TR nonviable). The surrounding parenchyma undergoes an evolution of radiation changes with early geographic arterial phase enhancement which normalized at portal venous (PV) phase of imaging. Over time, there is conversion to delayed phase geographic parenchymal enhancement, and progressive volume loss along the surface of the liver, secondary to fibrosis. CR = complete response, LR = LI-RADS, mRECIST = modified Response Evaluation Criteria for Solid Tumors, OPTN = Organ Procurement and Transplantation Network, PR = partial response, SBRT = stereotactic body radiation therapy, SD = stable disease, TR = treatment response.
Figure 10g:
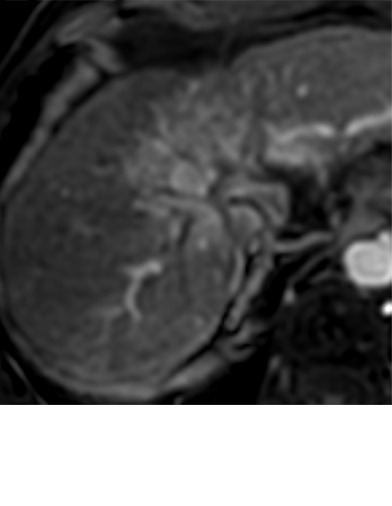
Imaging findings after stereotactic body radiation therapy. Axial images from a 59-year-old man with hepatocellular carcinoma (HCC) (arrow). (a) Pretreatment MR image demonstrates a 2.9-cm LR-5/OPTN 5B HCC in segment 8 of liver with arterial phase hyperenhancement (APHE), “washout” and “capsule” (b). (c) Three months after SBRT, the treated HCC measures 2.4 cm with persistent APHE and “washout” (d) (mRECIST SD, LR TR nonviable). (e) Six months after SBRT, the treated lesion measures 1.3 cm with persistent APHE and “washout” (f) (mRECIST PR, LR-TR nonviable). (g) One year after SBRT, the treated tumor measures 0.8 cm with persistent APHE and “washout” (h) (mRECIST PR, LR-TR nonviable). (i, j) Two years after SBRT the tumor is no longer seen (mRECIST CR, LR-TR nonviable). The surrounding parenchyma undergoes an evolution of radiation changes with early geographic arterial phase enhancement which normalized at portal venous (PV) phase of imaging. Over time, there is conversion to delayed phase geographic parenchymal enhancement, and progressive volume loss along the surface of the liver, secondary to fibrosis. CR = complete response, LR = LI-RADS, mRECIST = modified Response Evaluation Criteria for Solid Tumors, OPTN = Organ Procurement and Transplantation Network, PR = partial response, SBRT = stereotactic body radiation therapy, SD = stable disease, TR = treatment response.
Figure 10h:
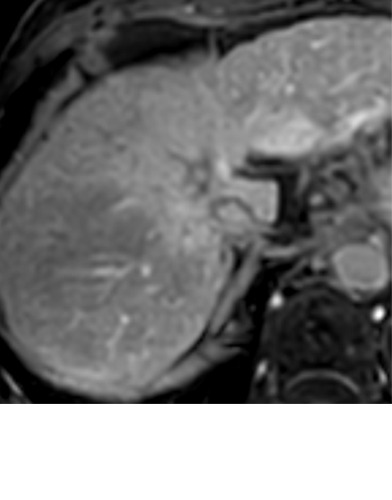
Imaging findings after stereotactic body radiation therapy. Axial images from a 59-year-old man with hepatocellular carcinoma (HCC) (arrow). (a) Pretreatment MR image demonstrates a 2.9-cm LR-5/OPTN 5B HCC in segment 8 of liver with arterial phase hyperenhancement (APHE), “washout” and “capsule” (b). (c) Three months after SBRT, the treated HCC measures 2.4 cm with persistent APHE and “washout” (d) (mRECIST SD, LR TR nonviable). (e) Six months after SBRT, the treated lesion measures 1.3 cm with persistent APHE and “washout” (f) (mRECIST PR, LR-TR nonviable). (g) One year after SBRT, the treated tumor measures 0.8 cm with persistent APHE and “washout” (h) (mRECIST PR, LR-TR nonviable). (i, j) Two years after SBRT the tumor is no longer seen (mRECIST CR, LR-TR nonviable). The surrounding parenchyma undergoes an evolution of radiation changes with early geographic arterial phase enhancement which normalized at portal venous (PV) phase of imaging. Over time, there is conversion to delayed phase geographic parenchymal enhancement, and progressive volume loss along the surface of the liver, secondary to fibrosis. CR = complete response, LR = LI-RADS, mRECIST = modified Response Evaluation Criteria for Solid Tumors, OPTN = Organ Procurement and Transplantation Network, PR = partial response, SBRT = stereotactic body radiation therapy, SD = stable disease, TR = treatment response.
Figure 10i:
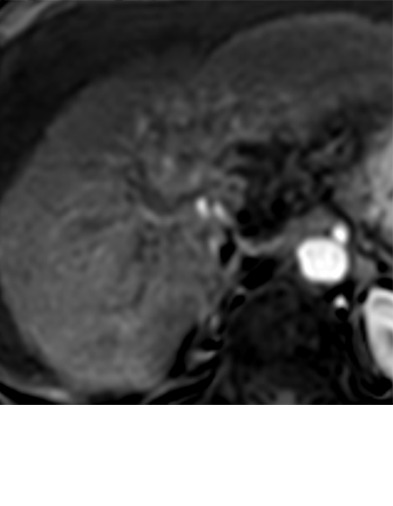
Imaging findings after stereotactic body radiation therapy. Axial images from a 59-year-old man with hepatocellular carcinoma (HCC) (arrow). (a) Pretreatment MR image demonstrates a 2.9-cm LR-5/OPTN 5B HCC in segment 8 of liver with arterial phase hyperenhancement (APHE), “washout” and “capsule” (b). (c) Three months after SBRT, the treated HCC measures 2.4 cm with persistent APHE and “washout” (d) (mRECIST SD, LR TR nonviable). (e) Six months after SBRT, the treated lesion measures 1.3 cm with persistent APHE and “washout” (f) (mRECIST PR, LR-TR nonviable). (g) One year after SBRT, the treated tumor measures 0.8 cm with persistent APHE and “washout” (h) (mRECIST PR, LR-TR nonviable). (i, j) Two years after SBRT the tumor is no longer seen (mRECIST CR, LR-TR nonviable). The surrounding parenchyma undergoes an evolution of radiation changes with early geographic arterial phase enhancement which normalized at portal venous (PV) phase of imaging. Over time, there is conversion to delayed phase geographic parenchymal enhancement, and progressive volume loss along the surface of the liver, secondary to fibrosis. CR = complete response, LR = LI-RADS, mRECIST = modified Response Evaluation Criteria for Solid Tumors, OPTN = Organ Procurement and Transplantation Network, PR = partial response, SBRT = stereotactic body radiation therapy, SD = stable disease, TR = treatment response.
Figure 10j:
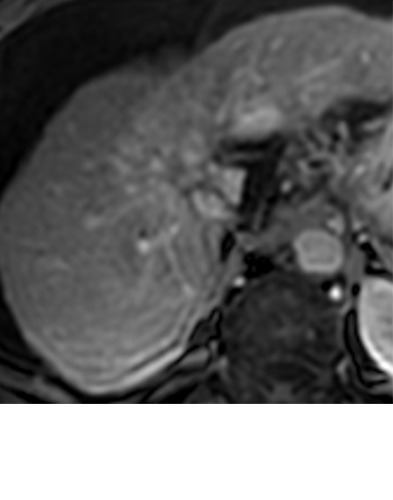
Imaging findings after stereotactic body radiation therapy. Axial images from a 59-year-old man with hepatocellular carcinoma (HCC) (arrow). (a) Pretreatment MR image demonstrates a 2.9-cm LR-5/OPTN 5B HCC in segment 8 of liver with arterial phase hyperenhancement (APHE), “washout” and “capsule” (b). (c) Three months after SBRT, the treated HCC measures 2.4 cm with persistent APHE and “washout” (d) (mRECIST SD, LR TR nonviable). (e) Six months after SBRT, the treated lesion measures 1.3 cm with persistent APHE and “washout” (f) (mRECIST PR, LR-TR nonviable). (g) One year after SBRT, the treated tumor measures 0.8 cm with persistent APHE and “washout” (h) (mRECIST PR, LR-TR nonviable). (i, j) Two years after SBRT the tumor is no longer seen (mRECIST CR, LR-TR nonviable). The surrounding parenchyma undergoes an evolution of radiation changes with early geographic arterial phase enhancement which normalized at portal venous (PV) phase of imaging. Over time, there is conversion to delayed phase geographic parenchymal enhancement, and progressive volume loss along the surface of the liver, secondary to fibrosis. CR = complete response, LR = LI-RADS, mRECIST = modified Response Evaluation Criteria for Solid Tumors, OPTN = Organ Procurement and Transplantation Network, PR = partial response, SBRT = stereotactic body radiation therapy, SD = stable disease, TR = treatment response.
Figure 11b:
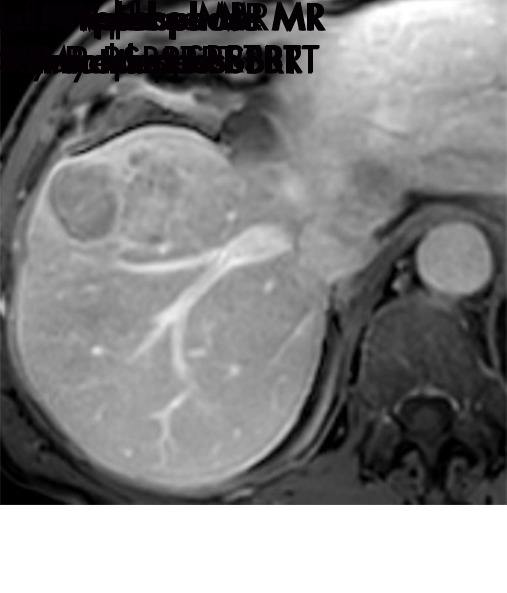
Evolution of imaging findings after stereotactic body radiation therapy (SBRT) with recurrent disease in a 65-year-old woman with hepatocellular carcinoma (HCC) (arrow). (a) Pretreatment MR image shows a 5.4-cm LR-5/OPTN 5× HCC in segment 8 of liver with arterial phase hyperenhancement (APHE), “washout”and “capsule” (b). (c) Three months after SBRT, the treated HCC measures 2.6 cm with persistent APHE and “washout” (d) (mRECIST PR, LR-TR nonviable). (e) Nine months after SBRT, the treated HCC measures 1.3 cm with persistent but decreased intensity of APHE and “washout” (f) (mRECIST PR, LR-TR nonviable). (g) One year after SBRT, the treated tumor begins to increase in size, now measuring 4.8 cm with increased intensity of APHE, “washout” and “capsule” (h). These findings are compatible with local tumor progression and biopsy proven (mRECIST PD, LR-TR viable). (c, e) Evolution of radiation changes in the surrounding parenchyma shows early geographic arterial phase enhancement. (f) Over time, there is conversion to delayed phase geographic parenchymal enhancement and progressive volume loss along the surface of the liver, secondary to fibtrosis. LR = LI-RADS, mRECIST = modified Response Evaluation Criteria for Solid Tumors, OPTN = Organ Procurement and Transplantation Network, PD = progressive disease, PR = partial response, SBRT = stereotactic body radiation therapy, TR = treatment response.
Figure 11c:
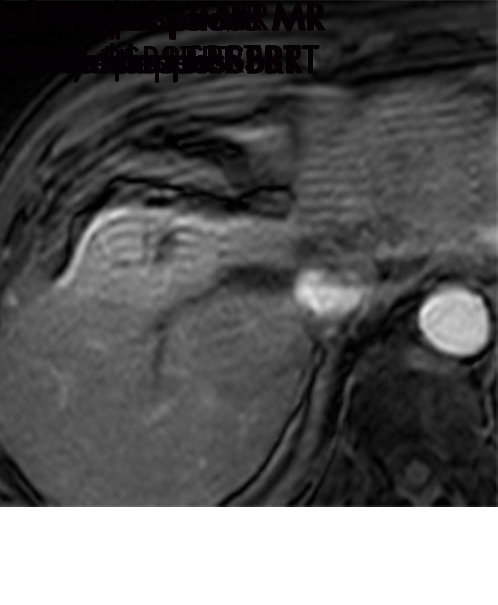
Evolution of imaging findings after stereotactic body radiation therapy (SBRT) with recurrent disease in a 65-year-old woman with hepatocellular carcinoma (HCC) (arrow). (a) Pretreatment MR image shows a 5.4-cm LR-5/OPTN 5× HCC in segment 8 of liver with arterial phase hyperenhancement (APHE), “washout”and “capsule” (b). (c) Three months after SBRT, the treated HCC measures 2.6 cm with persistent APHE and “washout” (d) (mRECIST PR, LR-TR nonviable). (e) Nine months after SBRT, the treated HCC measures 1.3 cm with persistent but decreased intensity of APHE and “washout” (f) (mRECIST PR, LR-TR nonviable). (g) One year after SBRT, the treated tumor begins to increase in size, now measuring 4.8 cm with increased intensity of APHE, “washout” and “capsule” (h). These findings are compatible with local tumor progression and biopsy proven (mRECIST PD, LR-TR viable). (c, e) Evolution of radiation changes in the surrounding parenchyma shows early geographic arterial phase enhancement. (f) Over time, there is conversion to delayed phase geographic parenchymal enhancement and progressive volume loss along the surface of the liver, secondary to fibtrosis. LR = LI-RADS, mRECIST = modified Response Evaluation Criteria for Solid Tumors, OPTN = Organ Procurement and Transplantation Network, PD = progressive disease, PR = partial response, SBRT = stereotactic body radiation therapy, TR = treatment response.
Figure 11d:
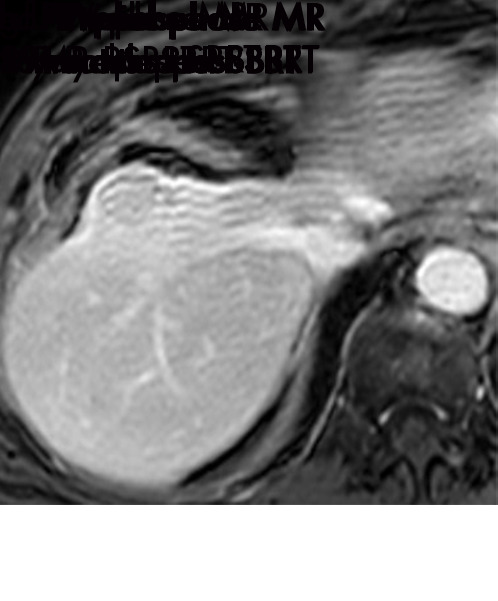
Evolution of imaging findings after stereotactic body radiation therapy (SBRT) with recurrent disease in a 65-year-old woman with hepatocellular carcinoma (HCC) (arrow). (a) Pretreatment MR image shows a 5.4-cm LR-5/OPTN 5× HCC in segment 8 of liver with arterial phase hyperenhancement (APHE), “washout”and “capsule” (b). (c) Three months after SBRT, the treated HCC measures 2.6 cm with persistent APHE and “washout” (d) (mRECIST PR, LR-TR nonviable). (e) Nine months after SBRT, the treated HCC measures 1.3 cm with persistent but decreased intensity of APHE and “washout” (f) (mRECIST PR, LR-TR nonviable). (g) One year after SBRT, the treated tumor begins to increase in size, now measuring 4.8 cm with increased intensity of APHE, “washout” and “capsule” (h). These findings are compatible with local tumor progression and biopsy proven (mRECIST PD, LR-TR viable). (c, e) Evolution of radiation changes in the surrounding parenchyma shows early geographic arterial phase enhancement. (f) Over time, there is conversion to delayed phase geographic parenchymal enhancement and progressive volume loss along the surface of the liver, secondary to fibtrosis. LR = LI-RADS, mRECIST = modified Response Evaluation Criteria for Solid Tumors, OPTN = Organ Procurement and Transplantation Network, PD = progressive disease, PR = partial response, SBRT = stereotactic body radiation therapy, TR = treatment response.
Figure 11e:
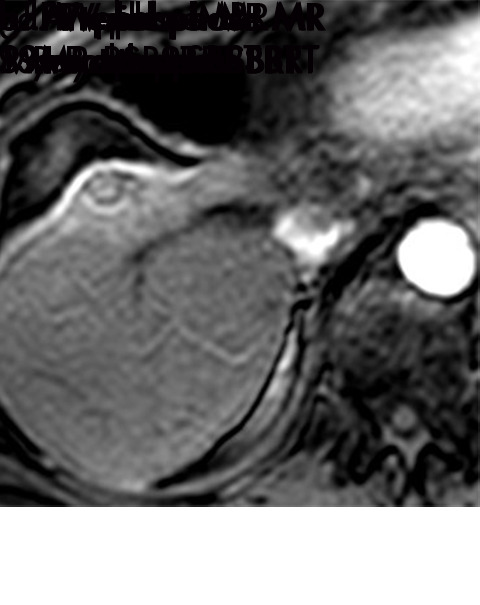
Evolution of imaging findings after stereotactic body radiation therapy (SBRT) with recurrent disease in a 65-year-old woman with hepatocellular carcinoma (HCC) (arrow). (a) Pretreatment MR image shows a 5.4-cm LR-5/OPTN 5× HCC in segment 8 of liver with arterial phase hyperenhancement (APHE), “washout”and “capsule” (b). (c) Three months after SBRT, the treated HCC measures 2.6 cm with persistent APHE and “washout” (d) (mRECIST PR, LR-TR nonviable). (e) Nine months after SBRT, the treated HCC measures 1.3 cm with persistent but decreased intensity of APHE and “washout” (f) (mRECIST PR, LR-TR nonviable). (g) One year after SBRT, the treated tumor begins to increase in size, now measuring 4.8 cm with increased intensity of APHE, “washout” and “capsule” (h). These findings are compatible with local tumor progression and biopsy proven (mRECIST PD, LR-TR viable). (c, e) Evolution of radiation changes in the surrounding parenchyma shows early geographic arterial phase enhancement. (f) Over time, there is conversion to delayed phase geographic parenchymal enhancement and progressive volume loss along the surface of the liver, secondary to fibtrosis. LR = LI-RADS, mRECIST = modified Response Evaluation Criteria for Solid Tumors, OPTN = Organ Procurement and Transplantation Network, PD = progressive disease, PR = partial response, SBRT = stereotactic body radiation therapy, TR = treatment response.
Figure 11f:
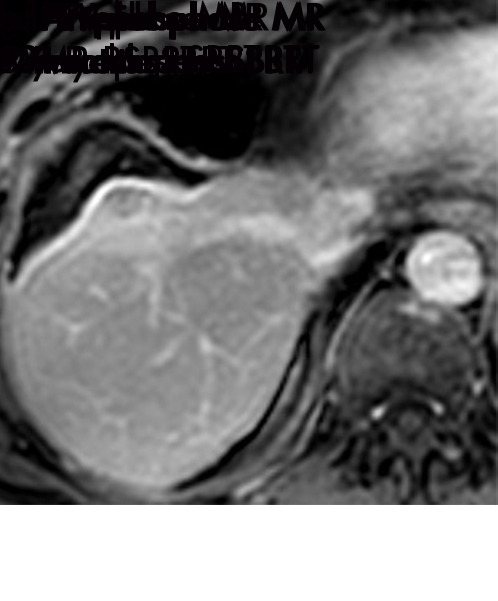
Evolution of imaging findings after stereotactic body radiation therapy (SBRT) with recurrent disease in a 65-year-old woman with hepatocellular carcinoma (HCC) (arrow). (a) Pretreatment MR image shows a 5.4-cm LR-5/OPTN 5× HCC in segment 8 of liver with arterial phase hyperenhancement (APHE), “washout”and “capsule” (b). (c) Three months after SBRT, the treated HCC measures 2.6 cm with persistent APHE and “washout” (d) (mRECIST PR, LR-TR nonviable). (e) Nine months after SBRT, the treated HCC measures 1.3 cm with persistent but decreased intensity of APHE and “washout” (f) (mRECIST PR, LR-TR nonviable). (g) One year after SBRT, the treated tumor begins to increase in size, now measuring 4.8 cm with increased intensity of APHE, “washout” and “capsule” (h). These findings are compatible with local tumor progression and biopsy proven (mRECIST PD, LR-TR viable). (c, e) Evolution of radiation changes in the surrounding parenchyma shows early geographic arterial phase enhancement. (f) Over time, there is conversion to delayed phase geographic parenchymal enhancement and progressive volume loss along the surface of the liver, secondary to fibtrosis. LR = LI-RADS, mRECIST = modified Response Evaluation Criteria for Solid Tumors, OPTN = Organ Procurement and Transplantation Network, PD = progressive disease, PR = partial response, SBRT = stereotactic body radiation therapy, TR = treatment response.
Figure 11g:
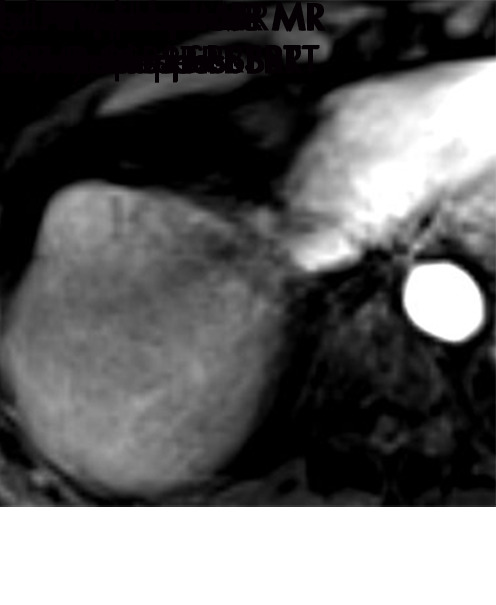
Evolution of imaging findings after stereotactic body radiation therapy (SBRT) with recurrent disease in a 65-year-old woman with hepatocellular carcinoma (HCC) (arrow). (a) Pretreatment MR image shows a 5.4-cm LR-5/OPTN 5× HCC in segment 8 of liver with arterial phase hyperenhancement (APHE), “washout”and “capsule” (b). (c) Three months after SBRT, the treated HCC measures 2.6 cm with persistent APHE and “washout” (d) (mRECIST PR, LR-TR nonviable). (e) Nine months after SBRT, the treated HCC measures 1.3 cm with persistent but decreased intensity of APHE and “washout” (f) (mRECIST PR, LR-TR nonviable). (g) One year after SBRT, the treated tumor begins to increase in size, now measuring 4.8 cm with increased intensity of APHE, “washout” and “capsule” (h). These findings are compatible with local tumor progression and biopsy proven (mRECIST PD, LR-TR viable). (c, e) Evolution of radiation changes in the surrounding parenchyma shows early geographic arterial phase enhancement. (f) Over time, there is conversion to delayed phase geographic parenchymal enhancement and progressive volume loss along the surface of the liver, secondary to fibtrosis. LR = LI-RADS, mRECIST = modified Response Evaluation Criteria for Solid Tumors, OPTN = Organ Procurement and Transplantation Network, PD = progressive disease, PR = partial response, SBRT = stereotactic body radiation therapy, TR = treatment response.
Figure 11h:
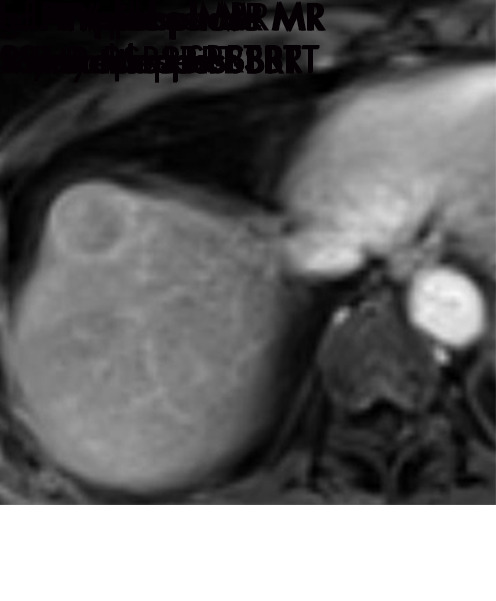
Evolution of imaging findings after stereotactic body radiation therapy (SBRT) with recurrent disease in a 65-year-old woman with hepatocellular carcinoma (HCC) (arrow). (a) Pretreatment MR image shows a 5.4-cm LR-5/OPTN 5× HCC in segment 8 of liver with arterial phase hyperenhancement (APHE), “washout”and “capsule” (b). (c) Three months after SBRT, the treated HCC measures 2.6 cm with persistent APHE and “washout” (d) (mRECIST PR, LR-TR nonviable). (e) Nine months after SBRT, the treated HCC measures 1.3 cm with persistent but decreased intensity of APHE and “washout” (f) (mRECIST PR, LR-TR nonviable). (g) One year after SBRT, the treated tumor begins to increase in size, now measuring 4.8 cm with increased intensity of APHE, “washout” and “capsule” (h). These findings are compatible with local tumor progression and biopsy proven (mRECIST PD, LR-TR viable). (c, e) Evolution of radiation changes in the surrounding parenchyma shows early geographic arterial phase enhancement. (f) Over time, there is conversion to delayed phase geographic parenchymal enhancement and progressive volume loss along the surface of the liver, secondary to fibtrosis. LR = LI-RADS, mRECIST = modified Response Evaluation Criteria for Solid Tumors, OPTN = Organ Procurement and Transplantation Network, PD = progressive disease, PR = partial response, SBRT = stereotactic body radiation therapy, TR = treatment response.
Post-SBRT enhancement patterns are varied and relate to the time interval between follow-up imaging and SBRT. Complete tumor necrosis is rarely seen at the first posttreatment examination (Fig 9). In fact, 75% of SBRT-treated HCCs exhibit persistent arterial phase hyperenhancement 3–6 months after therapy (50,51). Arterial phase hyperenhancement, washout, and capsule slowly disappear over time, although are occasionally seen in successfully treated HCCs greater than 1 year after SBRT (50) (Figs 10, 11). Eventually, most successfully treated tumors will convert to complete nonenhancement, but the presence of persistent enhancement within an HCC after SBRT does not necessarily indicate the presence of viable tumor (51).
Figure 10a:
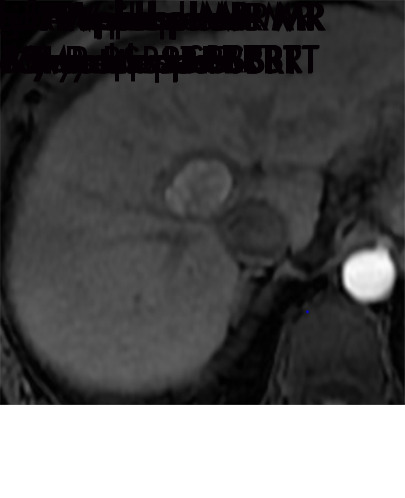
Imaging findings after stereotactic body radiation therapy. Axial images from a 59-year-old man with hepatocellular carcinoma (HCC) (arrow). (a) Pretreatment MR image demonstrates a 2.9-cm LR-5/OPTN 5B HCC in segment 8 of liver with arterial phase hyperenhancement (APHE), “washout” and “capsule” (b). (c) Three months after SBRT, the treated HCC measures 2.4 cm with persistent APHE and “washout” (d) (mRECIST SD, LR TR nonviable). (e) Six months after SBRT, the treated lesion measures 1.3 cm with persistent APHE and “washout” (f) (mRECIST PR, LR-TR nonviable). (g) One year after SBRT, the treated tumor measures 0.8 cm with persistent APHE and “washout” (h) (mRECIST PR, LR-TR nonviable). (i, j) Two years after SBRT the tumor is no longer seen (mRECIST CR, LR-TR nonviable). The surrounding parenchyma undergoes an evolution of radiation changes with early geographic arterial phase enhancement which normalized at portal venous (PV) phase of imaging. Over time, there is conversion to delayed phase geographic parenchymal enhancement, and progressive volume loss along the surface of the liver, secondary to fibrosis. CR = complete response, LR = LI-RADS, mRECIST = modified Response Evaluation Criteria for Solid Tumors, OPTN = Organ Procurement and Transplantation Network, PR = partial response, SBRT = stereotactic body radiation therapy, SD = stable disease, TR = treatment response.
As major features of HCC commonly persist for a long time within tumors effectively treated with SBRT, lesion size rather than enhancement pattern must be relied on to discriminate viable HCC from appropriate treatment response (Figs 10, 11). An HCC that is stable or decreasing in size after radiation should be considered appropriately responding to therapy, regardless of the internal enhancement pattern (50,51).
Although SBRT uses focused radiation targeted to the tumor, there are often radiation effects within adjacent off-target hepatic parenchyma. Initially, geographic arterial phase hyperenhancement will develop in off-target parenchyma adjacent to the treated HCC; this usually persists for about 6 months (Figs 10, 11). Lack of washout or other ancillary features (eg, T2-weighted or diffusion-weighted hyperintensity) is helpful to differentiate expected postradiation perfusional changes from infiltrative tumor (52). Over time, the arterial phase hyperenhancement converts to portal venous and delayed phase hyperenhancement, as radiation-related veno-occlusion and fibrosis develops, with overlying capsular retraction (Figs 10, 11). Radiation-induced biliary strictures will occasionally develop, more commonly after irradiation of HCCs located centrally within the liver.
Appearance of Viable Tumor
SBRT has high rates of primary treatment efficacy (50,51,53). An accurate understanding of expected post-SBRT imaging findings is critical to avoid misinterpreting normal posttreatment changes as local progression or viable tumor. There is limited research identifying imaging features which suggest local recurrence after SBRT. However, it seems the most reliable imaging findings to suggest local recurrence are increase in size of a treated lesion or new or increasing arterial phase hyperenhancement within a treated tumor in which arterial phase hyperenhancement was previously decreasing or absent (50) (Fig 11).
Application of Treatment Response Criteria after SBRT
Since the majority of HCCs effectively treated with SBRT exhibit arterial phase hyperenhancement for 6–12 months, application of mRECIST and EASL criteria will result in frequent misclassification of appropriately responding tumor as viable tumor. When utilizing the LI-RADS treatment classification, persistent tumor enhancement within an HCC after SBRT is best characterized as LR-TR equivocal or LR-TR nonviable so long as the treated tumor is decreasing in size; such findings should be followed and not classified as LR-TR viable.
Conclusion
MRI findings differ depending on the local-regional treatment modality utilized for HCC. It is essential for radiologists to understand the characteristic posttreatment imaging findings specific to each of the local-regional therapies, as incorrect image interpretation can result in inappropriate clinical management, including unneeded retreatment and transplant misallocation. mRECIST, EASL, and LI-RADS tumor response classification systems should be applied cautiously for radiation-based therapies (TARE, SBRT) for which persistent arterial phase hyperenhancement in the early posttreatment period is common.
Authors declared no funding for this work.
Disclosures of Conflicts of Interest: M.M. disclosed no relevant relationships. W.R.M. disclosed no relevant relationships. K.S. disclosed no relevant relationships. A.Z. disclosed no relevant relationships. A.S.J. disclosed no relevant relationships. S.M. disclosed no relevant relationships. A.A. disclosed no relevant relationships. K.E.M. Activities related to the present article: disclosed no relevant relationships. Activities not related to the present article: receives royalties from Wolters Kluwer and Elsevier. Other relationships: disclosed no relevant relationships. M.S.D. Activities related to the present article: disclosed no relevant relationships. Activities not related to the present article: receives royalties from Wolters Kluwer and uptodate.com. Other relationships: disclosed no relevant relationships.
Abbreviations:
- EASL
- European Association for the Study of Liver Disease
- HCC
- hepatocellular carcinoma
- LI-RADS
- Liver Imaging and Reporting Data System
- LR-TR
- LI-RADS treatment response
- mRECIST
- modified Response Evaluation Criteria in Solid Tumors
- SBRT
- stereotactic body radiation therapy
- TACE
- transarterial chemoembolization
- TARE
- transarterial radioembolization
References
- 1.Marrero JA, Kulik LM, Sirlin CB, et al. Diagnosis, Staging, and Management of Hepatocellular Carcinoma: 2018 Practice Guidance by the American Association for the Study of Liver Diseases. Hepatology 2018;68(2):723–750. [DOI] [PubMed] [Google Scholar]
- 2.Poulou LS, Botsa E, Thanou I, Ziakas PD, Thanos L. Percutaneous microwave ablation vs radiofrequency ablation in the treatment of hepatocellular carcinoma. World J Hepatol 2015;7(8):1054–1063. [DOI] [PMC free article] [PubMed] [Google Scholar]
- 3.Molla N, AlMenieir N, Simoneau E, et al. The role of interventional radiology in the management of hepatocellular carcinoma. Curr Oncol 2014;21(3):e480–e492. [DOI] [PMC free article] [PubMed] [Google Scholar]
- 4.Gamblin TC, Geller DA. Downstaging hepatocellular carcinoma prior to liver transplantation. Liver Transpl 2005;11(12):1466–1468. [DOI] [PubMed] [Google Scholar]
- 5.Mora RA, Ali R, Gabr A, et al. Pictorial essay: imaging findings following Y90 radiation segmentectomy for hepatocellular carcinoma. Abdom Radiol (NY) 2018;43(7):1723–1738. [DOI] [PubMed] [Google Scholar]
- 6.Galun D, Basaric D, Zuvela M, et al. Hepatocellular carcinoma: From clinical practice to evidence-based treatment protocols. World J Hepatol 2015;7(20):2274–2291. [DOI] [PMC free article] [PubMed] [Google Scholar]
- 7.Bruix J, Sherman M, Llovet JM, et al. Clinical management of hepatocellular carcinoma. Conclusions of the Barcelona-2000 EASL conference. European Association for the Study of the Liver. J Hepatol 2001;35(3):421–430. [DOI] [PubMed] [Google Scholar]
- 8.Lencioni R, Llovet JM. Modified RECIST (mRECIST) assessment for hepatocellular carcinoma. Semin Liver Dis 2010;30(1):52–60. [DOI] [PMC free article] [PubMed] [Google Scholar]
- 9.Chernyak V, Fowler KJ, Kamaya A, et al. Liver Imaging Reporting and Data System (LI-RADS) Version 2018: Imaging of Hepatocellular Carcinoma in At-Risk Patients. Radiology 2018;289(3):816–830. [DOI] [PMC free article] [PubMed] [Google Scholar]
- 10.El-Maraghi RH, Eisenhauer EA. Review of phase II trial designs used in studies of molecular targeted agents: outcomes and predictors of success in phase III. J Clin Oncol 2008;26(8):1346–1354. [DOI] [PubMed] [Google Scholar]
- 11.Yaghmai V, Miller FH, Rezai P, Benson AB 3rd, Salem R. Response to treatment series: part 2, tumor response assessment--using new and conventional criteria. AJR Am J Roentgenol 2011;197(1):18–27. [DOI] [PubMed] [Google Scholar]
- 12.Boas FE, Do B, Louie JD, et al. Optimal imaging surveillance schedules after liver-directed therapy for hepatocellular carcinoma. J Vasc Interv Radiol 2015;26(1):69–73. [DOI] [PubMed] [Google Scholar]
- 13.Gaba RC, Baerlocher MO, Nikolic B, Venkatesan AM, Lewandowski RJ. Clinical and imaging follow-up practices after transarterial therapy for primary and secondary hepatic malignancies: Results of an online survey. Acad Radiol 2015;22(12):1510–1515. [DOI] [PubMed] [Google Scholar]
- 14.Lencioni R, Crocetti L, Pina MC, Cioni D. Percutaneous image-guided radiofrequency ablation of liver tumors. Abdom Imaging 2009;34(5):547–556. [DOI] [PubMed] [Google Scholar]
- 15.Liang P, Wang Y. Microwave ablation of hepatocellular carcinoma. Oncology 2007;72(Suppl 1):124–131. [DOI] [PubMed] [Google Scholar]
- 16.Song KD. Percutaneous cryoablation for hepatocellular carcinoma. Clin Mol Hepatol 2016;22(4):509–515. [DOI] [PMC free article] [PubMed] [Google Scholar]
- 17.Gervais DA, Arellano RS. Percutaneous tumor ablation for hepatocellular carcinoma. AJR Am J Roentgenol 2011;197(4):789–794. [DOI] [PubMed] [Google Scholar]
- 18.Goldberg SN, Gazelle GS, Mueller PR. Thermal ablation therapy for focal malignancy: a unified approach to underlying principles, techniques, and diagnostic imaging guidance. AJR Am J Roentgenol 2000;174(2):323–331. [DOI] [PubMed] [Google Scholar]
- 19.Young S, Taylor AJ, Sanghvi T. Post Locoregional Therapy Treatment Imaging in Hepatocellular Carcinoma Patients: A Literature-based Review. J Clin Transl Hepatol 2018;6(2):189–197. [DOI] [PMC free article] [PubMed] [Google Scholar]
- 20.Goldberg SN, Gazelle GS, Compton CC, Mueller PR, Tanabe KK. Treatment of intrahepatic malignancy with radiofrequency ablation: radiologic-pathologic correlation. Cancer 2000;88(11):2452–2463. [PubMed] [Google Scholar]
- 21.Braga L, Guller U, Semelka RC. Pre-, peri-, and posttreatment imaging of liver lesions. Radiol Clin North Am 2005;43(5):915–927, viii. [DOI] [PubMed] [Google Scholar]
- 22.Dromain C, de Baere T, Elias D, et al. Hepatic tumors treated with percutaneous radio-frequency ablation: CT and MR imaging follow-up. Radiology 2002;223(1):255–262. [DOI] [PubMed] [Google Scholar]
- 23.Kim YS, Rhim H, Lim HK, Choi D, Lee MW, Park MJ. Coagulation necrosis induced by radiofrequency ablation in the liver: histopathologic and radiologic review of usual to extremely rare changes. RadioGraphics 2011;31(2):377–390. [DOI] [PubMed] [Google Scholar]
- 24.Crocetti L, Della Pina C, Cioni D, Lencioni R. Peri-intraprocedural imaging: US, CT, and MRI. Abdom Imaging 2011;36(6):648–660. [DOI] [PubMed] [Google Scholar]
- 25.Mahmoud B, Elkholy SF, Nabeel M, et al. Role of MRI in the assessment of treatment response after radiofrequency and microwave ablation therapy for hepatocellular carcinoma. Egypt J Radiol Nucl Med 2016;47(2):377–385. [Google Scholar]
- 26.Bouda D, Lagadec M, Alba CG, et al. Imaging review of hepatocellular carcinoma after thermal ablation: The good, the bad, and the ugly. J Magn Reson Imaging 2016;44(5):1070–1090. [DOI] [PubMed] [Google Scholar]
- 27.Koda M, Tokunaga S, Miyoshi K, et al. Assessment of ablative margin by unenhanced magnetic resonance imaging after radiofrequency ablation for hepatocellular carcinoma. Eur J Radiol 2012;81(10):2730–2736. [DOI] [PubMed] [Google Scholar]
- 28.Wald C, Russo MW, Heimbach JK, Hussain HK, Pomfret EA, Bruix J. New OPTN/UNOS policy for liver transplant allocation: standardization of liver imaging, diagnosis, classification, and reporting of hepatocellular carcinoma. Radiology 2013;266(2):376–382. [DOI] [PubMed] [Google Scholar]
- 29.Agnello F, Salvaggio G, Cabibbo G, et al. Imaging appearance of treated hepatocellular carcinoma. World J Hepatol 2013;5(8):417–424. [DOI] [PMC free article] [PubMed] [Google Scholar]
- 30.Huppert P. Current concepts in transarterial chemoembolization of hepatocellular carcinoma. Abdom Imaging 2011;36(6):677–683. [DOI] [PubMed] [Google Scholar]
- 31.Lim HS, Jeong YY, Kang HK, Kim JK, Park JG. Imaging features of hepatocellular carcinoma after transcatheter arterial chemoembolization and radiofrequency ablation. AJR Am J Roentgenol 2006;187(4):W341–W349. [DOI] [PubMed] [Google Scholar]
- 32.Meza-Junco J, Montano-Loza AJ, Liu DM, et al. Locoregional radiological treatment for hepatocellular carcinoma; Which, when and how? Cancer Treat Rev 2012;38(1):54–62. [DOI] [PubMed] [Google Scholar]
- 33.Vossen JA, Buijs M, Kamel IR. Assessment of tumor response on MR imaging after locoregional therapy. Tech Vasc Interv Radiol 2006;9(3):125–132. [DOI] [PubMed] [Google Scholar]
- 34.Chiu RYW, Yap WW, Patel R, Liu D, Klass D, Harris AC. Hepatocellular Carcinoma Post Embolotherapy: Imaging Appearances and Pitfalls on Computed Tomography and Magnetic Resonance Imaging. Can Assoc Radiol J 2016;67(2):158–172. [DOI] [PubMed] [Google Scholar]
- 35.Kim KW, Lee JM, Choi BI. Assessment of the treatment response of HCC. Abdom Imaging 2011;36(3):300–314. [DOI] [PubMed] [Google Scholar]
- 36.Kallini JR, Gabr A, Salem R, Lewandowski RJ. Transarterial Radioembolization with Yttrium-90 for the Treatment of Hepatocellular Carcinoma. Adv Ther 2016;33(5):699–714. [DOI] [PMC free article] [PubMed] [Google Scholar]
- 37.Ibrahim SM, Nikolaidis P, Miller FH, et al. Radiologic findings following Y90 radioembolization for primary liver malignancies. Abdom Imaging 2009;34(5):566–581. [DOI] [PubMed] [Google Scholar]
- 38.Montgomery J, Trebelev AE, Bianco BA. Imaging of hepatocellular carcinoma after transarterial locoregional therapy: a practical review and discussion of treatment response. J Am Osteopath Coll Radiol 2017;6(3):5–12. [Google Scholar]
- 39.Lau WY, Sangro B, Chen PJ, et al. Treatment for hepatocellular carcinoma with portal vein tumor thrombosis: the emerging role for radioembolization using yttrium-90. Oncology 2013;84(5):311–318. [DOI] [PubMed] [Google Scholar]
- 40.Singh P, Anil G. Yttrium-90 radioembolization of liver tumors: what do the images tell us? Cancer Imaging 2014;13(4):645–657. [DOI] [PMC free article] [PubMed] [Google Scholar]
- 41.Miller FH, Keppke AL, Reddy D, et al. Response of liver metastases after treatment with yttrium-90 microspheres: role of size, necrosis, and PET. AJR Am J Roentgenol 2007;188(3):776–783. [DOI] [PubMed] [Google Scholar]
- 42.Salem R, Thurston KG. Radioembolization with yttrium-90 microspheres: a state-of-the-art brachytherapy treatment for primary and secondary liver malignancies: part 3: comprehensive literature review and future direction. J Vasc Interv Radiol 2006;17(10):1571–1593. [DOI] [PubMed] [Google Scholar]
- 43.Adcock CS, Florez E, Zand KA, Patel A, Howard CM, Fatemi A. Assessment of treatment response following yttrium-90 transarterial radioembolization of liver malignancies. Cureus 2018;10(6):e2895. [DOI] [PMC free article] [PubMed] [Google Scholar]
- 44.Keppke AL, Salem R, Reddy D, et al. Imaging of hepatocellular carcinoma after treatment with yttrium-90 microspheres. AJR Am J Roentgenol 2007;188(3):768–775. [DOI] [PubMed] [Google Scholar]
- 45.Kallini JR, Miller FH, Gabr A, Salem R, Lewandowski RJ. Hepatic imaging following intra-arterial embolotherapy. Abdom Radiol (NY) 2016;41(4):600–616. [DOI] [PubMed] [Google Scholar]
- 46.Benedict SH, Yenice KM, Followill D, et al. Stereotactic body radiation therapy: the report of AAPM Task Group 101. Med Phys 2010;37(8):4078–4101 [Published correction appears in Med Phys 2012;39(1):563. Dosage error in article text.] [DOI] [PubMed] [Google Scholar]
- 47.Choi SH, Seong J. Stereotactic body radiotherapy: does it have a role in management of hepatocellular carcinoma? Yonsei Med J 2018;59(8):912–922. [DOI] [PMC free article] [PubMed] [Google Scholar]
- 48.Hansen AT, Petersen JB, Høyer M. Internal movement, set-up accuracy and margins for stereotactic body radiotherapy using a stereotactic body frame. Acta Oncol 2006;45(7):948–952. [DOI] [PubMed] [Google Scholar]
- 49.Zeng ZC, Seong J, Yoon SM, et al. Consensus on Stereotactic Body Radiation Therapy for Small-Sized Hepatocellular Carcinoma at the 7th Asia-Pacific Primary Liver Cancer Expert Meeting. Liver Cancer 2017;6(4):264–274. [DOI] [PMC free article] [PubMed] [Google Scholar]
- 50.Mendiratta-Lala M, Masch W, Shankar PR, et al. Magnetic Resonance Imaging Evaluation of Hepatocellular Carcinoma Treated With Stereotactic Body Radiation Therapy: Long Term Imaging Follow-Up. Int J Radiat Oncol Biol Phys 2019;103(1):169–179. [DOI] [PMC free article] [PubMed] [Google Scholar]
- 51.Mendiratta-Lala M, Gu E, Owen D, et al. Imaging Findings within the first 12 months of hepatocellular carcinoma treated with stereotactic body radiation therapy. Int J Radiat Oncol Biol Phys 2018;102(4):1063–1069. [DOI] [PMC free article] [PubMed] [Google Scholar]
- 52.Tétreau R, Llacer C, Riou O, Deshayes E. Evaluation of response after SBRT for liver tumors. Rep Pract Oncol Radiother 2017;22(2):170–175. [DOI] [PMC free article] [PubMed] [Google Scholar]
- 53.Kuo HT, Que J, Lin LC, Yang CC, Koay LB, Lin CH. Impact of tumor size on outcome after stereotactic body radiation therapy for inoperable hepatocellular carcinoma. Medicine (Baltimore) 2017;96(50):e9249. [DOI] [PMC free article] [PubMed] [Google Scholar]


