

Abstract
Objective:
We tested whether bone-related EV phenotypes changed after initiating antiretroviral therapy (ART) and determined whether changes in levels of EVs correlated with changes in bone mineral density (BMD).
Design:
EV phenotypes were measured in blinded serum samples from 15 adults with HIV at baseline, 1, 3, 6 and 12 months after ART initiation. Not all samples were available at each time point so we averaged early (TP1, 1-3 months) and late (TP2, 6-12 months) time points.
Methods:
EVs were stained for osteocalcin (OC), RANKL (CD254), RANK (CD265), M-CSF (macrophage colony stimulating factor), and CD34. Serum OC, procollagen type I N-terminal propeptide (P1NP), and C-terminal telopeptide of type 1 collagen (CTx) were also measured.
Results:
BMD significantly decreased from baseline to 12 months. Levels of OC+EVs, serum OC, serum P1NP, and CTx were significantly higher at early and late time points compared to baseline. Increases in EVs expressing OC, RANKL, RANK, and CD34 from baseline to TP1 were associated with decreases in total hip BMD from baseline to 12 months. Change in serum OC, P1NP, and CTx from baseline to TP1 or TP2 did not correlate with change in BMD.
Conclusion:
Early changes in EVs expressing markers of bone activity were associated with total hip bone loss 12 months after ART initiation. These data suggest that serum EVs may serve as novel biomarkers of bone remodeling. Future studies are required to determine if EVs contribute to the effects of ART on changes in bone turnover markers and BMD.
Keywords: Extracellular vesicles, bone remodeling, HIV, ART, bone mineral density, osteocalcin, RANKL
Introduction
Most studies report that BMD decreases by 2 to 6% in adults with HIV within 12 months after initiating antiretroviral therapy (ART) [1-3] and may be associated with higher risk of fracture during the first 2 years after ART initiation [4]. Since bone loss is consistently observed across different ART regimens, one theory is that the inflammatory state-associated immune reconstitution with ART leads to an imbalance in bone remodeling, favoring osteoclastogenesis and bone resorption [5-9]. Ofotokun et al. found that levels of the bone resorption marker, C-telopeptide (CTx) increased 200% within 12 weeks after ART initiation, and was accompanied by increases in plasma levels of receptor activator of NF-kB ligand (RANKL) and tumor necrosis factor-α (TNF-α); furthermore, CTx levels correlated with the magnitude of CD4 T cell repopulation [10]. However, specific antiretrovirals, such as tenofovir disoproxil fumarate (TDF) and ritonavir-boosted protease inhibitors, are associated with greater bone loss in individuals with HIV [3,11] and those without HIV receiving TDF combined with emtricitabine for pre-exposure prophylaxis [12], suggesting that direct effects of antiretrovirals may also impact bone cells or signaling between osteoblasts and osteoclasts.
Extracellular vesicles (EVs) represent a heterogeneous population of nano and micro-sized vesicles, described as exosomes and microvesicles, and are released by most cell types, such as immune cells, osteoblasts, osteoclasts, osteocytes and bone marrow stem cells [13-16]. EVs have been isolated from numerous biological fluids including plasma [17], serum [18], urine [19], and cell culture medium [20]. They can transfer their cargo through endocytosis or fusion to recipient target cells, signaling via membrane proteins, microRNAs, mRNAs, and other growth factors that have emerged as novel mediators in bone metabolism and in the bone microenvironment [14,16,21-24]. The biodistribution of EVs reflects the parent cell source, and circulating EVs are efficiently internalized into different target cell types [25]. In addition, it is known that osteocalcin (OC) [26], CD34 [27], and M-CSF are expressed by osteoblast lineage cells [28], and that RANKL is expressed preferentially by immature osteoblasts [29]. Other studies also demonstrated the expression of RANKL by human B cells [9,30] and T cells [31]. RANK is expressed in fewer tissues than RANKL, but is also expressed by mature osteoclasts [32], dendritic cells, T cells [33], and some cancer cells [34]. Prior work has revealed that bone-derived EVs contain specific osteogenic proteins, such as osteocalcin [35,36]. EVs also contain proteins related to osteoclast differentiation, such as RANK and RANKL [13,16].
EVs may provide a novel mechanism for intercellular communication in the bone remodeling microenvironment and may reflect the state of cells in the bone under healthy and pathologic conditions [21,37,38].
A recent study reported that osteoblast-derived EVs contain RANKL and can stimulate osteoclast formation by signaling through the RANK-RANKL pathway [16]. Osteoprotegerin was also shown to inhibit EV-derived RANKL binding to RANK, preventing the RANK-RANKL interaction to regulate osteoclast activity [16]. Interestingly, another study performed by Li and colleagues showed that in ovariectomized mice, miR-214-3p from osteoclast-derived exosomes inhibited osteoblast bone formation [21]. While the evidence supports bone-derived EVs having the potential to influence osteoblast and osteoclast activity [22,24,38], the role of EVs in osteoporosis and other bone metabolic disorders is not well defined.
Despite the interest in EVs across many fields, little is known about the relationship of circulating EV cargo and their function in the bone-remodeling microenvironment. To investigate the relevance of EVs both in communication between bone cells and as a potential biomarker of bone remodeling in HIV, we tested whether bone-related EV phenotypes changed after ART initiation and determined whether changes in levels of EVs correlated with changes in BMD at 12 months.
Methods
Study population characteristics
The study population consisted of 15 ART-naïve male and female adults living with HIV who were about to start ART. Participants were recruited from the Comprehensive Health Program at Columbia University Irving Medical Center (CUIMC) for a prospective observational study of change in BMD and bone turnover markers with initiation of ART. Stored sera from this study were utilized for this EV substudy. Participants were considered ineligible if they had previously been diagnosed with an opportunistic infection, chronic kidney disease, malabsorption syndrome, neoplasia, hepatic impairment, or had history of treatment with bisphosphonates, glucocorticoids, or antiresorptive drugs. At enrollment, demographic information and clinical laboratory data including CD4+ T cell count, HIV-1 RNA levels, medical history, osteoporosis risk factors, and current and past medication history were obtained.
Blood samples were collected at study entry before ART initiation and after 1, 3, 6 and 12 months on treatment. Of the 15 participants, 6 did not have serum samples available at every time point, so we averaged early time points (TP1, 1-3 months) and late time points (TP2, 6-12 months). BMD was assessed at baseline and month 12 by dual-energy X-ray absorptiometry (DXA). This study was approved by the Institutional Review Board of CUIMC, and all participants gave written informed consent.
Serum EV processing
At baseline and at 1, 3, 6, and 12 months after ART initiation, fasting morning blood samples were collected into marble-top tubes with clot activator and gel separator, processed, and the obtained serum stored at −80°C until batch analyses. Fractionation of serum-EVs was performed with 0.22 μm Ultrafree MC-GV Centrifugal Filter Units (Millipore) for 5 minutes at 860 g. EVs were recovered from the top of the filter by resuspension with phosphate buffered saline as previously reported [39], and their relative size, absolute count, and markers from their cell of origin were determined.
Characterization of EV surface markers by flow cytometry
To determine EV quantity and expression of phenotypic markers, blinded serum samples were stained using pre-titrated volumes of the following fluorochrome-conjugated monoclonal antibodies: osteocalcin (OC)-Alexa/488 (R&D Systems), RANK [(CD265) receptor activator of nuclear factor-kappa B-Alexa/700 (Novus Biologicals)], RANKL [(CD254) RANK ligand-APC (BioLegend)], M-CSF [(macrophage colony stimulating factor) -PE (R&D Systems)], and CD34-PE-Dazzle/594 (BioLegend). When panels were optimized, appropriate isotype-matched antibodies for each specific antibody were used as a negative control to assist with setting parameter gates. Prior to testing EV samples, each antibody was filtered using a 0.22 μm centrifugal filter, and the filtrate was used for staining. One to 5 μL of titrated monoclonal antibodies was added to 20 μL of EVs and incubated at 4°C for 30 minutes. To reduce background staining EVs were centrifuged for 5 minutes at 860 g using 0.22 μm filters, and EVs remaining on the filter surface were resuspended in 300 μL buffered of 0.22 μm-filtered PBS containing 2.8% formaldehyde (BD stabilizing fixative).
Acquisition was performed on an LSRII flow cytometer (Becton Dickinson). Forward scatter (FSC) and side scatter (SSC) were set to the maximum voltages around of 500-600 and 300-400, respectively, to exclude the majority of the background instrument noise. Samples were acquired for one minute at low sample pressure and flow rate (8 – 12 μL/min), and the collection of 10,000.000 events was attempted for each sample. The sensitivity of the flow cytometer to set a counting window was based on polystyrene beads. Gates were established using a blend of size-calibrated fluorescent beads sized from 0.1 μm (Invitrogen) to 1 μm (Megamix beads: 0.16, 0.2, 0.24 and 0.5 μm; and Spherotech 1 μm size) and used to set up SSC and FSC voltages for EV analysis. TruCount™ tubes (BD Biosciences) containing a lyophilized pellet, which releases a known number of fluorescent beads, were used to measure the absolute counts of EVs. Analysis was performed using FlowJo 10 software (Tree Star).
Measurement of markers of bone turnover, inflammation and calciotropic hormones
Fasting morning serum samples were collected at baseline, and at 1, 3, 6, and 12 months after ART initiation, aliquoted, stored at −80°C and batch-analyzed at the Irving Institute Biomarkers Core at CUIMC. Bone turnover markers were analyzed, including bone formation markers osteocalcin (OC; RIA, Immutopics) and procollagen type I N-terminal propeptide (P1NP; RIA, Immunodiagnostic Systems), and the resorption marker C-telopeptide (CTx, ELISA; IDS). Additionally, we measured inflammatory markers interleukin (IL)-6 and tumor necrosis factor (TNF)-α by ELISA (ELISA; R&D Systems), and calciotropic markers, parathyroid hormone (PTH; RIA, Corning-Nichols Laboratory), total 25-hydroxyvitamin D (25-OHD, liquid chromatography tandem mass spectrometry), and 1,25-dihydroxyvitamin D (1,25-OHD; RIA, Diasorin). Except for 25-OHD, biomarkers were measured in duplicate and values averaged for analysis. CD4 counts were measured by flow cytometry. HIV-1 RNA was quantified by a PCR using the Amplicor HIV-1 Monitor Ultrasensitive Test with a linear range of 50-100,000 copies/mL (Roche Diagnostics).
Bone densitometry and body composition by dual energy X-ray absorptiometry
Areal BMD of the lumbar spine (LS; L1-4), total hip (TH), and femoral neck (FN) were measured at baseline and at 12 months on 14 participants by DXA utilizing a QDR 4500 bone densitometer (Discovery; Hologic Inc). BMD values are reported as g/cm2, Z-score and T-scores, and analyzed per the criteria established by the World Health Organization. BMI was calculated as weight (kg) divided by height (m) squared. Total body and trunk fat were measured on a QDR 4500 bone densitometer.
Statistical analysis
Statistical analyses were performed using Prism 7.0 (GraphPad Software). Data were log10 transformed to address rightward skewing. The Shapiro-Wilk test was used to determine normality. Longitudinal data were analyzed by repeated measure ANOVA with the Greenhouse-Geisser correction and using Dunnett’ Multiple Comparison post hoc test. Friedman repeated measures ANOVA with Dun’s Multiple Comparison post hoc test was used when variables were not normally distributed. Baseline and 12-month BMD data were compared using paired Student t tests. Spearman correlations were used to test associations between EV phenotypes in serum at each time point separately (baseline, early and late time points). All data are expressed as means ± SD, unless otherwise indicated. Values of P ≤0.05 were considered statistically significant. All p-values are two-sided.
Results
Demographics and clinical course
Of 15 enrolled participants, 40% were male, 54% Hispanic and 40% Caucasian, with a mean age of 42.7 ± 11.4 years. The mean entry CD4+ T-cell count and HIV-1 RNA were 345 ± 168 cells/μL and 177,000 ± 234,000 copies/mL, respectively. Average duration from HIV diagnosis to enrollment into study and initiation of ART was 88.8 months. Of the 15 participants, 9 initiated ART with a fixed dose of tenofovir disoproxil fumarate (TDF)/emtricitabine (FTC) in combination with efavirenz, 4 with TDF/FTC/rilpivirine, 1 with TDF/FTC/ ritonavir/darunavir, and 1 with TDF/FTC/raltegravir. Detailed demographic and baseline clinical characteristics are shown in Table 1. BMD declined significantly from baseline to 12 months in the lumbar spine (−2.6% ±1.9), total hip (−4.3% ± 2.9) and femoral neck (−3.7% ± 3.6) after ART initiation (Fig. 1).
Table 1:
Baseline characteristics of the study population.
| Subject Characteristics (N=15) | Value (mean ± SD) |
|---|---|
| Demographics | |
| Male, N (%) | 6 (40) |
| Age, yrs | 42.7 ± 11.4 |
| Race | |
| African American, N (%) | 1 (6.7) |
| Hispanic, N (%) | 8 (53.3) |
| Caucasian, N (%) | 6 (40) |
| BMI (kg/m2) | 26.8 ± 5.9 |
| DXA whole body fat (%)a | 31.7 ± 12.8 |
| DXA trunk fat (%)a | 31.5 ± 13.5 |
| HIV-related | |
| AIDS diagnosis, N (%) | 4 (27) |
| CD4+ T cell count nadir (cells/μL) | 320 ± 201 |
| CD4+ T cell count baseline (cells/μL) | 345 ± 168 |
| HIV viral load, copies/mL | 177 000 ± 234 000 |
| Baseline Z-scores | |
| Lumbar spine | 0.4 ± 1.0 |
| Total hip | 0.8 ± 0.8 |
| Femoral neck | 0.8± 0.9 |
| Baseline T-scores | |
| Lumbar spine | − 0.1 ± 1.0 |
| Total hip | 0.5 ± 0.9 |
| Femoral neck | 0.3 ± 0.9 |
| Biochemical markers | |
| PTH (pg/mL) | 45.5 ± 21.3 |
| 25-OHD (ng/mL) | 24.1 ± 6.5 |
| 1,25 (OH)3D (pg/mL) | 50.4 ± 22.1 |
| IL-6 (pg/mL) | 2.7 ± 1.3 |
| TNF-α (pg/mL) | 27.3 ± 33.5 |
| P1NP (ng/mL) | 45.1 ± 18.1 |
| Osteocalcin (ng/mL) | 13.0 ± 8.6 |
| CTx (ng/mL) | 0.26 ± 0.17 |
| Medical history | |
| Smoking, past or present, N (%) | 1 (6.7) |
| Alcohol, >1 drink/day, N (%) | 3 (20) |
| postmenopausal, N (%) | 4 (26.6) |
| Diabetes, N (%) | 1 (6.7) |
| Hepatitis C virus seropositive, N (%) | 0 (0) |
Certain measures were not available for all subjects: DXA whole body fat and trunk fat, n=14. Results are reported as mean values ± SD. Reference ranges: total 25OHD, normal levels >20 ng/mL; 1,25OHD, normal levels 25-66 pg/mL; PTH, 11-67 pg/mL; IL-6, 0.447-9.96 pg/mL; TNF-α, ND-4.71 pg/mL; P1NP, 19-83 μg/dL in premenopausal women; osteocalcin, 8.4-33.9.0 ng/mL in premenopausal women; CTx, 0.112-0.738 ng/mL in premenopausal women. Bone mass normal ranges: T-score standard deviation up to −1.00. Z-score > −2.0 within the expected range for age. Abbreviations: BMI, body mass index; DXA, dual-energy X-ray absorptiometry.
Figure 1: Significant change in bone mineral density at 12 months after ART initiation.
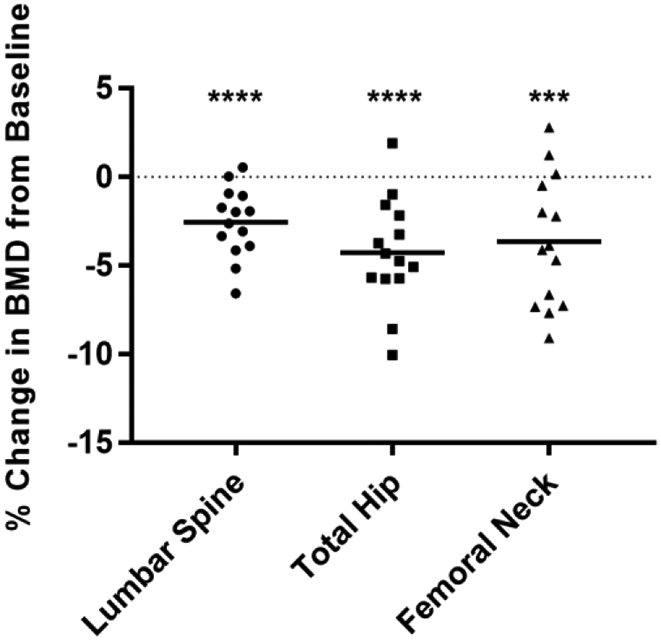
A significant decrease in BMD (%) was observed from baseline to 12 months at the lumbar spine, total hip and femoral neck. The dotted line at zero represents the baseline BMD. Dots represent individual participants (n=14) and bars represent mean ± SD, Student t test was used for paired comparisons. ***p<0.001; ****p<0.0001.
ART initiation promotes an increase in serum and EV-derived osteocalcin
Polystyrene beads ranging from 100 to 1,000 nm range were used to set EV sizing gates. The gates were set just below the 100 nm bead signal up to the 1,000 nm bead signal on the SSC channel (Fig. 2a). We examined if specific subsets of EVs expressed markers that are related to bone metabolism (OC, RANK, RANKL, M-CSF, and CD34) (Fig. 2b). There was minimal RANK-RANKL co-expression on individual EVs. Not surprisingly, the lack of co-expression with either CD34 or M-CSF are consistent with EVs expressing these markers being generated from separate cell types [40,41].
Figure 2: ART initiation drives bone resorption and elicits a compensatory increase in serum and EV-derived bone formation.


(A) SSC-H dot plot showing sensitivity to detect beads ≥100 nm (left panel) and representative EV gating from the threshold to the 1,000 nm gate based on SSC. (B) Representative plots showing EVs detected by flow cytometry and their cell of origin based on established surface markers (Osteocalcin, M-CSF, RANKL, CD34, CD254 on osteoblasts, and RANK on osteoclasts. (C) Scatter plots showing EVs/μL numbers (log 10-transformed). There were no significant differences in total EV concentration between baseline, early and late time points by Friedman Repeated Measures ANOVA and Dunn’s Multiple Comparison post hoc test. (D) Levels of EVs/μL (left plot) and change relative to baseline (right plot) are shown. (E) Serum bone metabolism markers (ng/mL; pg/mL) were quantified at each time point and shown as log values (left) or change relative to baseline (right). *p<0.05; **p<.005; ***p≤.0001 by Repeated Measures one-way ANOVA with the Greenhouse-Geisser correction and Dunnett’s Multiple Comparison post hoc test. Error bars represent SEM.
Next we examined whether the concentration of total EVs and bone related EVs changed after ART initiation. There were no significant differences in total EV concentration between baseline, early, and late time points (Fig. 2c). Levels of OC+EVs increased 130% from baseline to the early time point and 320% to the late time point (Fig. 2d). RANKL+EVs increased 110% from baseline to the late time point, although this change did not reach statistical significance (p=0.08). There were no significant changes in levels of EVs expressing RANKor CD34.
Serum OC levels increased 26% from baseline to the early time point and 68% from baseline to the late time point (Fig. 2e). P1NP levels increased 20% from baseline to the early time point and 95% from baseline to the late time point. CTx levels also increased 120% from baseline to the early time point and 175% from baseline to the late time point. The pro-inflammatory cytokine TNF-α decreased 47% after ART initiation, while there was no change in IL-6 levels. There was no significant change in serum PTH. These results show that both EV and soluble serum markers of bone metabolism changed after initiation of ART, with the largest fold-change seen in OC+EVs.
Correlation between EV phenotypes and bone turnover markers
We examined correlations between bone related EV phenotypes and bone turnover markers at baseline and after initiation of ART. At baseline, serum bone formation and resorption markers were highly correlated, reflecting a coupled process of bone formation and resorption: OC and CTx (r=0.84, p<0.001), and P1NP and CTx (r=0.79, p<0.001). Bone formation and resorption markers remained highly correlated at the early time points [OC and CTx (r=0.71, p=0.004) and P1NP and CTx (r=0.93, p<0.001)] and late time points [OC and CTx (r=0.71, p=0.004), and P1NP and CTx (r=0.69, p=0.006)].
At baseline, there were no significant correlations between EV phenotypes, but after ART initiation, the correlations became significant. The correlation between RANKL+EVs and OC+EVs was significant at the early (r=0.67, p=0.01) and late time points (r=0.64, p=0.01, respectively). RANK+EVs and OC+EVs were also significantly correlated at the late time point (r=0.58, p=0.03). A strong relationship was found between M-CSF+EVs and RANKL+EVs at the early time point (r=0.75, p=0.002) and between M-CSF+EVs and CD34+EVs at the late time point (r=0.90, p<.0001). While correlations between EV phenotypes were not significant at every time point, the tightest association was found at the early time point post-ART initiation.
At baseline, OC+EV and RANKL+EV levels did not correlate with either serum OC or P1NP levels. Similarly, RANK+EV did not correlate with CTx. At the early time point, OC+EV levels did not correlate with any bone turnover markers, in spite of the fact that OC+EV and serum OC levels both rose after ART initiation. There was a negative correlation between RANKL+EV and serum OC (r=−0.71, p=0.004), serum P1NP (−0.55, p=0.04), and serum CTx (r=−0.71, p=0.003). At the early time point, RANK+EV still did not correlate with CTx levels.
Early increases in levels of bone related EVs are associated with decreases in total hip BMD after ART initiation
We next examined whether changes in levels of bone-related EVs correlated with changes in lumbar spine or hip BMD. Changes in level of serum bone turnover marker levels (OC, P1NP, CTx) did not correlate with changes in BMD after ART initiation. In contrast, decreases in TNF-α from baseline to the early time point correlated with decrease in lumbar spine BMD at 12 months (r=0.67, p=0.01).
We found negative correlations between change in OC+EVs, RANKL+EVs, RANK+EVs, and CD34+EVs from baseline to the early time point and change in total hip BMD from baseline to 12 months (Fig. 3a). These data suggest that increases in bone related EV phenotypes are associated with decreases in total hip BMD. The correlations between bone related EVs and BMD at the lumbar spine and femoral neck did not reach significance, although the direction of association was the same (data not shown). Total hip BMD loss at 12 months was also associated with increase in CD34+EVs from baseline to the late time point, and increases in M-CSF+EV levels from baseline to the late time point were associated with decreases in femoral neck BMD (Fig. 3b). In summary, increases in levels of several different bone related EV markers were associated with decreases in BMD, while none of the classic soluble markers of bone turnover correlated with degree of bone loss.
Figure 3: Early changes in levels of bone-derived EVs are associated with the magnitude of change in total hip at 12 months.
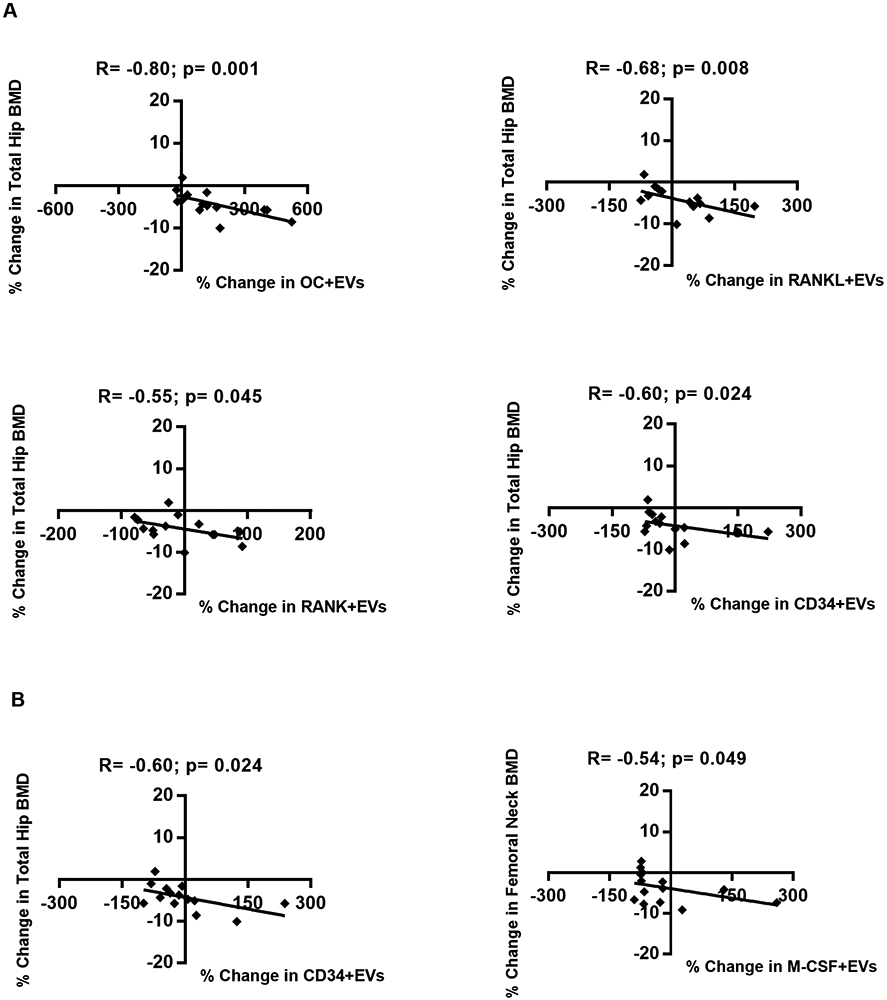
Scatters plots demonstrating the associations between (A) early changes and (B) late changes in levels of EVs expressing bone markers and BMD. Spearman correlation coefficient (R) and significance (p) are indicated in the corresponding boxes. Dots represent individual patients.
Discussion
To the best of our knowledge, this study provides the first evidence that early increases in levels of serum bone related EVs are associated with decreases in BMD associated with ART initiation in people living with HIV (PLWH). The mechanism by which HIV and ART leads to alterations in the immune-skeletal interface remains uncertain, despite well designed studies with bone turnover markers and immune parameters. Future studies including EV phenotypes may help to clarify signaling mechanisms driving bone loss with ART initiation, or find that certain EV phenotypes can be utilized as biomarkers that can help to predict which individuals are at highest risk of bone loss or fracture with ART.
Definitive markers for osteoblast-derived EVs and osteoclast-derived EVs have not been established. In vitro studies of osteoblast cell lines have shown that EVs shed from osteoblasts have RANKL on their surface [13], as well as other proteins such as bone sialoprotein, osteocalcin, osteopontin, and osteonectin [35]. In vitro studies of osteoclast cell lines demonstrate that EVs released from osteoclasts have RANK [13] as well as other proteins such as ephirin A2 [22], tartrate-resistant acid phosphatase(TRAcP5), and sema4D [21]. Osteoclast-derived EVs also carry various microRNAs (miRNAs) which have been shown to be able to regulate gene expression target cells after the EVs fuse with target cellular membranes, allowing miRNAs to be internalized and bind to mRNAs. Several miRNAs have been identified as relevant for osteoclast and osteoblast regulation [21,36,42-45].
Very few studies have characterized EVs using clinical specimens. In a study of exosomes from sera of elderly individuals with and without osteoporosis, Xie et al. identified between-group differences in candidate proteins using a proteomic approach [24], but did not identify RANKL, RANK and OC in their EV proteomic analyses. Given the lack of EV data from clinical specimens, we characterized RANKL+EV and OC+EVs as osteoblast-derived EVs, and RANK+EVs as osteoclast-derived EVs based upon existing in vitro studies. Before ART initiation, there were no significant correlations between EVs and bone turnover markers. At the early time point after ART initiation, RANKL+EVs, a putative osteoblast-derived EV, had a negative correlation with both bone formation and resorption markers; whereas, correlations between the other osteoblast-derived EV (OC+EV) and the putative osteoclast-derived EV (RANK+EV) and respective bone formation and resorption markers remained not significant.
Since EVs reflect the function of parent cells [16,23], an inverse relationship between RANKL+EV and serum OC and P1NP at the early time point was unexpected. Similarly, if RANKL+EVs were capable of inducing osteoclastogenesis and osteoclastic resorption, we would have expected to find a positive correlation between RANKL+EV and CTx levels. In contrast to bone turnover marker data, increases in the osteoblast-derived EVs (OC+EVs and RANKL+EVs) and osteoclast-derived EVs (RANK+EVs) correlated with decreases in total hip BMD. Our data are consistent with an in vitro study in which RANKL-containing EVs derived from osteoblasts stimulate osteoclast formation [16]. Our data show that OC+EVs and RANKL+ EVs increase after ART initiation, but that RANK+ EVs do not increase. Given that RANK+ EVs secreted by activated osteoclasts can stimulate osteoblast function through inside-out signaling [31], the relative imbalance between RANKL and RANK expressing EVs could cause greater activation of osteoclasts than osteoblasts, resulting in net bone resorption (Fig. 4).
Figure 4: Proposed model for effect of changes in levels of EV-derived bone markers after ART initiation.

This model indicates the major activities of EVs to the potential crosstalk between bone cells. HIV infection leads to a proinflammatory state, and ART initiation decreases levels of TNF-α and drives elevated bone resorption (CTx marker). ART initiation may inhibit the ability of RANK+EV generation by osteoclasts. The high-affinity RANKL-RANK interaction and increased levels of RANKL+EV could increase osteoclastogenesis by binding to RANK and facilitate osteoclast formation. Changes in levels of circulating EVs expressing markers of bone metabolism associate with bone loss and may contribute to elevate bone remodeling.
Similar to our study, others have also found that BMD decreases within 12 months after initiating ART [1-3], with significant upregulation in osteoclastic bone resorption measured by serum CTx [10]. We and others found that ART initiation was associated with decreased TNF-α levels [47-49]. Although some studies have found that IL-6 decreases after ART initiation [50,51], these findings are not consistent among different studies [52,53]. However, we observed that decreasing levels serum TNF-α after ART initiation were associated with decreased lumbar spine BMD.
While provocative, our current study has several limitations. The relatively small sample size of PLWH reduced our power to detect other potentially relevant associations, and not all samples were available at each time point. Of 15 participants, 4 were ≥ 50-years-old and post-menopausal. We did not investigate whether EVs expressing other markers, such as osteoprotegerin (OPG) or immune activation markers, might be shed into the circulation and also predict the bone loss. We did not measure the concentration of soluble RANK, RANKL and OPG, which might have detected a relationship with changes in BMD when the classical bone turnover markers did not. Of note, we did not measure the phenotype of EVs <200 nm in size due to technical limitations of flow cytometry. It is possible that exploration of smaller EVs using alternative techniques would reveal information that would complement the current study.
Future studies are required to understand the cell of origin for EVs expressing markers of bone activity, and the precise mechanism of effect on bone cells in PLWH on ART treatment. It will be of interest to extend our findings with a prospective longitudinal study determining whether the bone EV markers identified as well as other EV phenotypes are predictive of changes in BMD, and to perform in vitro or in vivo experiments to determine if ART affects the balance between RANK and RANKL expressing EVs. Our observations suggest that EVs may serve as novel serum biomarkers for measuring bone remodeling and potentially be a better candidate predictor for HIV-related bone loss than classic bone turnover markers. Elucidating the role of EVs in bone metabolism related to HIV infection could lay the foundation for novel strategies to diagnose and treat abnormalities in bone homeostasis in HIV and other disease process.
Acknowledgments
EGMM designed and performed experiments, analyzed data, and wrote the manuscript, JR analyzed data, MB provided clinical samples and edited the manuscript, ES provided clinical samples and edited the manuscript, MTY designed experiments, provided clinical samples, and edited the manuscript, PJN designed experiments and edited the manuscript. This work was supported by RO1 AI1065200 (ES); K23 AI059884 (MTY).
Erika Grasiela Marques de Menezes would like to thank the Sao Paulo Research Foundation (FAPESP) for the support provided for grant #2015/12965-6.
Funding sources: NIH RO1 AI1065200 (ES); K23 AI059884 (MTY); Sao Paulo Research Foundation (FAPESP) for the support provided for grant #2015/12965-6 (EGMM).
Footnotes
The authors declare no competing interests.
References
- 1.Brown TT, McComsey GA, King MS, Qaqish RB, Bernstein BM, da Silva BA. Loss of Bone Mineral Density After Antiretroviral Therapy Initiation, Independent of Antiretroviral Regimen. JAIDS J Acquir Immune Defic Syndr 2009; 51:554–561. [DOI] [PubMed] [Google Scholar]
- 2.Stellbrink H, Orkin C, Arribas JR, Compston J, Gerstoft J, Van Wijngaerden E, et al. Comparison of Changes in Bone Density and Turnover with Abacavir-Lamivudine versus Tenofovir-Emtricitabine in HIV-Infected Adults: 48-Week Results from the ASSERT Study. Clin Infect Dis 2010; 51:963–972. [DOI] [PubMed] [Google Scholar]
- 3.McComsey GA, Kitch D, Daar ES, Tierney C, Jahed NC, Tebas P, et al. Bone Mineral Density and Fractures in Antiretroviral-Naive Persons Randomized to Receive Abacavir-Lamivudine or Tenofovir Disoproxil Fumarate-Emtricitabine Along With Efavirenz or Atazanavir-Ritonavir. AIDS Clinical Trials Group A5224s, a Substudy of ACTG A5202. J Infect Dis 2011; 203:1791–1801. [DOI] [PMC free article] [PubMed] [Google Scholar]
- 4.Yin MT, Kendall MA, Wu X, Tassiopoulos K, Hochberg M, Huang JS, et al. Fractures after antiretroviral initiation. AIDS 2012; 26:2175–2184. [DOI] [PMC free article] [PubMed] [Google Scholar]
- 5.Vikulina T, Fan X, Yamaguchi M, Roser-Page S, Zayzafoon M, Guidot DM, et al. Alterations in the immuno-skeletal interface drive bone destruction in HIV-1 transgenic rats. Proc Natl Acad Sci 2010; 107:13848–13853. [DOI] [PMC free article] [PubMed] [Google Scholar]
- 6.Desai S, Landay A. Early Immune Senescence in HIV Disease. Curr HIV/AIDS Rep 2010; 7:4–10. [DOI] [PMC free article] [PubMed] [Google Scholar]
- 7.Ofotokun I, McIntosh E, Weitzmann MN. HIV: Inflammation and Bone. Curr HIV/AIDS Rep 2012; 9:16–25. [DOI] [PMC free article] [PubMed] [Google Scholar]
- 8.Chew N, Tan E, Li L, Lim R. HIV-1 tat and rev upregulates osteoclast bone resorption. J Int AIDS Soc 2014; 17:19724. [DOI] [PMC free article] [PubMed] [Google Scholar]
- 9.Titanji K, Vunnava A, Sheth AN, Delille C, Lennox JL, Sanford SE, et al. Dysregulated B Cell Expression of RANKL and OPG Correlates with Loss of Bone Mineral Density in HIV Infection. PLoS Pathog 2014; 10:e1004497. [DOI] [PMC free article] [PubMed] [Google Scholar]
- 10.Ofotokun I, Titanji K, Vunnava A, Roser-Page S, Vikulina T, Villinger F, et al. Antiretroviral therapy induces a rapid increase in bone resorption that is positively associated with the magnitude of immune reconstitution in HIV infection. AIDS 2016; 30:405–414. [DOI] [PMC free article] [PubMed] [Google Scholar]
- 11.Brown TT, Moser C, Currier JS, Ribaudo HJ, Rothenberg J, Kelesidis T, et al. Changes in Bone Mineral Density After Initiation of Antiretroviral Treatment With Tenofovir Disoproxil Fumarate/Emtricitabine Plus Atazanavir/Ritonavir, Darunavir/Ritonavir, or Raltegravir. J Infect Dis 2015; 212:1241–1249. [DOI] [PMC free article] [PubMed] [Google Scholar]
- 12.Havens PL, Stephensen CB, Van Loan MD, Schuster GU, Woodhouse LR, Flynn PM, et al. Decline in Bone Mass With Tenofovir Disoproxil Fumarate/Emtricitabine Is Associated With Hormonal Changes in the Absence of Renal Impairment When Used by HIV-Uninfected Adolescent Boys and Young Men for HIV Preexposure Prophylaxis. Clin Infect Dis 2017; 64:317–325. [DOI] [PMC free article] [PubMed] [Google Scholar]
- 13.Huynh N, VonMoss L, Smith D, Rahman I, Felemban MF, Zuo J, et al. Characterization of Regulatory Extracellular Vesicles from Osteoclasts. J Dent Res 2016; 95:673–679. [DOI] [PMC free article] [PubMed] [Google Scholar]
- 14.Lian JB, Stein GS, van Wijnen AJ, Stein JL, Hassan MQ, Gaur T, et al. MicroRNA control of bone formation and homeostasis. Nat Rev Endocrinol 2012; 8:212–227. [DOI] [PMC free article] [PubMed] [Google Scholar]
- 15.Cappariello A, Loftus A, Muraca M, Maurizi A, Rucci N, Teti A. Osteoblast-Derived Extracellular Vesicles Are Biological Tools for the Delivery of Active Molecules to Bone. J Bone Miner Res 2018; 33:517–533. [DOI] [PubMed] [Google Scholar]
- 16.Deng L, Wang Y, Peng Y, Wu Y, Ding Y, Jiang Y, et al. Osteoblast-derived microvesicles: A novel mechanism for communication between osteoblasts and osteoclasts. Bone 2015; 79:37–42. [DOI] [PubMed] [Google Scholar]
- 17.Caby M-P, Lankar D, Vincendeau-Scherrer C, Raposo G, Bonnerot C. Exosomal-like vesicles are present in human blood plasma. Int Immunol 2005; 17:879–887. [DOI] [PubMed] [Google Scholar]
- 18.Cortez MA, Calin GA. MicroRNA identification in plasma and serum: a new tool to diagnose and monitor diseases. Expert Opin Biol Ther 2009; 9:703–711. [DOI] [PubMed] [Google Scholar]
- 19.Pisitkun T, Shen R-F, Knepper MA. Identification and proteomic profiling of exosomes in human urine. Proc Natl Acad Sci 2004; 101:13368–13373. [DOI] [PMC free article] [PubMed] [Google Scholar]
- 20.Patel DB, Gray KM, Santharam Y, Lamichhane TN, Stroka KM, Jay SM. Impact of cell culture parameters on production and vascularization bioactivity of mesenchymal stem cell-derived extracellular vesicles. Bioeng Transl Med 2017; 2:170–179. [DOI] [PMC free article] [PubMed] [Google Scholar]
- 21.Li D, Liu J, Guo B, Liang C, Dang L, Lu C, et al. Osteoclast-derived exosomal miR-214-3p inhibits osteoblastic bone formation. Nat Commun 2016; 7:10872. [DOI] [PMC free article] [PubMed] [Google Scholar]
- 22.Sun W, Zhao C, Li Y, Wang L, Nie G, Peng J, et al. Osteoclast-derived microRNA-containing exosomes selectively inhibit osteoblast activity. Cell Discov 2016; 2. doi: 10.1038/celldisc.2016.15 [DOI] [PMC free article] [PubMed] [Google Scholar]
- 23.Yuan F-L, Wu Q, Miao Z-N, Xu M-H, Xu R-S, Jiang D-L, et al. Osteoclast-Derived Extracellular Vesicles: Novel Regulators of Osteoclastogenesis and Osteoclast–Osteoblasts Communication in Bone Remodeling. Front Physiol 2018; 9. doi: 10.3389/fphys.2018.00628 [DOI] [PMC free article] [PubMed] [Google Scholar]
- 24.Xie Y, Gao Y, Zhang L, Chen Y, Ge W, Tang P. Involvement of serum-derived exosomes of elderly patients with bone loss in failure of bone remodeling via alteration of exosomal bone-related proteins. Aging Cell 2018; 17:e12758. [DOI] [PMC free article] [PubMed] [Google Scholar]
- 25.Yáñez-Mó M, Siljander PR-M, Andreu Z, Zavec AB, Borràs FE, Buzas EI, et al. Biological properties of extracellular vesicles and their physiological functions. J Extracell Vesicles 2015; 4:27066. [DOI] [PMC free article] [PubMed] [Google Scholar]
- 26.Handschin AE, Egermann M, Trentz O, Wanner GA, Kock H-J, Zünd G, et al. Cbfa-1 (Runx-2) and osteocalcin expression by human osteoblasts in heparin osteoporosis in vitro. Clin Appl Thromb Off J Int Acad Clin Appl Thromb 2006; 12:465–472. [DOI] [PubMed] [Google Scholar]
- 27.Chen JL, Hunt P, McElvain M, Black T, Kaufman S, Choi ES. Osteoblast precursor cells are found in CD34+ cells from human bone marrow. Stem Cells Dayt Ohio 1997; 15:368–377. [DOI] [PubMed] [Google Scholar]
- 28.Yao G-Q, Sun BH, Weir EC, Insogna KL. A role for cell-surface CSF-1 in osteoblast-mediated osteoclastogenesis. Calcif Tissue Int 2002; 70:339–346. [DOI] [PubMed] [Google Scholar]
- 29.Atkins GJ, Kostakis P, Pan B, Farrugia A, Gronthos S, Evdokiou A, et al. RANKL expression is related to the differentiation state of human osteoblasts. J Bone Miner Res Off J Am Soc Bone Miner Res 2003; 18:1088–1098. [DOI] [PubMed] [Google Scholar]
- 30.Meednu N, Zhang H, Owen T, Sun W, Wang V, Cistrone C, et al. Production of RANKL by Memory B Cells: A Link Between B Cells and Bone Erosion in Rheumatoid Arthritis. Arthritis Rheumatol Hoboken NJ 2016; 68:805–816. [DOI] [PMC free article] [PubMed] [Google Scholar]
- 31.Wang R, Zhang L, Zhang X, Moreno J, Celluzzi C, Tondravi M, et al. Regulation of activation-induced receptor activator of NF-kappaB ligand (RANKL) expression in T cells. Eur J Immunol 2002; 32:1090–1098. [DOI] [PubMed] [Google Scholar]
- 32.Atkins GJ, Kostakis P, Vincent C, Farrugia AN, Houchins JP, Findlay DM, et al. RANK Expression as a cell surface marker of human osteoclast precursors in peripheral blood, bone marrow, and giant cell tumors of bone. J Bone Miner Res Off J Am Soc Bone Miner Res 2006; 21:1339–1349. [DOI] [PubMed] [Google Scholar]
- 33.Anderson DM, Maraskovsky E, Billingsley WL, Dougall WC, Tometsko ME, Roux ER, et al. A homologue of the TNF receptor and its ligand enhance T-cell growth and dendritic-cell function. Nature 1997; 390:175–179. [DOI] [PubMed] [Google Scholar]
- 34.Rao S, Sigl V, Wimmer RA, Novatchkova M, Jais A, Wagner G, et al. RANK rewires energy homeostasis in lung cancer cells and drives primary lung cancer. Genes Dev 2017; 31:2099–2112. [DOI] [PMC free article] [PubMed] [Google Scholar]
- 35.Xiao Z, Camalier CE, Nagashima K, Chan KC, Lucas DA, de la Cruz MJ, et al. Analysis of the extracellular matrix vesicle proteome in mineralizing osteoblasts. J Cell Physiol 2007; 210:325–335. [DOI] [PubMed] [Google Scholar]
- 36.Qin Y, Wang L, Gao Z, Chen G, Zhang C. Bone marrow stromal/stem cell-derived extracellular vesicles regulate osteoblast activity and differentiation in vitro and promote bone regeneration in vivo. Sci Rep 2016; 6:21961. [DOI] [PMC free article] [PubMed] [Google Scholar]
- 37.Ohyashiki JH, Umezu T, Ohyashiki K. Extracellular vesicle-mediated cell–cell communication in haematological neoplasms. Philos Trans R Soc B Biol Sci 2018; 373:20160484. [DOI] [PMC free article] [PubMed] [Google Scholar]
- 38.Baglio SR, Rooijers K, Koppers-Lalic D, Verweij FJ, Pérez Lanzón M, Zini N, et al. Human bone marrow- and adipose-mesenchymal stem cells secrete exosomes enriched in distinctive miRNA and tRNA species. Stem Cell Res Ther 2015; 6. doi: 10.1186/s13287-015-0116-z [DOI] [PMC free article] [PubMed] [Google Scholar]
- 39.Inglis HC, Danesh A, Shah A, Lacroix J, Spinella PC, Norris PJ. Techniques to improve detection and analysis of extracellular vesicles using flow cytometry: Accuracy and Efficiency of EV Detection Using FCM. Cytometry A 2015; 87:1052–1063. [DOI] [PMC free article] [PubMed] [Google Scholar]
- 40.Green M, Harrington MA. A comparison of macrophage colony-stimulating factor (M-CSF) gene expression in primary and immortalized endothelial cells. J Hematother Stem Cell Res 2000; 9:237–246. [DOI] [PubMed] [Google Scholar]
- 41.Lin G, Finger E, Gutierrez-Ramos JC. Expression of CD34 in endothelial cells, hematopoietic progenitors and nervous cells in fetal and adult mouse tissues. Eur J Immunol 1995; 25:1508–1516. [DOI] [PubMed] [Google Scholar]
- 42.Cui Y, Luan J, Li H, Zhou X, Han J. Exosomes derived from mineralizing osteoblasts promote ST2 cell osteogenic differentiation by alteration of microRNA expression. FEBS Lett 2016; 590:185–192. [DOI] [PubMed] [Google Scholar]
- 43.Furuta T, Miyaki S, Ishitobi H, Ogura T, Kato Y, Kamei N, et al. Mesenchymal Stem Cell-Derived Exosomes Promote Fracture Healing in a Mouse Model. Stem Cells Transl Med 2016; 5:1620–1630. [DOI] [PMC free article] [PubMed] [Google Scholar]
- 44.Qin Y, Peng Y, Zhao W, Pan J, Ksiezak-Reding H, Cardozo C, et al. Myostatin inhibits osteoblastic differentiation by suppressing osteocyte-derived exosomal microRNA-218: A novel mechanism in muscle-bone communication. J Biol Chem 2017; 292:11021–11033. [DOI] [PMC free article] [PubMed] [Google Scholar]
- 45.Xu J-F, Yang G, Pan X-H, Zhang S-J, Zhao C, Qiu B-S, et al. Altered MicroRNA Expression Profile in Exosomes during Osteogenic Differentiation of Human Bone Marrow-Derived Mesenchymal Stem Cells. PLoS ONE 2014; 9:e114627. [DOI] [PMC free article] [PubMed] [Google Scholar]
- 46.Ikebuchi Y, Aoki S, Honma M, Hayashi M, Sugamori Y, Khan M, et al. Coupling of bone resorption and formation by RANKL reverse signalling. Nature 2018; 561:195–200. [DOI] [PubMed] [Google Scholar]
- 47.Brown TT, Ross AC, Storer N, Labbato D, McComsey GA. Bone turnover, osteoprotegerin/RANKL and inflammation with antiretroviral initiation: tenofovir versus non-tenofovir regimens. Antivir Ther 2011; 16:1063–1072. [DOI] [PMC free article] [PubMed] [Google Scholar]
- 48.Stylianou, Aukrust, Kvale, Muller, Froland. IL-10 in HIV infection: increasing serum IL-10 levels with disease progression-down-regulatory effect of potent antiretroviral therapy. Clin Exp Immunol 1999; 116:115–120. [DOI] [PMC free article] [PubMed] [Google Scholar]
- 49.Haissman JM, Vestergaard LS, Sembuche S, Erikstrup C, Mmbando B, Mtullu S, et al. Plasma Cytokine Levels in Tanzanian HIV-1-Infected Adults and the Effect of Antiretroviral Treatment. JAIDS J Acquir Immune Defic Syndr 2009; 52:493–497. [DOI] [PubMed] [Google Scholar]
- 50.Siedner MJ, Bwana MB, Asiimwe S, Amanyire G, Musinguzi N, Castillo-Mancilla J, et al. Timing of Antiretroviral Therapy and Systemic Inflammation in Sub-Saharan Africa: Results From the META Longitudinal Cohort Study. J Infect Dis 2019; 220:1172–1177. [DOI] [PMC free article] [PubMed] [Google Scholar]
- 51.Grund B, Baker JV, Deeks SG, Wolfson J, Wentworth D, Cozzi-Lepri A, et al. Relevance of Interleukin-6 and D-Dimer for Serious Non-AIDS Morbidity and Death among HIV-Positive Adults on Suppressive Antiretroviral Therapy. PloS One 2016; 11:e0155100. [DOI] [PMC free article] [PubMed] [Google Scholar]
- 52.Regidor DL, Detels R, Breen EC, Widney DP, Jacobson LP, Palella F, et al. Effect of highly active antiretroviral therapy on biomarkers of B-lymphocyte activation and inflammation. AIDS 2011; 25:303–314. [DOI] [PMC free article] [PubMed] [Google Scholar]
- 53.de Paula HHS, Ferreira ACG, Caetano DG, Delatorre E, Teixeira SLM, Coelho LE, et al. Reduction of inflammation and T cell activation after 6 months of cART initiation during acute, but not in early chronic HIV-1 infection. Retrovirology 2018; 15:76. [DOI] [PMC free article] [PubMed] [Google Scholar]