

Abstract
Aim
The aim of the study was to investigate cognitive outcomes at 6.5 years in children born very preterm, in relation to neonatal characteristics and 2.5‐year neurodevelopment.
Methods
A prospective cohort, with gestational age 22.3‐31.9 weeks, born 2004‐2007, were examined at 2.5 years with the Bayley Scales of Infant and Toddler Development (Bayley‐III) (n = 100) and at 6.5 years with the Wechsler Intelligence Scales (n = 91).
Results
Neonatal factors independently related to 6.5‐year outcome were gestational age, retinopathy of prematurity and treated persistent ductus arteriosus. The Bayley‐III cognitive scores explained only 44% of the Full‐Scale Intelligence Quotient result at 6.5 years, and 22% of the children had Wechsler index results below −1 SD, indicating cognitive impairment, after average test results at 2.5 years. The relative risk to score below −1 SD on the Full‐Scale IQ was 2.83 (95% CI 1.45‐5.53) in children with gestational age below 28 weeks and 2.22 (95% CI 1.18‐4.17) at gestational age 28‐31 weeks.
Conclusion
Very preterm infants born in the 2000s had increased risks for impaired cognition at 6.5 years, but individual predictions based on neonatal risks and 2.5‐year test results were not enough to identify all high‐risk children.
Keywords: follow‐up, neurodevelopment, retinopathy of prematurity, visuomotor integration, Wechsler Intelligence Scales for Children 4th Edition
Abbreviations
- Bayley‐III
Bayley Scales of Infant and Toddler Development 3rd Edition
- EPT group
extremely preterm group
- EXPRESS
Extremely Preterm Infants in Sweden Study
- FSIQ
Full‐Scale Intelligence Quotient
- GA
gestational age
- LOVIS
longitudinal study of Visuomotor capacity
- PDA
persistent ductus arteriosus
- ROP
retinopathy of prematurity
- RR
relative risk
- VMI
Beery‐Buktenica test of Visuomotor Integration
- VPT group
very preterm group
- WISC‐IV
Wechsler Intelligence Scale for Children 4th Edition
- WPPSI‐III
Wechsler Preschool and Primary Scale of Intelligence 3rd Edition
Key Notes.
There is a need for data on long‐term cognitive outcomes in children born very preterm in the 2000s.
In very preterm children, born before 32 gestational weeks in 2004‐2007, the risk for cognitive impairment at 6.5 years was increased but cognitive test scores at 2.5 years only explained 44% of intelligence score variance at 6.5 years.
Follow‐up should continue into school age for all children born very preterm.
1. INTRODUCTION
Survival rates have improved for very preterm infants during the past two decades. 1 , 2 Still, the risks of neonatal complications continue to be relatively high, especially in extremely preterm infants with gestational ages (GA) below 28 weeks, and there are no indications of improvements in neurodevelopmental outcomes. 3 , 4 The research focus has been on factors affecting neurodevelopment in the most immature infants 5 and less is known about long‐term outcomes for more mature very preterm infants, with a GA of 28‐31 weeks, who were born in the 2000s. 6 , 7 , 8 Although these children are expected to have better outcomes than the extremely preterm children, they still have higher risks of neurodevelopmental difficulties than term‐born children. 2 , 6
Given the well‐known risks in these children, preschool follow‐up programmes have been established in many centres aiming at early detection of children in need of neurodevelopmental support. In the current study, we compared cognitive test results at 2.5 and 6.5 years in a regional cohort of children born very preterm during the years 2004‐2007 and after active perinatal management at the lowest GA. 9 We divided the cohort in two groups: extremely preterm infants with a GA of 22‐27 weeks and very preterm infants with a GA of 28‐31 weeks. We hypothesised that not only extremely preterm infants but also the more mature very preterm infants would be at significant risk of later neurodevelopmental problems. Thus, the aim of this study was twofold: firstly to compare neurodevelopmental results at 2.5 and 6.5 years in children born very preterm, and secondly to explore factors related to cognitive impairments at 6.5 years.
2. PATIENTS AND METHODS
This was a prospective population‐based study including very preterm children born in Uppsala County during a 4‐year period, 2004‐2007. Of 145 eligible children, 113 were recruited in the neonatal period to the Longitudinal study of Visuomotor capacity (LOVIS). 10 Four children died, leaving 109 infants with a GA of 22.3‐31.9 weeks and birthweights 520‐2030 g in the LOVIS cohort (Figure 1). The children were divided in an extremely preterm group (EPT) with a GA of below 28 weeks (31 children assessed at 2.5 years and 28 at 6.5 years) and a very preterm group (VPT) with a GA of 28‐31 weeks (69 children at 2.5 years and 63 children at 6.5 years). Neonatal data are presented in Table 1. Severe brain injury was defined as intraventricular haemorrhage grade 3‐4 and/or cystic periventricular leukomalacia on neonatal ultrasound. Persistent ductus arteriosus (PDA) was included if pharmacologically and/or surgically treated, and bronchopulmonary dysplasia was defined as a need for additional oxygen at 36 gestational weeks. No child received postnatal steroids. One child with severe brain injury and medically treated PDA received a ventriculoperitoneal shunt. Severe retinopathy of prematurity (ROP) refers to stages ≥ 3, treatment for ROP in six infants was performed according to ETROP criteria. 11 No child had necrotising enterocolitis.
Figure 1.
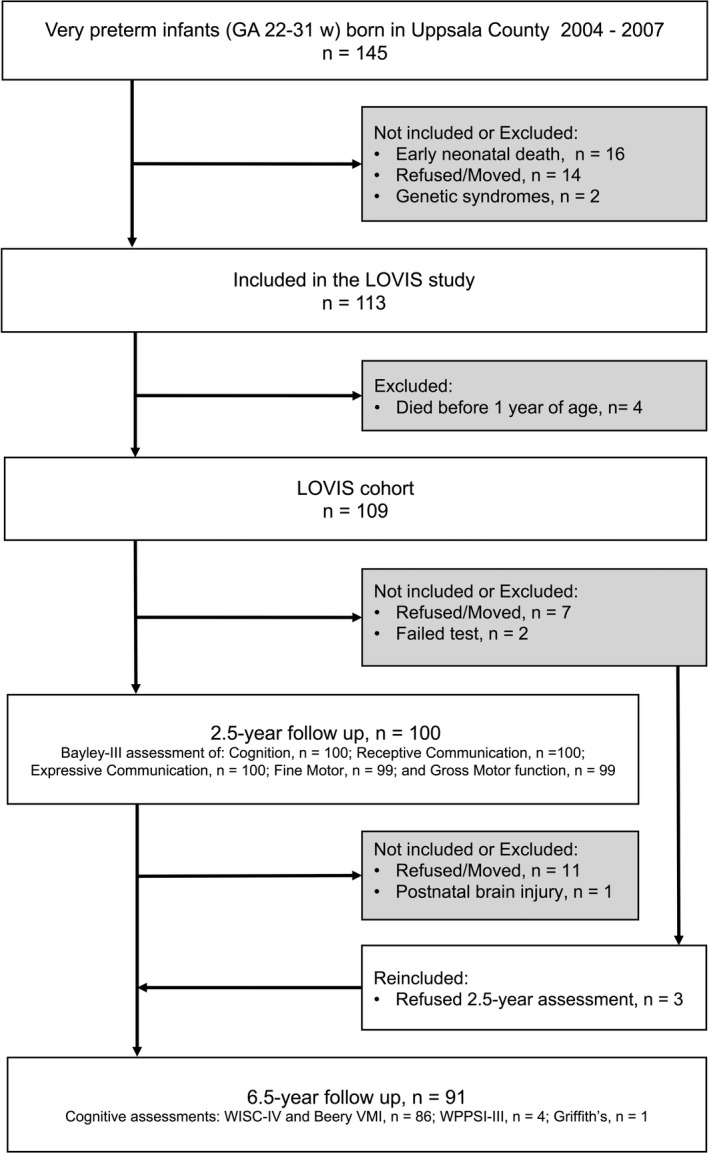
Flowchart of the LOVIS (Longitudinal study of Visuomotor capacity) study group
Table 1.
Neonatal characteristics of the LOVIS (the Longitudinal study of Visuomotor capacity in very preterm‐born infants) cohort in infancy, and the two subgroups extremely preterm (EPT) with gestational age (GA) below 28 wk and very preterm (VPT) with GA 28‐31 wk, respectively), and for the LOVIS cohort at 2.5 and 6.5 y, respectively.
| LOVIS study population in infancy | LOVIS cohort at 2.5 y | LOVIS cohort at 6.5 y | |||
|---|---|---|---|---|---|
|
LOVIS GA < 32 w N = 113 |
EPT GA < 28 w N = 35 |
VPT GA 28‐31 w N = 78 |
GA < 32 w N = 100 |
GA < 32 w N = 91 |
|
| Antenatal steroids, n | 78 (69%) | 23 (66%) | 55 (71%) | 70 (70%) | 67 (74%) |
| Caesarean section, n | 68 (60%) | 22 (63%) | 46 (59%) | 60 (60%) | 50 (55%) |
| Multiple births, n | 35 (31%) | 9 (26%) | 26 (33%) | 30 (30%) | 26 (29%) |
| Gestational age, weeks | 28.7 (2.3) | 25.7 (1.6) | 30 (1.1) | 28.7 (2.4) | 28.6 (2.4) |
| Birthweight, g | 1198 (353) | 838 (220) | 1359 (272) | 1204 (350) | 1202 (346) |
| Small for gestational age, n | 22 (20%) | 5 (14%) | 17 (22%) | 17 (17%) | 14 (15%) |
| Female, n | 51 (45%) | 16 (46%) | 35 (45%) | 44 (44%) | 40 (44%) |
| Severe brain injury, n | 9 (8%) | 2 (6%) | 7 (9%) | 9 (9%) | 9 (10%) |
| Sepsis, n | 22 (20%) | 15 (43%) | 7 (9%) | 19 (19%) | 18 (20%) |
| BPD, n | 25 (22%) | 19 (54%) | 6 (8%) | 21 (21%) | 20 (22%) |
| PDA, n | 25 (22%) | 18 (51%) | 7 (9%) | 21 (21%) | 20 (22%) |
| ROP (any degree), n | 32 (28%) | 25 (71%) | 7 (9%) | 27 (27%) | 24 (26%) |
| Severe ROP (stage ≥ 3), n | 9 (8%) | 9 (26%) | 0 (0%) | 8 (8%) | 6 (7%) |
| Treated ROP, n | 6 (5%) | 6 (17%) | 0 (0%) | 6 (6%) | 4 (4%) |
Values are mean (standard deviations) or number (percentages). Severe brain injury was defined as intraventricular haemhorrage grade 3‐4 and/or cystic periventricular leukomalacia.
Abbreviations: BPD, bronchopulmonary dysplasia; PDA, persistent ductus arteriosus; ROP, retinopathy of prematurity.
At an age of 2.5 years, corrected for prematurity, neurodevelopment was assessed in 100 children with the Bayley Scales of Infant and Toddler Development (Bayley‐III) which includes five subscales: Cognition, Receptive and Expressive Communication, and Fine and Gross Motor function. At 6.5 years, cognitive outcomes were assessed in 91 children; 86 were tested with the Wechsler Intelligence Scale for Children, 4th edition (WISC‐IV) and the Beery‐Buktenica test of Visuomotor Integration (VMI), and four children were tested with the Wechsler Preschool and Primary Scale of Intelligence, 3rd edition (WPPSI‐III). The WPPSI‐III and WISC‐IV results were combined (Wechsler tests), since both tests provide a Full‐Scale Intelligence Quotient (FSIQ) comprised of index scores for Verbal Comprehension, Perceptual Reasoning, Processing Speed, and for the WISC‐IV also Working Memory. One child was assessed with the Griffith's Mental Development Scales‐Extended and performed at a neurodevelopmental level of 11 months. In order to include these data, the results were ascribed scores of 40 across the four WISC‐IV indices, as that is the lowest score possible. Thus, a total of 87 children had WISC‐IV scores, and all 91 children were included in the Wechsler scores. Altogether 88 children were assessed both at 2.5 and 6.5 years.
Of the children with a GA below 27 weeks, 18 also participated in the national EXPRESS study (Extremely Preterm infants in Sweden Study). 1 Results from term‐born EXPRESS controls in the Uppsala region (Bayley‐III 69 children and WISC‐IV 67 children) served as a reference group, with permission from the EXPRESS steering committee. Information about clinically diagnosed cerebral palsy and autism (diagnosis based on the Autism Diagnostic Observation Schedule) was retrieved from patient records. Information on maternal education, dichotomised as schooling 12 years or less vs more than 12 years, was available for 75 LOVIS children and 29 in the reference group.
A previous study of 98 LOVIS children at 2.5 years of age demonstrated that 12% had visual impairment, strabismus or refractive errors, but no child was blind. 12 At 6.5 years, 84 LOVIS children were examined showing an increasing prevalence of opthalmological dysfunctions. 13
The LOVIS study was approved by the regional research ethics committee in Uppsala (Ups 03‐665), and parents gave written consent.
2.1. Statistical analysis
Univariate linear regression analyses explored relations between neonatal characteristics (listed in Table 1) and the 2.5‐ and 6.5‐year test results, respectively, and statistically significant associations were further explored using multiple regression models adjusted for GA. Gestational age was chosen before birth weight in the analyses, since these two variables were closely interrelated. The univariate analyses were also used to decide the neonatal covariates in a hierarchical multivariate regression model to test the effects of neonatal factors and Bayley‐III results on the Wechsler scale and VMI results, respectively. Risk ratios (RR) were calculated for FSIQ only.
The outcome classification was based on the results of the reference group. Test scores (including subscales and indices) greater than or equal to −1 SD were defined as average, while scores below −1 SD were classified as impairment and scores below −2 SD as severe impairment. Consequently, the classification impairment (below −1 SD) also included the category severe impairment (below −2 SD). These categorisations were also used in Figure 3.
Figure 3.
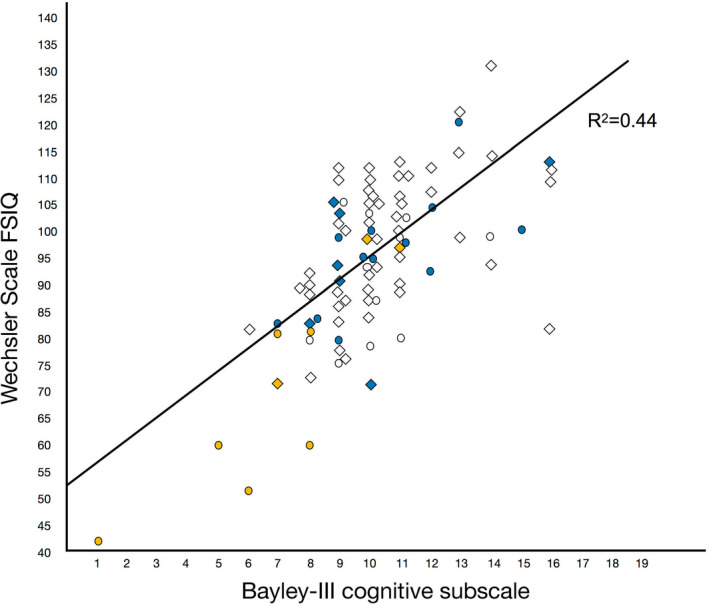
Plot and regression line of Wechsler Full‐Scale IQ (FSIQ) results at 6.5 y in relation to Bayley‐III Cognitive scaled scores at 2.5 y. Circles represent individual children with a gestational age (GA) below 28 weeks and diamonds children with a GA of 28‐31 wk. The colours denote each infant's number of neonatal factors (severe brain injury, ROP stage ≥ 3, bronchopulmonary dysplasia, PDA) (white = no neonatal conditions, blue = 1 and yellow = 2‐4 neonatal conditions)
For statistical analyses, SPSS Statistics, Version 25.0 (IBM Corp) was used with two‐tailed significance levels set to p < .05.
3. RESULTS
At 6.5 years, eight of the 91 (8.8%) children were diagnosed with cerebral palsy (four VPT and four EPT), and six (6.6%) had autism (four VPT and two EPT). Three of these children (two VPT and one EPT) had both cerebral palsy and autism. No child was blind or required hearing aids. The Bayley‐III and Wechsler test results are presented in Table 2, and categorical results (percentages beneath cut‐offs) in Table S1.
Table 2.
Neurodevelopmental test results at 2.5 and 6.5 y, respectively, for the whole LOVIS cohort and separately for the extremely preterm (EPT, GA < 28 wk) and very preterm (VPT, GA 28‐31 wk) subgroups in relation to reference data from a term‐born group
| Bayley‐III subscale scores at 2.5 y | EPT group | n | VPT group | n | LOVIS | n | Reference group | n |
|---|---|---|---|---|---|---|---|---|
| Cognition | 9.5 (2.7)** | 31 | 10.4 (2.2) | 69 | 10.1 (2.4)** | 100 | 11.0 (2.1) | 69 |
| Receptive communication | 10.1 (3.2)*** | 31 | 10.1 (3.2)* | 69 | 10.7 (2.8)** | 100 | 12.0 (2.3) | 69 |
| Expressive communication | 10.3 (3.6)** | 31 | 11.5 (3.4) | 69 | 11.1 (3.5)** | 100 | 12.5 (3.0) | 69 |
| Fine Motor | 10.6 (3.6)** | 30 | 11.9 (2.5) | 69 | 11.5 (2.9)* | 99 | 12.5 (2.7) | 69 |
| Gross Motor | 8.1 (2.2)** | 30 | 8.7 (2.6)** | 69 | 8.5 (2.5)** | 99 | 9.9 (2.9) | 69 |
| Wechsler Scales Index scores at 6.5 y | EPT group | n | VPT group | n | LOVIS | N | Reference group | n |
|---|---|---|---|---|---|---|---|---|
| Full‐Scale IQ | 87.6 (17.1)*** | 28 | 97.4 (13.0) | 63 | 94.4 (15.0)** | 91 | 99.6 (9.9) | 67 |
| Verbal Comprehension | 95.4 (18.9)** | 28 | 101.8 (11.8) | 63 | 99.8 (14.6)** | 91 | 105.6 (11.2) | 67 |
| Perceptual Reasoning | 91.8 (16.6)*** | 28 | 103.1 (14.2) | 63 | 99.6 (15.8) | 91 | 103.2 (10.0) | 67 |
| Working Memory | 79.4 (14.9)*** | 27 | 88 (11.9) | 60 | 85.3 (13.4)* | 87 | 90.2 (11.6) | 67 |
| Processing Speed | 87.8 (17.2)* | 28 | 94.2 (13.2) | 63 | 92.2 (14.8) | 91 | 94.2 (11.6) | 67 |
| VMI index score | 91.0 (14.6)** | 26 | 96.6 (14.9) | 60 | 95.0 (14.9)* | 86 | 100.7 (12.6) | 67 |
Working Memory and VMI were only available for children tested with the WISC‐IV. The number of infants (n) in each subtest varied slightly. Values are mean (standard deviations) and (ranges). Statistically significant difference between the preterm groups and the reference group are denoted: *** p < .001, **p < .01, *p < .05.
Bayley‐III (Bayley Scales of Infant and Toddler Development), Wechsler scales (combined test results from WISC‐IV, Wechsler Intelligence Scale for Children, and Wechsler Preschool and Primary Scale of Intelligence, WPPSI‐III), IQ (Intelligence Quotient), VMI (Beery‐Buktenica test of Visuomotor Integration).
3.1. Neurodevelopmental outcomes at 2.5 years
In the EPT group, 13 of 31 (41.9%) had two or more Bayley‐III results below −1 SD, and five (16.1%) had two or more results below −2 SD. In the 69 VPT children, the corresponding numbers were 23 (33.3%) and five (7.2%), respectively, as compared to 11 (15.9%) and one (1.4%) in the reference group.
3.2. Cognitive outcomes at 6.5 years
In the 28 EPT children, 16 (57.1%) had two or more results below −1 SD on the Wechsler sub‐indices (FSIQ not included) and five (17.8%) had two or more results below −2 SD. In the 63 VPT children, the corresponding figures were 23 (36.5%) and three (4.8%), respectively, compared to 9 (13.6%) and 2 (2.2%) in the reference group.
The relative risk (RR) for a FSIQ below −1 SD was significantly increased (RR 2.41, 95% CI 1.33‐4.38) among the LOVIS children, both in the EPT group (RR 2.83, 95% CI 1.45‐5.53) and in the VPT children (RR 2.22, 95% CI 1.18‐4.18). The corresponding figures for a FSIQ below −2 SD were RR 5.52, CI 95% 1.31‐23.34 in all children, for the EPT group RR 8.82, CI 95% 2.04‐38.15 and the VPT group RR 2.65, CI 95% 1.11‐13.21.
3.3. Relation between neonatal characteristics and cognitive outcomes
Table 3 shows a summary of the significant correlations between neonatal factors and the 2.5‐ and 6.5‐year results. In the univariate analyses, several significant associations were present between GA, severe brain injury, severe ROP, treated PDA and bronchopulmonary dysplasia, respectively, and the Wechsler index scores, FSIQ and VMI, but there were no effects on outcomes from mode of delivery, multiple birth, small for GA, infant sex or postnatal sepsis. When the two groups were analysed separately, multiple effects on the Wechsler scores and VMI were seen in the EPT group, including significant correlations with GA, birthweight, severe ROP, treated PDA, but not from bronchopulmonary dysplasia. Administration of antenatal steroids was associated with significantly better cognitive outcomes in the EPT group. In the VPT group, the number of significant correlations was much lower and only severe brain injury affected Processing Speed, while girls had higher scores on the VMI (Table S2).
Table 3.
Summary of statistically significant linear regressions between neonatal conditions and 2.5 as well as 6.5‐y outcome scores in 91 very preterm children tested with the WISC‐IV and WPPSI‐III univariate (unadjusted) and multivariate analyses adjusted for gestational age are presented.
| GA, w | Severe brain injury | Severe ROP | Treated PDA | BPD | |||||
|---|---|---|---|---|---|---|---|---|---|
| Unadjusted | Unadjusted | Adjusted | Unadjusted | Adjusted | Unadjusted | Adjusted | Unadjusted | Adjusted | |
| 2.5‐y results | |||||||||
| Cognition | 0.3** (0.1; 0.4) | −3.5 *** (−5.2; −1.8) | −2.8** (−4.9; −0.8) | −5.7* (−11.3; −0.05) | |||||
| Receptive Communication | 0.3* (0.0; 0.5) | −3.0** (−5.2; −0.9) | |||||||
| Expressive Communication | 0.4* (0.1; 0.6) | −3.9** (−6.6; −1.3) | |||||||
| Fine Motor | 0.3** (0.1; 0.6) | −4.3*** (−6.5; −2.2) | −3.8** (−6.4; −1.3) | −1.6* (−3.0; −0.1) | −2.1* (−3.5; −0.7) | ||||
| Gross Motor | −1.4* (−2.7; −0.1) | −1.3* (−2.6; −0.0) | −3.5*** (−5.2; −1.8) | −2.8** (−4.9; −0.8) | |||||
| 6.5‐yr results | |||||||||
| Full‐Scale IQ | 2.6*** (1.3; 3.8) | −29.0*** (−40.0; −17.9) | −22.5*** (−35.7; −9.2) | −13.4*** (−20.5; −6.4) | −8.2* (−16.1; −0.2) | −8.2* (−15.6; −0.9) | |||
| Verbal Comprehension | 2.05** (0.8; 3.3) | −21.0*** (−32.5; −9.6) | −14.8* (−28.5; −1.1) | −10.7** (−17.7; −3.7) | |||||
| Perceptual Reasoning | 2.4*** (1.1; 3.7) | −27.6*** (−39.6; −15.7) | −21.8** (−36.2; −7.4) | −12.9** (−20.4; −5.4) | −8.6* (−16.4; −0.8) | ||||
| Working Memory | 2.4*** (1.3; 3.5) | −24.9*** (−34.9; −14.9) | −17.8** (−29.7; −5.9) | −11.4** (−17.8; −5.0) | −7.1* (−13.9; −0.3) | ||||
| Processing Speed | 2.1** (0.8; 3.3) | −11.5** (−19.4; −3.6) | −11.1** (−18.5; −3.6) | −27.8*** (−38.7; −16.8) | −24.7*** (−38.1; −11.4) | −9.6** (−16.9; −2.4) | −8.8* (−16.1; −1.5) | ||
| VMI index scores | 1.5* (0.1; 2.9) | −20.2** (−33.2; −7.1) | −17.1* (−32.4; −1.8) | ||||||
Working Memory and VMI were only available for children tested with the WISC‐IV. Numbers are regression coefficients and 95% confidence intervals.
GA (gestational age, weeks); severe brain injury (presence of intraventricular haemorrhage grade 3‐4 and/or cystic periventricular leukomalacia); severe ROP (retinopathy of prematurity stage ≥ 3); treated PDA (medically and/or surgically treated persistent ductus arteriosus); BPD (bronchopulmonary dysplasia).
p < .05.
p < .01.
p < .001.
In the analyses adjusted for GA, severe ROP affected all 6.5‐year results, while severe brain injury only affected Processing Speed, and PDA only influenced FSIQ. Table 4 shows the results of hierarchical regressions demonstrating the added explained variance of GA, PDA, severe ROP and Bayley‐III on FSIQ and VMI at 6.5 years. When the dichotomised variable maternal level of education was included in the multivariate regressions, all significant associations between neonatal variables and 6.5‐year outcomes became statistically not significant.
Table 4.
Results of the hierarchical regression models investigating effects of neonatal conditions and Bayley‐III results on Full‐Scale IQ and Visuomotor Integration scores, respectively, at 6.5‐y
| Predictors | R 2 | ΔR 2 | Δp | |
|---|---|---|---|---|
| Effect on Full‐Scale IQ in a hierarchical regression model | ||||
| Step 1 | Gestational age | 0.17 | 0.17 | <.001 |
| Step 2 | PDA | 0.21 | 0.04 | .040 |
| Step 3 | Severe ROP | 0.29 | 0.08 | .003 |
| Step 4 | Bayley‐III Cognition | 0.54 | 0.25 | <.001 |
| Effect on Visuomotor Integration in a hierarchical regression model | ||||
| Step 1 | Gestational age | 0.05 | 0.05 | .040 |
| Step 2 | Severe ROP | 0.11 | 0.06 | .028 |
| Step 3 | Bayley‐III Cognition | 0.24 | 0.13 | .001 |
| Step 4 | Bayley‐III Fine Motor | 0.28 | 0.04 | .038 |
The explained variance (R 2), the added difference in explained variance (ΔR2) and the p‐value (Δp) for the added difference are shown.
Abbreviations: Bayley‐III, Bayley Scales of Infant and Toddler Development, third edition; PDA, persistent ductus arteriosus; ROP, retinopathy of prematurity.
3.4. Relations between neurodevelopment at 2.5 years and cognitive outcome at 6.5 years
Nineteen of the 88 (21.6%) children tested at both 2.5 and 6.5 years had all five Bayley‐III subscale scores within average, but one or more Wechsler index scores below −1 SD, and four children had one or more scores below −2 SD (Figure 2).
Figure 2.
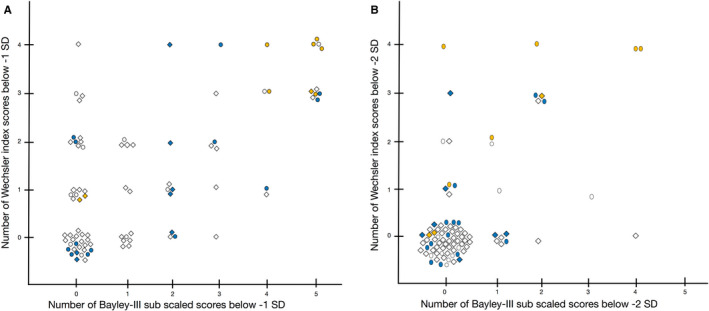
This figure shows, for each infant, the relation between the number of low Bayley‐III subscale scores at 2.5 y (x‐axis) in relation to the number of low Wechsler index scores (y‐axis) at 6.5 y (note that Full‐Scale IQ is not included). Panel A shows scores below –1 SD indicating mild‐to‐severe impairment, and panel B shows scores below −2SD indicating severe impairment. In both panels, there are children without any difficulties at 2.5 y, but with difficulties at 6.5 y. Circles represent children with a gestational age (GA) below 28 wk and diamonds children with a GA of 28‐31 wk. The colours indicate each infant's summarised numbers of neonatal conditions (severe brain injury, ROP stage ≥ 3, bronchopulmonary dysplasia, PDA) (white = no neonatal conditions; blue = 1; and yellow = 2 to 4 neonatal conditions)
In Figure 3, the univariate linear regression between the Bayley‐III cognitive index and the Wechsler FSIQ score (F(1.86) = 66.86, p < .001, with an R 2 of 0.44) is depicted. In the EPT children, the Bayley‐III cognitive index explained a larger proportion of the variance in the FSIQ score (F(1.26) = 52.08, p < .001, with an R 2 of 0.67), than in the VPT group (F(1.58) = 21.25, p < .001, with an R 2 of 0.27). The sensitivity and specificity of the Bayley‐III cognitive subscale score below −1 SD, or below −2 SD, respectively, to predict a FSIQ below −1 SD was 44% and 98%, and 20% and 99% for results below −2 SD.
4. DISCUSSION
The present data, from a regional cohort of very preterm children born 2004‐2007, demonstrated that a significant proportion had neurodevelopmental test results ranging from mild‐to‐severe impairment at 2.5 and 6.5 years, respectively. At 6.5 years, 24% had either a FSIQ below −2 SD, and/or cerebral palsy, and/or clinically diagnosed autism, and this number increased to 44% when children with FSIQ below −1 SD were included. The EPT group had an eight times increased risk of severe cognitive impairment, and in the VPT group, the risk was more than doubled compared to the reference data. Six of the 15 children with FSIQ scores below −2 SD fulfilled criteria of intellectual disability, 14 but in the remaining seven children the low FSIQ results were considered to be due to other factors, such as attention deficit hyperactivity disorder or specific cognitive impairments.
In the EPT group, the differences in mean test results, as compared to the reference data, increased between 2.5 and 6.5 years while in the VPT group less pronounced differences were found at 6.5 years. The results are comparable to the Swedish EXPRESS study, in which the extremely preterm children with GA below 27 weeks showed increasing difficulties at 6.5 years as compared to at 2.5 years. 1 , 9 The 19‐year follow‐up of the first EPICure cohort, including children born in 1995 with GA below 26 weeks, further demonstrated that the cognitive gap between children born extremely preterm and controls may continue to increase, highlighting the importance of long‐term follow‐up and the urgent need for strategies aiming at reducing these risks. 15
To our knowledge, only a few studies have presented follow‐up data for children born very preterm in the 2000s. These children are expected to have high survival rates and good long‐term outcomes. The Finnish PIPARI study, which included very‐low‐birthweight children born 2001‐2003, also demonstrated that FSIQ at 5 years was lower in children born very preterm than in controls. 7 Another study from the 2000s, the large French EPIPAGE‐2 study, presented 2‐year outcomes of preterm infants with a GA of 22‐34 weeks born in 2011. 8 The rates of moderate to severe neuromotor and sensory disabilities at 27‐31 gestational weeks were low (3.3%) but 40.7% of the children had scores below −2 SD in the Ages and Stages Questionnaire, predominantly in the Communication and Personal‐Social domains. Recently, the EPICE study reported 2‐year outcomes and varying prevalences of impairments, ranging from 9% to 20%, in children born very preterm 2011‐2012 in 10 European countries. 16
Perinatal management and neonatal conditions affect survival rates and risks for sequels in very preterm children. 8 In the present cohort, severe ROP had a major independent negative impact on FSIQ and all Wechsler indices. This is in line with other studies demonstrating close associations between poorer cognition and severe ROP, 17 involving also delayed white matter maturation. 18 In the present study, a medically or surgically treated PDA negatively affected FSIQ, and severe brain injury affected Processing Speed at 6.5 years but had no influence on general cognition. Antenatal steroids were administered in around 70% of the deliveries, and we found a clear positive effect from antenatal steroids on cognitive outcomes in the EPT group. Antenatal steroids have previously been shown to improve survival and pulmonary outcomes, but no convincing effects on neurodevelopment and cognition have been stated. 19 However, there is a lack of updated information since the only three included studies assessing cognition in relation to antenatal steroids in the Cochrane report were published in the 1970s and 1980s. 19
The purpose of systematic follow‐up of high‐risk neonates is to early identify children at risk in order to promote neurodevelopment and facilitate school achievements. The Bayley‐III aims at detecting impairments at the point of time for the assessment, but is commonly used also to make predictions of which children that should need further follow‐up. At a group level, the Bayley‐III results were closely related to the Wechsler results, but almost 22% of the children with all average results at 2.5 years had cognitive impairments first detected at 6.5 years. The Bayley‐III cognitive score increased the explained variance of the neonatal factors on 6.5‐year outcome from 29% to 54%. However, the multivariate regression model was still not specific enough to make individual predictions. For the VMI results, neonatal factors and Bayley‐III scores combined only explained 28% of the variance. The present study shows that the specificity was high while the sensitivity was low for the Bayley‐III Cognitive subscale to predict FSIQ. Consequently, more effective selection processes need to be developed or follow‐up should be continued to later ages. 20
A limitation is that the present study may have underestimated differences between the VPT and the reference data as the study population was relatively small. However, the size of the study population should be of less concern when comparing the results between 2.5 and 6.5 years. Another limitation was that a large proportion of information on maternal level of education was missing. The results changed when the limited data on maternal education were included, supporting previous studies on the influence of maternal education on preterm children's cognitive outcomes. 21 However, our results should be interpreted with some caution due to the missing data. The low prevalence of severe brain injury in the present population may also have affected the limited effects on cognitive outcome.
5. CONCLUSION
Children born extremely preterm in the 2000s still had significant risks for cognitive impairment. Neonatal conditions affected the prevalence, which consequently could be improved by developments in perinatal and neonatal care. Also, a substantial proportion of children born at a GA of 28‐31 weeks had increased risks for cognitive impairment, but in these children associations to perinatal and neonatal risks were not as evident. For the whole LOVIS cohort, we found decreased test results already at 2.5 years, but the prediction models failed to make accurate individual risk evaluations of 6.5‐year outcome. Consequently, our conclusion is that all very preterm infants should have long‐term follow‐up until at least 6.5 years.
CONFLICT OF INTEREST
None.
Supporting information
Tables S1‐S2
ACKNOWLEDGEMENTS
We thank children and parents participating in the study and acknowledge contributions of Uwe Ewald, Bo Strömberg, Jonina Hreinsdotter, Olga Kochukhova, Kristina Persson, Ingela Helling, Lotta Johansson and Mia Thörner Viddinghoff.
Kaul YF, Naseh N, Strand Brodd K, Böhm B, Holmström G, Hellström‐Westas L. Average 2.5‐year neurodevelopmental test results in children born very preterm did not rule out cognitive deficits at 6.5 years of age. Acta Paediatr. 2021;110:846–854. 10.1111/apa.15586
Funding information
Financial support was obtained from the Queen Silvia's Jubilee Foundation, the Linnéa and Josef Carlsson Foundation, the Foundation Sunnerdahls Handikappsfond, the Promobilia Foundation, the Gillbergska Foundation and the Swedish Research Council (2009‐1093 and 2016‐03109).
REFERENCES
- 1. Serenius F, Ewald U, Farooqi A, et al. Neurodevelopmental outcomes among extremely preterm infants 6.5 years after active perinatal care in Sweden. JAMA Pediatr. 2016;170(10):954‐963. [DOI] [PubMed] [Google Scholar]
- 2. Anderson PJ. Neuropsychological outcomes of children born very preterm. Semin Fetal Neonatal Med. 2014;19(2):90‐96. [DOI] [PubMed] [Google Scholar]
- 3. Stoll BJ, Hansen NI, Bell EF, et al. Trends in care practices, morbidity, and mortality of extremely preterm neonates, 1993–2012. JAMA. 2015;314(10):1039‐1051. [DOI] [PMC free article] [PubMed] [Google Scholar]
- 4. Cheong JLY, Anderson PJ, Burnett AC, et al. Changing neurodevelopment at 8 years in children born extremely preterm since the 1990s. Pediatrics 2017;139(6):e20164086. [DOI] [PubMed] [Google Scholar]
- 5. Cheong JL, Spittle AJ, Burnett AC, Anderson PJ, Doyle LW. Have outcomes following extremely preterm birth improved over time? Semin Fetal Neonatal Med. 2020;25(3):101114. [DOI] [PubMed] [Google Scholar]
- 6. Arpi E, D’Amico R, Lucaccioni L, Bedetti L, Berardi A, Ferrari F. Worse global intellectual and worse neuropsychological functioning in preterm‐born children at preschool age: a meta‐analysis. Acta Paediatr. 2019;108(9):1567‐1579. [DOI] [PubMed] [Google Scholar]
- 7. Lind A, Korkman M, Lehtonen L, et al. Cognitive and neuropsychological outcomes at 5 years of age in preterm children born in the 2000s. Dev Med Child Neurol. 2011;53(3):256‐262. [DOI] [PubMed] [Google Scholar]
- 8. Pierrat V, Marchand‐Martin L, Arnaud C, et al. Neurodevelopmental outcome at 2 years for preterm children born at 22 to 34 weeks’ gestation in France in 2011: EPIPAGE‐2 cohort study. BMJ. 2017;358:j3448. [DOI] [PMC free article] [PubMed] [Google Scholar]
- 9. Serenius F, Blennow M, Maršál K, Sjörs G, Källen K, EXPRESS Study Group . Intensity of perinatal care for extremely preterm infants: outcomes at 2.5 years. Pediatrics. 2015;135(5):e1163‐e1172. [DOI] [PubMed] [Google Scholar]
- 10. Strand‐Brodd K, Ewald U, Grönqvist H, et al. Development of smooth pursuit eye movements in very preterm infants: 1. General aspects . Acta Paediatr. 2011;100(7):983‐991. [DOI] [PMC free article] [PubMed] [Google Scholar]
- 11. Early Treatment for Retinopathy of Prematurity Cooperative Group . Revised indications for the treatment of retinopathy of prematurity: results of the early treatment for retinopathy of prematurity randomized trial. Arch Ophthalmol. 2003;121(12):1684‐1694. [DOI] [PubMed] [Google Scholar]
- 12. Hreinsdottir J, Ewald U, Strand Brodd K, Örnkloo H, von Hofsten C, Holmström G. Ophthalmological outcome and visuospatial ability in very preterm children measured at 2.5 years corrected age. Acta Paediatr. 2013;102(12):1144‐1149. [DOI] [PubMed] [Google Scholar]
- 13. Hreinsdottir J, Fredriksson Kaul Y, Hellström‐Westas L, Rosander K, von Hofsten C, Holmström G. Impaired cognitive ability at 2.5 years predicts later visual and ophthalmological problems in children born very preterm. Acta Paediatr. 2018;107(5):822‐830. [DOI] [PubMed] [Google Scholar]
- 14. American Psychiatric Association . Diagnostic and Statistical Manual of Mental Disorders, 5th edn. Washington, DC: American Psychiatric Association; 2013. [Google Scholar]
- 15. O’Reilly H, Johnson S, Ni Y, Wolke D, Marlow N. Neuropsychological outcomes at 19 years of age following extremely preterm birth. Pediatrics. 2020;145(2):e20192087. [DOI] [PubMed] [Google Scholar]
- 16. Draper ES, Zeitlin J, Manktelow BN, et al. EPICE cohort: two‐year neurodevelopmental outcomes after very preterm birth. Arch Dis Child Fetal Neonatal Ed. 2020;105(4):350‐356. [DOI] [PMC free article] [PubMed] [Google Scholar]
- 17. Schmidt B, Roberts RS, Davis PG, et al. Prediction of late death or disability at age 5 years using a count of 3 neonatal morbidities in very low birth weight infants. J Pediatr. 2015;167(5):982‐986.e2. [DOI] [PubMed] [Google Scholar]
- 18. Glass TJA, Chau V, Gardiner J, et al. Severe retinopathy of prematurity predicts delayed white matter maturation and poorer neurodevelopment. Arch Dis Child Fetal Neonatal Ed. 2017;102(6):F532‐F537. [DOI] [PubMed] [Google Scholar]
- 19. Roberts D, Brown J, Medley N, Dalziel SR. Antenatal corticosteroids for accelerating fetal lung maturation for women at risk of preterm birth. Cochrane Database Syst Rev. 2017;21(3):CD004454. [DOI] [PMC free article] [PubMed] [Google Scholar]
- 20. Kilbride HW, Aylward GP, Doyle LW, Singer LT, Lantos J. Prognostic neurodevelopmental testing of preterm infants: do we need to change the paradigm? J Perinatol Off J Calif Perinat Assoc. 2017;37(5):475‐479. [DOI] [PMC free article] [PubMed] [Google Scholar]
- 21. Wong HS, Edwards P. Nature or nurture: a systematic review of the effect of socio‐economic status on the developmental and cognitive outcomes of children born preterm. Matern Child Health J. 2013;17(9):1689‐1700. [DOI] [PubMed] [Google Scholar]
Associated Data
This section collects any data citations, data availability statements, or supplementary materials included in this article.
Supplementary Materials
Tables S1‐S2