

Abstract
Introduction
Neuronal extracellular vesicle (nEV) tau and insulin signaling biomarkers may detect preclinical Alzheimer's disease and age‐associated cognitive decline.
Methods
This case‐control study used repeated serum samples from 73 cognitively declining and 73 stable Wisconsin Registry for Alzheimer's Prevention participants (62.4 ± 6.3 years old). We immunocaptured nEVs; measured tau and insulin signaling biomarkers; and examined biomarker differences by group, their performance in group classification in training and test datasets (97, 49 individuals, respectively), and whether they predict cognitive performance change.
Results
Declining compared to stable individuals showed higher baseline total, p231‐, and p181‐tau with older age and higher annualized change for p‐IR and p‐IGF‐1R. Combining biomarkers classified decliners with 94% area under the curve (AUC), 86.0% sensitivity and 86.7% specificity, in training data, and 75% AUC, 71.4% sensitivity, and 77.3% specificity, in test data. Insulin biomarkers predicted cognitive performance change prospectively.
Discussion
Combining nEV biomarkers can identify individuals with age‐associated cognitive decline.
Keywords: Alzheimer's disease, blood biomarker, cognitive decline, exosomes, extracellular vesicles, insulin resistance, tau
1. INTRODUCTION
Alzheimer's disease (AD) has a long preclinical phase extending more than a decade prior to onset of mild cognitive impairment (MCI) or dementia 1 , 2 , 3 and characterized by progressive biochemical and cellular changes, including accumulation of amyloid beta (Aβ) plaques and hyperphosphorylated tau tangles and neurodegeneration. 4 A plausible temporal ordering of neuropathological processes has been based on clinicopathological and biomarker studies using cerebrospinal fluid (CSF) or positron emission tomography (PET) for Aβ and tau. 5 , 6 It is fairly established that Aβ appear before tau deposits, with the latter being more closely associated with development of cognitive dysfunction. 7 , 8 , 9 Moreover, tau burden has been associated with cognitive performance in clinically unimpaired older individuals. 9 , 10 , 11 Despite insights gained by these studies, PET scans are expensive and not widely available, whereas CSF sampling is invasive and unappealing. 12 Blood‐based biomarkers, which combine wider availability, the possibility of repeated acquisitions, lack of invasiveness, and lower cost, are necessary for detecting preclinical AD in the general public.
Soluble biomarkers of brain origin show low blood concentrations, whereas matrix complexity limits their detectability. Moreover, their concomitant production by peripheral tissues and the presence of the blood‐brain barrier (BBB) challenge their attribution to brain pathology. To overcome these limitations, we and others have turned to blood extracellular vesicles (EVs), exosomes and microvesicles secreted by various cells that reach the peripheral circulation. The cargo of EVs depends on their cellular origin and homeostatic and pathologic processes active in the parent cells, 13 which render EV biomarkers a reflection of diverse cellular pathologies, including neurodegenerative diseases. 14 We and others have used immunoprecipitation to isolate enriched sub‐populations of neuronal‐origin EVs (nEVs) from blood and have measured biomarkers reflecting diverse aspects of AD pathogenesis, such as Aβ and tau cascades, 15 , 16 , 17 , 18 , 19 , 20 insulin resistance, 16 , 21 and synaptic loss. 22 , 23 We and others have shown that AD patients have high nEV levels of phosphorylated and total tau, which may be used to classify them with high accuracy. 15 , 18 The convergent validity of nEV tau biomarkers has been further suggested by their increase in aging, Down syndrome, and traumatic brain injury, conditions associated with tau deposits, 24 , 25 , 26 and their strong association with CSF levels. 15 Leveraging samples from the Baltimore Longitudinal Study of Aging (BLSA), we showed that high nEV levels of phosphorylated and total tau and phosphorylated insulin receptor substrate‐1 (IRS‐1; reflecting insulin resistance) predict AD diagnosis ≈3.5 years before clinical onset. 16 Furthermore, tau and insulin signaling biomarkers were associated with cognitive performance. 16
Given that therapies for AD may be most effective at the earliest disease stages, there is an urgent need to detect AD among pre‐symptomatic individuals or those manifesting cognitive decline milder than MCI or dementia. As a step toward this goal, in the present study, we examined whether nEV biomarkers previously associated with AD are associated with cognitive decline in late middle age. We leveraged serum samples from the Wisconsin Registry for Alzheimer's Prevention (WRAP) study, which enrolls individuals at higher risk for AD due to parental history. 27 We assessed cross‐sectional and longitudinal differences in tau and insulin signaling nEV biomarkers between cognitively declining and cognitively stable individuals, tested models discriminating between cognitive decline groups, and assessed associations between baseline biomarkers and prospective changes in cognitive performance.
RESEARCH IN CONTEXT
Systematic review: We searched PubMed and Google Scholar, meeting abstracts, and presentations for “preclinical Alzheimer's,” “biomarker,” “extracellular vesicles,” “exosomes,” “cognitive aging,” and “cognitive decline.” Developing blood biomarkers for detection of age‐related cognitive decline and preclinical Alzheimer's disease (AD) are desirable goals for clinical research and practice. We identified and cited prior studies of biomarkers noting their limitations, with an emphasis on blood extracellular vesicle (EV) biomarkers.
Interpretation: Our results suggest that different forms of tau and insulin signaling mediators carried within circulating neuronal EVs can identify individuals with age‐related cognitive decline milder than mild cognitive impairment (MCI) or dementia.
Future directions: Further development of neuronal EV biomarkers, including their prospective implementation in longitudinal studies, may lead to reliable in vivo detection of preclinical AD and reveal the timing of specific pathogenic cascades. Enrolling clinically intact individuals with evidence of underlying pathology in secondary prevention trials can foster therapeutic discovery in AD.
2. MATERIALS AND METHODS
2.1. Study design and participants
The overall purpose and design of WRAP were previously described. 27 This study was approved by the University of Wisconsin Institutional Review Board and all participants provided written informed consent. Participants underwent longitudinal cognitive testing and repeated blood draws. From the WRAP cohort, we identified 393 participants with stored serum samples who had a minimum of three cognitive testing visits, which occurred approximately every 2 years. Cognitive tests included the Rey Auditory Verbal Learning Test (RAVLT) total trials 1 to 5 (assessing learning), RAVLT trial 7 (assessing delayed recall), the Wechsler Memory Scale (WMS) Logical Memory I‐A (assessing immediate recall), and WMS‐Logical Memory II‐A (assessing delayed recall). Repeated measures for these tests were used to calculate slopes (Z‐scored) for each test and participant. We identified 71 participants with cognitive slope Z‐score ≤ –1.5 for one or more memory tests (indicating measurable cognitive decline) and 2 participants with clinical diagnosis of MCI since their enrollment in WRAP. This strategy identified 73 “cognitively declining” participants. We also identified 117 participants with slope Z‐scores ≥1.0 on all four tests, suggesting stable memory. From these 117 “cognitively stable” participants, we selected 73 who were age‐matched one‐to‐one with cognitively declining participants, using case‐control matching with an age tolerance of 4 years (Table 1). For these 146 participants, we pulled two sequential serum samples that were collected closest in time to the last visit used to define cognitive status (hereafter referred to as baseline and follow‐up samples), comprising a total of 292 samples (time interval between samples: mean [standard deviation (SD)] = 2.5 [0.4] years). National Institute on Aging (NIA) investigators performing nEV isolation remained blinded to group until all data were produced and analyzed.
TABLE 1.
Participant demographics, cognitive test results (Z‐scored), and clinical characteristics at different time points. Cognitively stable and declining groups were compared by chi‐square for sex and APOE genotype, and by student's t tests for age and cognitive tests results
| WRAP enrollment visit–first cognitive assessment | Visit of baseline sample for nEV biomarkers | Visit of last cognitive assessment | ||||||||||
|---|---|---|---|---|---|---|---|---|---|---|---|---|
| All | Stable | Declining | P | All | Stable | Declining | P | All | Stable | Declining | P | |
| N | 146 | 73 | 73 | N/A | 146 | 73 | 73 | N/A | 146 | 73 | 73 | N/A |
| Age (SD) in years | 58.2 (6.1) | 57.5 (5.7) | 62.9 (6.6) | .30 | 62.4 (6.3) | 61.9 (5.9) | 62.9 (6.6) | .30 | 66.3 (6.3) | 65.6 (5.9) | 67 (6.8) | .21 |
| Female [n (%)] | 104 (71.2%) | 58 (79.5%) | 46 (63%) | .044 | – | – | – | – | – | – | – | – |
| APOE‐εX/ε4 [n (%)] | 62 (42.5%) | 32 (43.8%) | 30 (41.1%) | .87 | – | – | – | – | – | – | – | – |
| MMSE (SD) | 29.5 (0.8) | 29.6 (0.7) | 29.4 (1) | .22 | 29.6 (0.8) | 29.7 (0.5) | 29.5 (0.9) | .23 | 29.5 (0.8) | 29.7 (0.6) | 29.4 (1) | .06 |
| WMS logical memory I (SD) | 16.0 (3.0) | 15.8 (2.7) | 16.2 (3.2) | .37 | 14.8 (3.6) | 16.2 (3.2) | 13.3 (3.5) | <.001 | 15 (3,4) | 16.1 (2.7) | 13.9 (3.7) | <.001 |
| WMS logical memory II (SD) | 14.2 (3.3) | 14.2 (3.0) | 14.3 (3.6) | .61 | 13.0 (4.3) | 14.7 (3.7) | 11.4 (4.2) | <.001 | 13.4 (4.2) | 14.8 (3.2) | 12.1 (4.7) | <.001 |
| RAVLT (T1‐T5) (SD) | 52.1 (7.6) | 53.9 (7.5) | 50.3 (67.3 | .021 | 51.5 (7.4) | 54.8 (6.3) | 48.3 (6.9) | <.001 | 52 (8.5) | 55.2 (7.1) | 48.7 (8.6) | <.001 |
| RAVLT (T7) (SD) | 10.6 (2.8) | 11 (2.8) | 10.3 (2.7) | .33 | 10.6 (2.8) | 11.8 (2) | 9.5 (2.9) | <.001 | 10.8 (3.2) | 11.9 (2.4) | 9.6 (3.4) | .022 |
| Clinical diagnosis | 146 cognitively Normal | 73 cognitively Normal | 73 cognitively Normal | 73 cognitively Normal | 73 cognitively Normal | .13 | 73 cognitively Normal |
71 cognitively normal 2 MCI |
.02 | |||
Note: Cognitively stable and declining groups were compared by chi‐square for sex and APOE genotype, and by student's t tests for age and cognitive tests results.
Abbreviations: APOE, apolipoprotein E; MMSE, Mini‐Mental State Examination; nEV, neuronal extracellular vesicle; RAVLT, Rey auditory verbal learning test; SD, standard deviation; WMS, Wechsler Memory Scale; WRAP, Wisconsin Registry for Alzheimer's Prevention.
2.2. nEV isolation
Venous blood samples were collected using serum collection tubes. After clotting, samples were centrifuged at 3000 rpm for 10 minutes at 4oC. Serum was aliquoted from the supernatant and stored at –80oC. We immunocaptured nEVs using biotinylated antibody against L1 cell adhesion molecule (L1CAM; 5G3, Thermo Scientific, Inc., Waltham, Massachusetts, USA) according to Mustapic et al. 28 Intact nEVs were used for nanoparticle tracking analysis (NTA) with NanoSight NS500 (Malvern Panalytical Ltd., Worcestershire, UK). Recently published data on method reproducibility and nEV characterization 16 apply to the current study.
2.3. Biomarker quantification
We measured total tau, p181‐tau, p231‐tau, p(Tyr)‐IRS‐1, p‐IGF‐1R, pIR, p70S6K(T389), pGSK‐3B(Ser9), and pAkt(Ser473) using electrochemiluminescence assays (Meso Scale Discovery, Rockville, Maryland, USA). We used colorimetric enzyme‐linked immunosorbent assay (ELISA) to measure EV marker Alix. Samples were measured in duplicate. The average coefficient of variation (CV) of duplicates across plates was < 10% for all assays (Table S1 in supporting information); samples with CV among duplicates > 30% were excluded from analyses (< 13% excluded). Limit of detection (LOD) was defined as mean of blank plus 2.5 times standard deviation of blank (Table S1). Values below the LOD were imputed to the LOD. An internal control (IC) sample from a healthy donor was included in every plate to assess inter‐plate variability. The IC mean CV across plates was < 15% for all assays. IC measurements informed a correction factor (IC measurement for each plate divided by the mean across plates), which was used to normalize values. Annualized rates of change were calculated by dividing the change between follow‐up and baseline by the time between measurements.
2.4. Statistical analysis
Group differences in participant characteristics were evaluated with chi‐square for categorical and student's t test for continuous characteristics. All biomarker values were log‐transformed before analysis to reduce skewness. We carried out four families of analyses. Our primary objective was to assess whether (1) baseline levels and (2) rates of change differ between cognitively declining and stable individuals. Secondarily, as a global assessment measure, we examined the ability of nEV biomarkers to discriminate between cognitive groups (3). Finally, we examined whether baseline levels predict cognitive performance prospectively (4). Among nEV biomarkers, the primary measures were p231‐tau, p181‐tau, and total tau. In an exploratory fashion, we also examined insulin signaling biomarkers. For all analyses, we defined statistical significance as P < .05 or 95% confidence intervals including the null. Because some analyses were descriptive or conducted to enhance interpretation, raw P‐values are reported.
2.4.1. Differences between cognitive groups in nEV biomarker baseline levels and annualized rate of change
First, to assess the cross‐sectional association of cognitive group with baseline biomarker levels, we fit an ordinary least squares linear regression model, separately for each biomarker (as outcome), including effects for group, age (centered at 60), and the group × age interaction term (motivated by striking age‐dependent group differences observed in our prior study in the BLSA 16 ). Second, we used the same model to assess associations of cognitive group with annualized rate of change in biomarkers as the outcome. Sex, and apolipoprotein E (APOE)‐εX/ε4 genotype (present/absent) were included as factors in all models given their well‐known effects on AD risk and cognitive function.
2.4.2. Classification analyses for cognitive group membership
Next, we sought to identify a model discriminating declining from stable individuals. We conducted a random split of the data stratified by cognitive status into training (2/3) and test (1/3) datasets, resulting in balanced distributions of declining and stable individuals. To assess biomarker classification performance individually and collectively, we used the training dataset to build 12 models, including functions of the following predictors: model (1) age, sex, and APOE‐εX/ε4; Model (2) age, sex, APOE‐εX/ε4 plus Alix; Models (3–11) age, sex, APOE‐εX/ε4 plus individual biomarkers; Model (12) age, sex, APOE‐εX/ε4 plus multiple biomarkers. We considered 12 measures of each biomarker as candidate predictors: baseline measurement, within‐individual average; within‐individual slope; interactions of baseline, average, and slope with age; interactions with sex; and interactions with age and sex. Models were fit using stepwise logistic regression to appropriately handle the case‐control design. Model selection was based on internal leave‐10%‐out cross‐validation to optimize the area under the receiver operating characteristic (ROC) curve (cvAUC). Model 12 was built by identifying single biomarker measures that maximized cvAUC, recursively adding these measures until cvAUC no longer increased, followed by a reduction step to determine whether a sub‐model increased cvAUC. We chose to optimize cvAUC to avoid over‐fitting and enhance validity. The primary comparison was between the model with the best‐fit combination of biomarkers (model 12) and the model without biomarkers (model 1). In exploratory fashion, individual‐biomarker models were also fit to assess the discriminating value of individual biomarkers and the incremental discriminating value of multiple biomarkers above individual biomarkers. To compare the different models’ classification performance, we plotted ROC curves and non‐parametrically compared models’ AUC. 29
To further evaluate performance we calculated participants’ risk scores for being classified as cognitive decliners for each model. We identified the threshold estimated risk score that optimized the Youden Indexes and computed sensitivity, specificity, and odds ratios. We conducted the same analysis in the test dataset as a form of external validation.
2.5. Association of baseline nEV biomarkers with prospective cognitive change
Third, to assess whether biomarkers at baseline were associated with longitudinal change in cognitive performance prospectively, linear mixed‐effects models were fit separately for five cognitive tests as outcome variables (R, lme4 package version 1.1). All models included a random intercept term for each participant nested within subject, and fixed effects for age (centered at 60), sex, APOE‐εX/ε4, practice effects (exposures to test), cognitive group, nEV biomarker (baseline), and group × age. Interaction terms of interest (two‐way: age × biomarker and three‐way: age × biomarker × group) were added to null models sequentially and their significance was determined by comparing the full model to the null model using likelihood ratios. To ensure this analysis was prospective, only cognitive data from visits occurring within 1 year of baseline blood collection and after were included (unlike cognitive data used to inform cognitive group above).
3. RESULTS
3.1. Participant characteristics
We analyzed 292 serum samples from 146 participants, including 73 cognitively declining (mean age [SD]: 62.9 [6.6] years; female [%]: 46 [63%]; APOE‐εX/ε4 carriers [%]: 43 [58.9%]) and 73 cognitively stable (mean age [SD]: 61.9 [5.9] years; female [%]: 58 [79.5%]; APOE‐εX/ε4 carriers [%]: 41 [56.2%]). All participants were cognitively normal at baseline. In the declining group, two participants were diagnosed with MCI at follow‐up (Table 1).
3.2. Differences in nEV biomarkers between cognitive groups at baseline
Cognitive group was associated with tau biomarkers depending on age, with declining compared to stable individuals showing higher p231‐tau, p181‐tau, and total tau levels with older age (group × age interaction, p231‐tau β = 0.07, 95% confidence interval [CI]: 0.02 to 0.11, P = .01; p181‐tau β = 0.07, 95% CI: 0.01 to 0.13, P = .03; total tau β = 0.12, 95% CI: 0.05 to 0.18, P = .0005). Alix showed an opposite marginal effect (group × age interaction β = –0.04, 95% CI: –0.08 to 0.01, P = .09; Figure 1B, Table 2). There were marginal effects for p‐IGF‐1R, pS9‐GSK3b, and pT389‐p70S6K, with declining compared to stable individuals showing higher levels with older age (group × age interaction, p‐IGF‐1R β = 0.04, 95% CI: –0.01 to 0.08, P = .1; p‐GSK3b β = 0.05, 95% CI: 0.004 to 0.11, P = .08; p‐p70S6K β = 0.06, 95% CI: 0.002 to 0.11, P = .07). There were no significant effects for baseline tau biomarkers (Figure 1A), nEV concentration and average diameter, p‐IR, p‐IRS‐1, and p‐Akt (Figures S1 and S2 in supporting information; Table 2). Exploratory models including Alix as covariate or excluding APOE had worse fit (by Bayesian information criterion [BIC]) and produced similar results (data not shown).
FIGURE 1.

Tau neuronal extracellular vesicle (nEV) biomarker differences between cognitive groups at baseline. Comparisons between groups at baseline (A) and nEV biomarkers levels as a function of participant age at baseline (B). The nEV biomarker values for Alix (general EV marker), p181‐tau, p231‐tau, and total tau were log (1+value) transformed. nEV biomarkers are marked according to stable and decliner groups; green dots represent cognitively stable individuals; purple dots represent cognitively declining individuals. In (A), boxes describe median and upper and lower quartiles; error bars, 1.5 × interquartile range. Fit lines are derived from linear regression. Shaded areas represent 95% confidence intervals. *P < .05, **P < .01, ***P < .001, both from model 2. Age was fixed at 60 years old
TABLE 2.
Associations of nEV biomarkers with cognitive group and cognitive group as a function of age, at baseline
| Total nEV concentration | Average nEV diameter | Alix | Total tau | p181‐tau | p231‐tau | p‐IRS‐1 | p‐IGF1R | p‐IR | pS473‐AKT | pS9‐GSK3b | pT389‐p70S6K | |
|---|---|---|---|---|---|---|---|---|---|---|---|---|
| Cognitive group β (CI) (declining vs stable) | 0.25 ( −7.48, 7.98) | 0.09 (−0.17, 0.34) | 0.29 (−0.01, 0.58) | −0.03 (−0.46, 0.40) | 0.18 (−0.23, 0.59) | 0.13 (−0.18, 0.44) | −0.15 (−0.48, 0.18) | −0.07 (−0.35, 0.21) | 0.005 (−0.29, 0.30) | 0.16 (−0.19, 0.52) | 0.17 (−0.20, 0.54) | 0.14 (−0.24, 0.52) |
| Significance | P = .95 | P = .52 | P = .06# | P = .89 | P = .40 | P = .41 | P = .38 | P = .64 | P = 0.98 | P = 0.38 | P = 0.37 | P = 0.47 |
| Age (centered at 60) β (CI) | 0.49 (−0.39, 1.36) | −0.01 (−0.04, 0.02) | 0.02 (−0.01, 0.06) | −0.06 (−0.11, −0.01) | −0.05 (−0.09, 0.001) | −0.02 (−0.05, 0.02) | −0.03 (−0.07, 0.01) | −0.03 (−0.06, 0.01) | −0.02 (−0.05, 0.02) | −0.005 (−0.05, 0.04) | −0.01 (−0.06, 0.03) | −0.02 (−0.06, 0.02) |
| Significance | P = .28 | P = .71 | P = .17 | P = .02* | P = .06# | P = .40 | P = .12 | P = .12 | P = 0.35 | P = 0.82 | P = 0.53 | P = 0.35 |
| Sex β (CI) (male vs female) | 4.13 (−3.92, 12.18) | −0.05 (−0.32, 0.22) | 0.03 (−0.27, 0.34) | −0.01 (−0.45, 0.42) | −0.04 (−0.46, 0.38) | −0.17 (−0.48, 0.15) | 0.33 (−0.02, 0.68) | 0.20 (−0.09, 0.49) | 0.18 (−0.12, 0.48) | −0.02 (−0.39, 0.36) | −0.11 (−0.49, 0.27) | −0.02 (−0.41, 0.38) |
| Significance | P = .32 | P = .70 | P = .83 | P = .96 | P = .86 | P = .30 | P = .07# | P = .19 | P = .25 | P = 0.94 | P = 0.58 | P = 0.93 |
| ApoE‐εX/ε4 β (CI) (positive vs negative) | −5.93 (−13.28, 1.41) | 0.18 (−0.06, 0.43) | 0.13 (−0.15, 0.41) | −0.11 (−0.51, 0.29) | −0.04 (−0.43, 0.34) | 0.12 (−0.17, 0.41) | 0.09 (−0.23, 0.40) | 0.15 (−0.12, 0.41) | 0.19 (−0.09, 0.47) | 0.21 (−0.13, 0.55) | 0.25 (−0.10, 0.60) | 0.12 (−0.24, 0.48) |
| Significance | P = .12 | P = .15 | P = .38 | P = .59 | P = .84 | P = .42 | P = .58 | P = .29 | P = .19 | P = .23 | P = .17 | P = .51 |
| Age × cognitive group β (CI) | −0.41 (−1.57, 0.75) | 0.01 (−0.03, 0.05) | −0.04 (−0.08, 0.01) | 0.12 (0.05, 0.18) | 0.07 (0.01, 0.13) | 0.07 (0.02, 0.11) | 0.03 (−0.02, 0.08) | 0.04 (−0.01, 0.08) | 0.03 (−0.01, 0.07) | 0.04 (−0.01, 0.10) | 0.05 (−0.004, 0.11) | 0.06 (−0.002, 0.11) |
| Significance | P = .50 | P = .59 | P = .09# | P = .0005*** | P = .03* | P = .01** | P = .26 | P = .10# | P = .19 | P = .12 | P = .08# | P = .07# |
| Model intercept | 190.13 (183.56, 196.70) | 23.37 (23.15, 23.59) | 8.39 (8.14, 8.64) | 0.42 (0.04, 0.79) | 0.80 (0.44, 1.15) | 0.64 (0.37, 0.91) | 5.78 (5.50, 6.06) | 6.14 (5.89, 6.38) | 6.04 (5.78, 6.30) | 4.72 (4.41, 5.02) | 4.61 (4.30, 4.93) | 4.71 (4.38, 5.03) |
| Significance | P = .00*** | P = .00*** | P = .00*** | P = .04* | P = .0001*** | P = .0001*** | P = .00*** | P = .00*** | P = .00*** | P = .00*** | P = .00*** | P = .00*** |
Abbreviations: APOE, apolipoprotein E; CI, confidence interval; nEV, neuronal extracellular vesicle.
Note: β refers to unstandardized coefficient estimate (95% confidence interval); # P < .1; *P < .05; **P < .01; ***P < .001. Header columns indicate independent variables, header rows indicate dependent variables.
3.3. Differences in annualized change in nEV biomarkers between cognitive groups
The annualized change in proximal insulin signaling biomarkers was associated with cognitive group depending on age. At age 60, declining compared to stable individuals showed higher annualized change for p‐IR (group β = 1.26, 95% CI: 0.27 to 2.24, P = .02); p‐IGF‐1R (group β = 1.18, 95% CI: 0.17 to 2.19, P = .03); and, marginally, for p‐IRS‐1 (group β = 1.08, 95% CI: –0.15 to 2.31, P = .09) and p181‐Tau (group β = 1.65, 95% CI: –0.16 to 3.46, P = .08). Older declining compared to stable individuals had lesser increases for p‐IR (group × age β = –0.02, 95% CI: –0.04 to 0.004, P = .02), p‐IGF‐1R (group × age β = –0.02, 95% CI: –0.03 to 0.002, P = .03) and marginally for p181‐Tau (group × age β = –0.03, 95% CI: ‐0.06 to 0.001, P = .07; Table 3, Figures S3 and S4 in supporting information).
TABLE 3.
Associations of annualized change in nEV biomarkers with cognitive group and cognitive group as a function of age
| Total nEV concentration | Average nEV diameter | Alix | Total tau | p181‐tau | p231‐tau | p‐IRS‐1 | p‐IGF1R | p‐IR | pS473‐AKT | pS9‐GSK3b | pT389‐p70S6K | |
|---|---|---|---|---|---|---|---|---|---|---|---|---|
| Cognitive group β (CI) (declining vs stable) | 7.89 (−25.24, 41.03) | 0.14 (−0.99, 1.26) | 0.20 (−1.16, 1.55) | 1.59 (−1.05, 4.23) | 1.65 (−0.16, 3.46) | 0.65 (−0.49, 1.78) | 1.08 (−0.15, 2.31) | 1.18 (0.17, 2.19) | 1.26 (0.27, 2.24) | 0.91 (−0.47, 2.29) | 1.05 (−0.37, 2.47) | 0.46 (−0.93, 1.86) |
| Significance | P = .65 | P = .82 | P = .78 | P = .25 | P = .08# | P = .27 | P = .09# | P = .03* | P = .02* | P = .20 | P = .15 | P = .52 |
| Age (centered at 60) β (CI) | 0.19 (−0.21, 0.59) | 0.001 (−0.01, 0.01) | 0.01 (−0.01, 0.02) | 0.01 (−0.02, 0.04) | 0.001 (−0.02, 0.02) | −0.01 (−0.02, 0.01) | 0.01 (−0.01, 0.02) | 0.01 (−0.001, 0.02) | 0.01 (−0.002, 0.02) | −0.002 (−0.02, 0.01) | −0.002 (−0.02, 0.02) | −0.01 (−0.02, 0.01) |
| Significance | P = .35 | P = .91 | P = .38 | P = .58 | P = .95 | P = .39 | P = .27 | P = .09# | P = .10# | P = .78 | P = .82 | P = .42 |
| Sex β (CI) (male vs female) | −3.04 (−6.70, 0.63) | −0.03 (−0.15, 0.10) | 0.03 (−0.12, 0.18) | 0.08 (−0.20, 0.37) | −0.02 (−0.22, 0.18) | 0.06 (−0.07, 0.18) | −0.09 (−0.23, 0.05) | −0.08 (−0.19, 0.03) | −0.08 (−0.19, 0.03) | −0.001 (−0.15, 0.15) | 0.03 (−0.13, 0.19) | 0.02 (−0.13, 0.18) |
| Significance | P = .11 | P = .70 | P = .71 | P = .57 | P = .86 | P = .36 | P = .21 | P = .16 | P = .17 | P = 1.00 | P = .72 | P = .77 |
| ApoEεX/ε4 β (CI) (positive vs negative) | 2.01 (−1.34, 5.35) | −0.10 (−0.21, 0.02) | 0.10 (−0.04, 0.24) | 0.09 (−0.18, 0.35) | −0.06 (−0.24, 0.13) | 0.005 (−0.11, 0.12) | 0.03 (−0.09, 0.16) | 0.0003 (−0.10, 0.10) | −0.01 (−0.11, 0.09) | −0.02 (−0.16, 0.12) | −0.07 (−0.21, 0.07) | −0.05 (−0.19, 0.09) |
| Significance | P = .25 | P = .11 | P = .18 | P = .51 | P = .55 | P = .94 | P = .62 | P = 1.00 | P = .85 | P = .75 | P = .34 | P = .49 |
| Age × cognitive group β (CI) | −0.11 (−0.64, 0.42) | −0.003 (−0.02, 0.01) | −0.005 (−0.03, 0.02) | −0.03 (−0.07, 0.02) | −0.03 (−0.06, 0.001) | −0.01 (−0.03, 0.01) | −0.02 (−0.04, 0.003) | −0.02 (−0.03, −0.002) | −0.02 (−0.04, −0.004) | −0.02 (−0.04, 0.01) | −0.02 (−0.04, 0.005) | −0.01 (−0.03, 0.01) |
| Significance | P = .70 | P = .73 | P = .67 | P = .24 | P = .07# | P = .23 | P = .11 | P = .03* | P = .02* | P = .18 | P = .12 | P = .46 |
| Model intercept | −11.07 (−36.15, 14.02) | −0.18 (−1.03, 0.67) | −0.40 (−1.43, 0.62) | −1.19 (−3.26, 0.88) | −0.30 (−1.70, 1.09) | 0.16 (−0.72, 1.05) | −0.62 (−1.55, 0.31) | −0.67 (−1.44, 0.09) | −0.67 (−1.43, 0.08) | −0.14 (−1.18, 0.91) | −0.19 (−1.26, 0.89) | 0.11 (−0.95, 1.17) |
| Significance | P = .39 | P = .69 | P = .45 | P = .27 | P = .68 | P = .72 | P = .20 | P = .09# | P = .09# | P = .80 | P = .74 | P = .85 |
| N (valid measurements) | 146 | 146 | 141 | 107 | 127 | 134 | 139 | 139 | 139 | 146 | 146 | 146 |
| AIC | 1,094.69 | 106.15 | 154.84 | 230.45 | 195.79 | 90.53 | 119.88 | 67.72 | 62.63 | 166.51 | 174.89 | 170.03 |
| BIC | 1,115.57 | 127.04 | 175.48 | 249.16 | 215.7 | 110.81 | 140.42 | 88.26 | 83.17 | 187.39 | 195.77 | 190.91 |
Note: β refers to unstandardized coefficient estimate (95% confidence interval); # P < .1; *P < .05; **P < .01; ***P < .001. Header columns indicate independent variables, header rows indicate dependent variables.
Abbreviations: AIC, Akaike information criterion; APOE, apolipoprotein E; BIC, Bayesian information criterion; CI, confidence interval; nEV, neuronal extracellular vesicle.
3.4. Classification analyses for cognitive group membership
The best‐performing model for group classification was Model 12, which included demographics; APOE‐εX/ε4 status; and measures of p181‐tau, Alix, p‐IR, p‐IGF‐1R, and pS473‐Akt (Table S2 in supporting information). The model was developed in the training dataset using 10‐fold internal cross‐validation, where it achieved 94.0% AUC (95% CI: 89.4% to 98.5%) (Figure 2A). In the test dataset, model 12 was again the best model with 75.3% AUC (95% CI: 60.4% to 90.3%; Figure 2B). Model 12 outperformed all single biomarker Models (Figure 2 depicts heat maps of pairwise differences in model AUCs). To further compare models in group discrimination, we derived risk scores (presented as boxplots in Figure 3A for training dataset and Figure 3B for test data set) and calculated thresholds. In the training dataset, individuals with Model 12 risk score over threshold (>0.505) had 40.1 times higher odds (95% CI: 12.8 to 150.0) of cognitive decline compared to under‐threshold individuals; threshold sensitivity was 86.0% (95% CI: 71.4% to 94.2%) and specificity 86.7% (95% CI: 72.5% to 94.5%). In the test dataset, the corresponding odds ratio was 8.5 (95% CI: 2.3 to 36.9), sensitivity was 71.4% (95% CI: 47.7% to 87.8%), and specificity 77.3% (95% CI: 54.2% to 91.3%; Figure 3C).
FIGURE 2.

Models predicting cognitive group based on neuronal extracellular vesicle (nEV) biomarkers. The upper panels show receiver operator characteristic (ROC) curves for 12 models in the (A upper) training (2/3 of total) and (B upper) test datasets (1/3 of total). The lower panels show heat maps of pairwise differences in area under the curve (AUC) between all models with 95% confidence intervals (Cis) for the (A lower) training and (B lower) test datasets. The leading diagonal element shows AUC values for each model with 95% CI; off‐diagonal elements are showing AUC differences between column models and row models. Model 1 includes age, sex, and ApoE‐εX/ε4 status. Model 12 includes Model 1 and the best‐performing protein set during internally cross‐validated model‐building, which includes measurements of p181‐tau, Alix, pS473‐Akt, p‐IGF‐1R, and p‐IR. IGF‐1R, insulin‐like growth factor 1 receptor; p‐tau, phosphorylated tau; IRS‐1, insulin receptor substrate 1; IR, insulin receptor.
FIGURE 3.
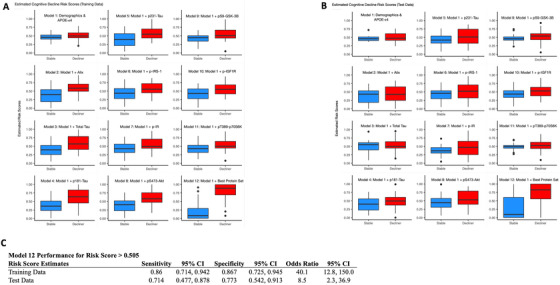
Estimated risk scores for training and test data. Boxplots of risk scores from the prediction models for the training data (A) and test data (B). Estimated risk score for each model using all data for participants (stable and decliner) was shown in y‐axis (range, 0 to 1). To calculate risk scores, exit transformation (expit[x] = exp[x]/[1 + exp(x)]) was used to convert logistic regression predictors to a scale of 0 to 1. Single dots represent outliers, boxes describe median and upper and lower quartiles; error bars, 1.5 × interquartile range. Statistics for diagnostic performance of Model 12 risk score threshold (> 0.505) in classifying individuals with cognitive decline (C)
3.5. Prospective association of nEV biomarkers with cognitive change
In models assessing effects of baseline nEV biomarkers on prospective longitudinal memory performance measured by RAVLT (T1‐T5), three‐way interactions (cognitive group × age × baseline levels) were observed for p‐IRS1 (β= –0.40, 95% CI: –0.70 to –0.09, P = .02), p‐Akt (β = –0.29, 95% CI: –0.55 to –0.04, P = .03), p‐GSK‐3β (β= –0.29, 95% CI: –0.54 to –0.05, P = .02), p‐p70S6K (β = –0.28, 95% CI: –0.53 to –0.04, P = .03) and, marginally, for p‐IGF‐1R (β = –0.33, 95% CI: –0.66 to 0.01, P = 0.06), and p‐IR (β = –0.32, 95% CI: –0.65 to 0.002, P = .06; Table S3 in supporting information). A similar three‐way interaction effect on RAVLT (T7) was observed for p‐IRS1 (β = –0.14, 95% CI: –0.26 to –0.02, P = .03). Lower insulin signaling biomarker levels were associated with greater rates of decline in learning and memory scores with increasing age, especially among cognitively stable individuals.
4. DISCUSSION
The development of techniques for isolation of nEVs from peripheral blood has opened new avenues for detecting and monitoring neurodegenerative pathologic processes in living individuals. In this study, we found that older individuals with cognitive decline milder than MCI or dementia show higher levels of total tau, p181‐tau, and p231‐tau than cognitively stable individuals. Results suggest that tau pathology is implicated in cognitive decline in non‐demented individuals on the AD pathologic continuum, expanding the scope of EV biomarkers beyond clinical AD prediction. We also found higher annualized rates of change of insulin signaling biomarkers in cognitively declining compared to stable individuals, thereby expanding the list of biomarkers associated with cognition beyond p‐tau and p‐IRS‐1 16 to include pS473‐Akt, pS9‐GSK‐3β, pT389‐p70S6K, p‐IGF‐1R, and p‐IR.
The WRAP study comprises a late middle age cohort with up to four‐fold higher risk for AD compared to the general population, 27 given parental history of AD. 30 , 31 From this cohort, we created a case‐control sample including individuals with longitudinal decline in cognitive domains sensitive to AD (further enriching for preclinical AD 32 ) and longitudinally stable individuals (less likely to harbor preclinical AD or being resilient to it). This customized sample allowed us to contrast individuals with genetic predisposition to AD and evidence for individual cognitive vulnerability to individuals with similar genetic predisposition, but cognitive resilience.
To comprehensively assess tau pathophysiology, we measured different tau species (p181‐, p231‐, and total). We previously showed that nEV p181‐tau and p231‐tau are higher in individuals with preclinical AD compared to controls. 16 Furthermore, emerging data indicate that blood tau biomarkers are closely associated with Aβ pathology. 33 The present study revealed an interesting age‐dependency of group differences for nEV tau biomarkers, with higher levels seen in older WRAP participants with cognitive decline. These findings are remarkably concordant with the BLSA nEV study, in which a strikingly similar age‐dependency of group differences was observed, with p181‐tau levels diverging between future AD and control individuals in older ages (>75 years) and p231‐tau levels maximally different in younger ages (<70 years). 16 Previous studies have claimed that CSF p231‐tau shows stronger diagnostic performance and association with memory than p181‐tau. 34 , 35 Interestingly, p231‐tau predominantly stains pre‐neurofibrillary tangles and predates p181‐tau staining of intra‐neurofibrillary tangles, 36 , 37 , 38 suggesting that p231‐ and p181‐tau cargoes reflect different stages of phosphorylated tau pathology.
Insulin signaling is essential for normal neuronal function and memory performance, whereas brain insulin resistance is associated with impaired cognition. 39 Dysregulation of insulin signaling might be an early event in AD pathogenesis linked to tau phosphorylation through GSK‐3β activity and other mechanisms. 40 Insulin signaling nEV biomarkers have previously been associated with memory performance across diverse groups (eg, older individuals, 16 patients with schizophrenia 41 ), cortical atrophy in AD, 42 and response to experimental treatments (intranasal insulin in AD, 43 exenatide in PD 44 ). The observed prospective association of p‐IRS‐1 and downstream effectors with memory is concordant with findings of an autopsy study associating their brain expression with ante‐mortem cognition. 45 The association between all insulin signaling mediators examined and RAVLT (T1‐T5) performance specifically links these markers to episodic learning, among the earliest‐impaired cognitive domains in the development of AD dementia, 46 , 47 and arguably the most pertinent measure in this preclinical cohort.
While significant group differences were observed, there was considerable overlap between groups. This is perhaps not unexpected, given that the sample comprised individuals whose division into groups was based on preclinical differences in cognitive trajectories. In this setting, it is remarkable that nEV biomarkers were able to achieve such as a high degree of classification accuracy, which parallels performance of other biomarkers for the much easier task of classifying AD patients and controls. 48 , 49
The strengths of this study include the analysis of a rare population likely enriched for preclinical AD and the use of longitudinal cognitive performance to define groups. NIA investigators who processed nEVs remained blinded for the entire investigation. The availability of repeated samples allowed us to evaluate both cross‐sectional biomarker differences and rates of change. Limitations include the absence of a “hard” criterion for defining groups (such as disease diagnosis), which may have resulted in mis‐classification in both groups (ie, cognitively stable individuals may harbor AD pathology; declining individuals may never develop clinical AD or have declining cognition from other causes). However, potential misclassification tends to bias results toward the null, implying that our findings are conservative estimates. Although the use of a test dataset for external validation is a strength and supported the conclusions, its small size may have led to sampling variability and sensitivity to outliers, perhaps contributing to the lower AUC estimate in this dataset. Analysis in that dataset was not meant to determine statistical significance and external validation should be repeated in a larger study sample.
Further development of nEV biomarkers, including their prospective implementation in longitudinal studies, may lead to reliable in vivo detection of preclinical AD and reveal the timing of specific pathogenic cascades. This capability may augment therapeutic discovery by identifying druggable processes that become active prior to clinical disease and by helping enroll participants who harbor pathology in clinical trials. Future disease‐modifying treatments should target preclinical disease, because even delaying clinical disease by a year could substantially reduce health‐care costs. 50 Identifying individuals harboring preclinical AD with blood biomarkers would allow clinicians to implement secondary prevention treatment strategies, dramatically improving disease prognosis.
CONFLICTS OF INTEREST
The authors declare no conflicts of interest.
AUTHOR CONTRIBUTIONS
Dimitrios Kapogiannis had full access to all the data in the study and takes responsibility for the integrity of the data and the accuracy of the data analysis. All authors made substantial contributions to conception or design of the work, or the acquisition, analysis, or interpretation of data for the work; and drafting of the work or revising it critically for important intellectual content; and final approval of the version to be published; and agreement to be accountable for all aspects of the work in ensuring that questions related to the accuracy or integrity of any part of the work are appropriately investigated and resolved.
Supporting information
Supplementary Information
Supplementary Information
Supplementary Information
Supplementary Information
Supplementary Information
Supplementary Information
Supplementary Information
Supplementary Information
ACKNOWLEDGMENTS
This research was supported in part by the Intramural Research Program of the National Institute on Aging, National Institutes of Health and in part by the Wisconsin Registry for Alzheimer's Prevention Grant (R01AG027161).
Eren E, Hunt JFV, Shardell M, et al. Extracellular vesicle biomarkers of Alzheimer's disease associated with sub‐clinical cognitive decline in late middle age. Alzheimer's Dement. 2020;16:1293–1304. 10.1002/alz.12130
REFERENCES
- 1. Dubois B, Hampel H, Feldman HH, et al. Preclinical Alzheimer's disease: definition, natural history, and diagnostic criteria. Alzheimers Dement. 2016;12:292‐323. [DOI] [PMC free article] [PubMed] [Google Scholar]
- 2. Bateman RJ, Xiong C, Benzinger TL, et al. Clinical and biomarker changes in dominantly inherited Alzheimer's disease. N Engl J Med. 2012;367:795‐804. [DOI] [PMC free article] [PubMed] [Google Scholar]
- 3. Sperling RA, Aisen PS, Beckett LA, et al. Toward defining the preclinical stages of Alzheimer's disease: recommendations from the National Institute on Aging‐Alzheimer's Association workgroups on diagnostic guidelines for Alzheimer's disease. Alzheimers Dement. 2011;7:280‐292. [DOI] [PMC free article] [PubMed] [Google Scholar]
- 4. De Strooper B, Karran E. The cellular phase of Alzheimer's disease. Cell. 2016;164:603‐615. [DOI] [PubMed] [Google Scholar]
- 5. Villemagne VL, Burnham S, Bourgeat P, et al. Amyloid beta deposition, neurodegeneration, and cognitive decline in sporadic Alzheimer's disease: a prospective cohort study. Lancet Neurol. 2013;12:357‐367. [DOI] [PubMed] [Google Scholar]
- 6. Jack CR Jr, Knopman DS, Jagust WJ, et al. Tracking pathophysiological processes in Alzheimer's disease: an updated hypothetical model of dynamic biomarkers. Lancet Neurol. 2013;12:207‐216. [DOI] [PMC free article] [PubMed] [Google Scholar]
- 7. McDade E, Wang G, Gordon BA, et al. Longitudinal cognitive and biomarker changes in dominantly inherited Alzheimer disease. Neurology. 2018;91:e1295‐e306. [DOI] [PMC free article] [PubMed] [Google Scholar]
- 8. Nelson PT, Alafuzoff I, Bigio EH, et al. Correlation of Alzheimer disease neuropathologic changes with cognitive status: a review of the literature. J Neuropathol Exp Neurol. 2012;71:362‐381. [DOI] [PMC free article] [PubMed] [Google Scholar]
- 9. Hanseeuw BJ, Betensky RA, Jacobs HIL, et al. Association of amyloid and tau with cognition in preclinical Alzheimer disease: a longitudinal study. JAMA Neurol. 2019. [DOI] [PMC free article] [PubMed] [Google Scholar]
- 10. Dumurgier J, Hanseeuw BJ, Hatling FB, et al. Alzheimer's disease biomarkers and future decline in cognitive normal older adults. J Alzheimers Dis. 2017;60:1451‐1459. [DOI] [PMC free article] [PubMed] [Google Scholar]
- 11. Vannini P, Uquillas FD, Jacobs HIL, et al. Decreased meta‐memory is associated with early tauopathy in cognitively unimpaired older adults. Neuroimage Clin. 2019;24:102097. [DOI] [PMC free article] [PubMed] [Google Scholar]
- 12. Blennow K. A review of fluid biomarkers for Alzheimer's disease: moving from CSF to blood. Neurol Ther. 2017;6:15‐24. [DOI] [PMC free article] [PubMed] [Google Scholar]
- 13. van Niel G, D'Angelo G, Raposo G. Shedding light on the cell biology of extracellular vesicles. Nat Rev Mol Cell Biol. 2018;19:213‐228. [DOI] [PubMed] [Google Scholar]
- 14. Hill AF. Extracellular vesicles and neurodegenerative diseases. J Neurosci. 2019;39:9269‐9273. [DOI] [PMC free article] [PubMed] [Google Scholar]
- 15. Jia L, Qiu Q, Zhang H, et al. Concordance between the assessment of Abeta42, T‐tau, and P‐T181‐tau in peripheral blood neuronal‐derived exosomes and cerebrospinal fluid. Alzheimers Dement. 2019;15:1071‐1080. [DOI] [PubMed] [Google Scholar]
- 16. Kapogiannis D, Mustapic M, Shardell MD, et al. Association of extracellular vesicle biomarkers with Alzheimer disease in the Baltimore Longitudinal Study of Aging. JAMA Neurol. 2019. [DOI] [PMC free article] [PubMed] [Google Scholar]
- 17. Watson LS, Hamlett ED, Stone TD, Sims‐Robinson C. Neuronally derived extracellular vesicles: an emerging tool for understanding Alzheimer's disease. Mol Neurodegener. 2019;14:22. [DOI] [PMC free article] [PubMed] [Google Scholar]
- 18. Fiandaca MS, Kapogiannis D, Mapstone M, et al. Identification of preclinical Alzheimer's disease by a profile of pathogenic proteins in neurally derived blood exosomes: a case‐control study. Alzheimers Dement. 2015;11:600. [DOI] [PMC free article] [PubMed] [Google Scholar]
- 19. Winston CN, Goetzl EJ, Akers JC, et al. Prediction of conversion from mild cognitive impairment to dementia with neuronally derived blood exosome protein profile. Alzheimers Dement (Amst). 2016;3:63‐72. [DOI] [PMC free article] [PubMed] [Google Scholar]
- 20. Perrotte M, Haddad M, Le Page A, Frost EH, Fulop T, Ramassamy C. Profile of pathogenic proteins in total circulating extracellular vesicles in mild cognitive impairment and during the progression of Alzheimer's disease. Neurobiol Aging. 2020;86:102‐111. [DOI] [PubMed] [Google Scholar]
- 21. Kapogiannis D, Boxer A, Schwartz JB, et al. Dysfunctionally phosphorylated type 1 insulin receptor substrate in neural‐derived blood exosomes of preclinical Alzheimer's disease. FASEB J. 2015;29:589‐596. [DOI] [PMC free article] [PubMed] [Google Scholar]
- 22. Goetzl EJ, Kapogiannis D, Schwartz JB, et al. Decreased synaptic proteins in neuronal exosomes of frontotemporal dementia and Alzheimer's disease. FASEB J. 2016;30:4141‐4148. [DOI] [PMC free article] [PubMed] [Google Scholar]
- 23. Agliardi C, Guerini FR, Zanzottera M, Bianchi A, Nemni R, Clerici M. SNAP‐25 in serum is carried by exosomes of neuronal origin and is a potential biomarker of Alzheimer's disease. Mol Neurobiol. 2019;56:5792‐5798. [DOI] [PubMed] [Google Scholar]
- 24. Hamlett ED, Goetzl EJ, Ledreux A, et al. Neuronal exosomes reveal Alzheimer's disease biomarkers in Down syndrome. Alzheimers Dement. 2017;13:541‐549. [DOI] [PMC free article] [PubMed] [Google Scholar]
- 25. Abner EL, Jicha GA, Shaw LM, Trojanowski JQ, Goetzl EJ. Plasma neuronal exosomal levels of Alzheimer's disease biomarkers in normal aging. Ann Clin Transl Neurol. 2016;3:399‐403. [DOI] [PMC free article] [PubMed] [Google Scholar]
- 26. Gill J, Mustapic M, Diaz‐Arrastia R, et al. Higher exosomal tau, amyloid‐beta 42 and IL‐10 are associated with mild TBIs and chronic symptoms in military personnel. Brain Inj. 2018;32:1277‐1284. [DOI] [PMC free article] [PubMed] [Google Scholar]
- 27. Johnson SC, Koscik RL, Jonaitis EM, et al. The Wisconsin Registry for Alzheimer's prevention: a review of findings and current directions. Alzheimers Dement (Amst). 2018;10:130‐142. [DOI] [PMC free article] [PubMed] [Google Scholar]
- 28. Mustapic M, Eitan E. Plasma extracellular vesicles enriched for neuronal origin: a potential window into brain pathologic processes. Front Neurosci. 2017;11:278. [DOI] [PMC free article] [PubMed] [Google Scholar]
- 29. DeLong ER, DeLong DM, Clarke‐Pearson DL. Comparing the areas under two or more correlated receiver operating characteristic curves: a nonparametric approach. Biometrics. 1988;44:837‐845. [PubMed] [Google Scholar]
- 30. Cannon‐Albright LA, Foster NL, Schliep K, et al. Relative risk for Alzheimer disease based on complete family history. Neurology. 2019;92:e1745‐e53. [DOI] [PMC free article] [PubMed] [Google Scholar]
- 31. Lautenschlager NT, Cupples LA, Rao VS, et al. Risk of dementia among relatives of Alzheimer's disease patients in the MIRAGE study: what is in store for the oldest old?. Neurology. 1996;46:641‐650. [DOI] [PubMed] [Google Scholar]
- 32. Papp Kathryn V., Buckley Rachel, Mormino Elizabeth, et al. (2020) Clinical meaningfulness of subtle cognitive decline on longitudinal testing in preclinical AD. Alzheimer's & Dementia, 16:552–560. [DOI] [PMC free article] [PubMed] [Google Scholar]
- 33. Thijssen EH, La Joie R, Wolf A, et al. Diagnostic value of plasma phosphorylated tau181 in Alzheimer's disease and frontotemporal lobar degeneration. Nat Med. 2020;26:387‐397. [DOI] [PMC free article] [PubMed] [Google Scholar]
- 34. Glodzik L, de Santi S, Tsui WH, et al. Phosphorylated tau 231, memory decline and medial temporal atrophy in normal elders. Neurobiol Aging. 2011;32:2131‐2141. [DOI] [PMC free article] [PubMed] [Google Scholar]
- 35. Spiegel J, Pirraglia E, Osorio RS, et al. Greater specificity for cerebrospinal fluid P‐tau231 over P‐tau181 in the differentiation of healthy controls from Alzheimer's disease. J Alzheimers Dis. 2016;49:93‐100. [DOI] [PMC free article] [PubMed] [Google Scholar]
- 36. Augustinack JC, Schneider A, Mandelkow EM, Hyman BT. Specific tau phosphorylation sites correlate with severity of neuronal cytopathology in Alzheimer's disease. Acta Neuropathol. 2002;103:26‐35. [DOI] [PubMed] [Google Scholar]
- 37. Schraen‐Maschke S, Sergeant N, Dhaenens CM, et al. Tau as a biomarker of neurodegenerative diseases. Biomark Med. 2008;2:363‐384. [DOI] [PMC free article] [PubMed] [Google Scholar]
- 38. Luna‐Munoz J, Chavez‐Macias L, Garcia‐Sierra F, Mena R. Earliest stages of tau conformational changes are related to the appearance of a sequence of specific phospho‐dependent tau epitopes in Alzheimer's disease. J Alzheimers Dis. 2007;12:365‐375. [DOI] [PubMed] [Google Scholar]
- 39. Arnold SE, Arvanitakis Z, Macauley‐Rambach SL, et al. Brain insulin resistance in type 2 diabetes and Alzheimer disease: concepts and conundrums. Nat Rev Neurol. 2018;14:168‐181. [DOI] [PMC free article] [PubMed] [Google Scholar]
- 40. Mullins RJ, Diehl TC, Chia CW, Kapogiannis D. Insulin resistance as a link between amyloid‐beta and tau pathologies in Alzheimer's disease. Front Aging Neurosci. 2017;9:118. [DOI] [PMC free article] [PubMed] [Google Scholar]
- 41. Wijtenburg SA, Kapogiannis D, Korenic SA, et al. Brain insulin resistance and altered brain glucose are related to memory impairments in schizophrenia. Schizophr Res. 2019;208:324‐330. [DOI] [PMC free article] [PubMed] [Google Scholar]
- 42. Mullins RJ, Mustapic M, Goetzl EJ, Kapogiannis D. Exosomal biomarkers of brain insulin resistance associated with regional atrophy in Alzheimer's disease. Human brain mapping. 2017;38:1933‐1940. [DOI] [PMC free article] [PubMed] [Google Scholar]
- 43. Mustapic M, Tran J, Craft S, Kapogiannis D. Extracellular vesicle biomarkers track cognitive changes following intranasal insulin in Alzheimer's disease. J Alzheimers Dis. 2019;69:489‐498. [DOI] [PMC free article] [PubMed] [Google Scholar]
- 44. Athauda D, Gulyani S, Karnati HK, et al. Utility of neuronal‐derived exosomes to examine molecular mechanisms that affect motor function in patients with parkinson disease: a secondary analysis of the Exenatide‐Pd trial. JAMA Neurol. 2019;76:420‐429. [DOI] [PMC free article] [PubMed] [Google Scholar]
- 45. Talbot K, Wang HY, Kazi H, et al. Demonstrated brain insulin resistance in Alzheimer's disease patients is associated with IGF‐1 resistance, IRS‐1 dysregulation, and cognitive decline. J Clin Invest. 2012;122:1316‐1338. [DOI] [PMC free article] [PubMed] [Google Scholar]
- 46. Gold CA, Budson AE. Memory loss in Alzheimer's disease: implications for development of therapeutics. Expert Rev Neurother. 2008;8:1879‐1891. [DOI] [PMC free article] [PubMed] [Google Scholar]
- 47. Silverberg NB, Ryan LM, Carrillo MC, et al. Assessment of cognition in early dementia. Alzheimers Dement. 2011;7:e60‐e76. [DOI] [PMC free article] [PubMed] [Google Scholar]
- 48. Lewczuk P, Riederer P, O'Bryant SE, et al. Cerebrospinal fluid and blood biomarkers for neurodegenerative dementias: an update of the consensus of the task force on biological markers in psychiatry of the world federation of societies of biological psychiatry. World J Biol Psychiatry. 2018;19:244‐328. [DOI] [PMC free article] [PubMed] [Google Scholar]
- 49. Willette AA, Calhoun VD, Egan JM, Kapogiannis D. Alzheimers disease neuroimaging I. Prognostic classification of mild cognitive impairment and Alzheimer's disease: mRI independent component analysis. Psychiatry research. 2014;224:81‐88. [DOI] [PMC free article] [PubMed] [Google Scholar]
- 50. Barnett JH, Lewis L, Blackwell AD, Taylor M. Early intervention in Alzheimer's disease: a health economic study of the effects of diagnostic timing. BMC Neurol. 2014;14:101. [DOI] [PMC free article] [PubMed] [Google Scholar]
Associated Data
This section collects any data citations, data availability statements, or supplementary materials included in this article.
Supplementary Materials
Supplementary Information
Supplementary Information
Supplementary Information
Supplementary Information
Supplementary Information
Supplementary Information
Supplementary Information
Supplementary Information