

Abstract
Background
There are concerns that school track recommendations that are mostly based on teachers’ judgements of students’ performance (‘judgement‐based recommendations’) are more biased by students’ SES than school track recommendations that are mostly based on standardized test results (‘test‐based recommendations’). A recent policy reform of the Dutch educational system has provided us the unique opportunity to compare the effects of students’ SES on these two types of track recommendations.
Aims
The aim of this study was to examine the differences between test‐based and judgement‐based recommendations regarding the direct and indirect effect of students’ SES at student level and school level.
Sample
The sample consisted of 8,639 grade 6 students from 105 Dutch primary schools.
Methods
Data were analysed using two‐level multilevel mediation models.
Results
Track recommendations were higher for high‐SES students. This was mostly due to differences in students’ prior performance. SES also had a small, direct effect on judgement‐based, but not on test‐based recommendations. The effects were partly situated at school level.
Conclusion
Overall, the results indicated that teachers based their track recommendations mostly on students’ prior performance without being biased by students’ SES.
Keywords: school transition, school track recommendation, SES, prior performance, school leavers’ test, teacher judgements, educational inequality
Background
In many countries, such as Great Britain, Germany, Luxembourg, Singapore, France, and the Netherlands, the transition from primary to secondary education involves students’ allocation to specific school tracks. These tracks differ in the educational qualifications students can acquire and determine students’ educational career (Contini & Scagni, 2011; Glock et al., 2012; Korpershoek et al., 2016). A substantial body of research (e.g., Driessen et al., 2008; Dutch Inspectorate of Education, 2018c; Klapproth et al., 2012; OECD, 2016; Pietsch & Stubbe, 2007) has reported that students’ background characteristics, including their families’ socio‐economic status (SES), have an impact on students’ allocation to specific secondary school tracks. To create equal opportunities for all students, it is important that students are allocated to the secondary school track that is most appropriate based on their abilities, regardless of their SES (Tieben & Wolbers, 2010). In most tracked educational systems, students’ allocation is typically based on the ‘school track recommendation’ students receive at the end of primary education (Contini & Scagni, 2011; Glock et al., 2012; LeTendre et al., 2003). The degree to which school track recommendations are based on standardized test results or on teachers’ judgements differs per educational system. Because it is difficult to make a valid comparison between these distinct types of track recommendations, given that within one country, one type of recommendation is used (LeTendre et al., 2003), and little research has addressed this topic. A recent policy reform of the Dutch educational system enables us to compare two types of track recommendations: recommendations that are primarily based on results of a school leavers’ test (test‐based recommendations) and recommendations that are primarily based on teacher judgements (judgement‐based recommendations). In the present study, we aim to investigate for both types of recommendations (1) whether students’ SES has an effect on track recommendations, and (2) whether these effects are mediated by students’ prior performance.
Test‐based versus judgement‐based track recommendations
School track recommendations are formulated at the end of primary education, but how these track recommendations are developed differs per educational system (LeTendre et al., 2003). In some countries, such as Great Britain and Singapore, track recommendations are based on students’ results on a standardized, multisubject school leavers’ test (Boone & Van Houtte, 2013; Le Métais, 2003). In other countries, such as Belgium, Germany, Luxembourg, and France, track recommendations are based on teachers’ expectations about the most optimal level of secondary education for students to develop and perform successfully (Boone & Van Houtte, 2013; De Boer et al., 2010; Glock et al., 2012; Klapproth et al., 2012; Le Métais, 2003; Timmermans et al., 2015). These expectations are teachers’ inferences about students’ potential achievement, usually based on teachers’ judgements of students’ current performance as well as other characteristics, such as their motivation or behaviour (Boone & Van Houtte, 2013; Feron et al., 2015; Klapproth et al., 2012; Riley & Ungerleider, 2012). In short, track recommendations can be mostly based on test results, hereafter referred to as ‘test‐based recommendations’, or on teacher judgements, hereafter referred to as ‘judgement‐based recommendations’ (Boone & Van Houtte, 2013; Glock et al., 2012; Klapproth et al., 2012). Since teachers’ judgements are partly based on (standardized) test results as well, a strict distinction between test‐based and judgement‐based recommendations cannot be made. The degree to which track recommendations are based on standardized tests or on teachers’ judgements should rather be seen as a continuum. In this continuum, the two types of recommendations primarily differ in the extent to which teachers may consider students’ (background) characteristics, such as SES, motivation, or behaviour.
A recent policy reform in the Netherlands provides the opportunity to compare the two types of track recommendations (Dutch Ministry of Education Culture and Science, 2014). Before the policy reform, test‐based recommendations were used. These recommendations were mostly based on students’ standardized school leavers’ test score (Luyten & Bosker, 2004). This test result directly indicated a level of secondary education that was most appropriate for a student. Approximately 75% to 80% of the students received a track recommendation that matched their result on the school leavers’ test, while the remaining 20% to 25% of the students received a track recommendation that did not match their result on the school leavers’ test (Oomens et al., 2019). After the policy reform, judgement‐based recommendations were used. The school leavers’ test scores were no longer available to teachers when formulating track recommendations (Korpershoek et al., 2016; Oomens et al., 2019). Instead, these recommendations were based on teachers’ expectations of students’ future performance and development during secondary education (Oomens et al., 2019). Even though both types of track recommendations are not situated at the far end of the continuum, they substantially differ in the extent to which standardized test results and other student characteristics can or will be considered.
There are valid arguments in favour of both types of recommendations. A central argument in favour of using test‐based recommendations is that using a school leavers’ test as primary indicator improves educational equality. A school leavers’ test consists of the same set of questions and is ideally administered under similar conditions (Knoester & Au, 2017). Additionally, for all students, the standard is set at the same level to ensure that they are judged solely on their performance, neglecting other student characteristics. Consequently, test‐based recommendations should be similar for all students with comparable performance levels, regardless of their background characteristics. In turn, students from different backgrounds will have equal opportunities to be assigned a certain track recommendation (OECD, 2016). However, a school leavers’ test is administered at one specific moment, which makes it impossible to take students’ (cognitive) development throughout primary school into account (Driessen, 2005; OECD, 2016). When a student does not perform as well as he or she normally does, the results of the school leavers’ test are not in line with the students’ actual abilities (Boone & Van Houtte, 2013).
A central argument in favour of using judgement‐based recommendations is that teachers have the opportunity, in addition to standardized test results, to include (non‐cognitive) information that may be predictive of students’ future secondary school success, such as classroom behaviour, motivation, talents, development, work attitude, and school engagement (Boone & Van Houtte, 2013; Driessen et al., 2008; Feron et al., 2015; Jungbluth, 2003; Klapproth et al., 2012). Consequently, in educational systems that use judgement‐based recommendations, students who perform at the same educational level may receive different track recommendations. Moreover, teacher judgements are susceptible to bias, which may cause an undesired effect: lower track recommendations for students with more disadvantaged backgrounds (Boone & Van Houtte, 2013; Driessen, 2005; Driessen et al., 2008; OECD, 2016).
Impact of SES
On average, track recommendations are more positive for high‐SES students than for low‐SES students (Dutch Inspectorate of Education, 2018a). This can primarily be explained by students’ prior performance (Caro et al., 2009; Sirin, 2005): Because low‐SES students generally perform lower than high‐SES students, their track recommendations are lower (Luyten & Bosker, 2004; Timmermans et al., 2015). These findings point to an indirect effect of SES on track recommendations through students’ performance levels. For example, Caro et al. (2009) demonstrated that families’ SES was indirectly related to students’ track recommendation through their mathematics performance and growth. High‐SES students performed better in mathematics than low‐SES students and, consequently, received higher track recommendations. In addition, in a meta‐analysis of 74 studies, Sirin (2005) concluded that low‐SES students obtained lower scores on standardized literacy tests than high‐SES students. Explanations for these indirect effects are related to students’ social, cultural, and financial capital or resources, which are predictive of school performance (Milne & Plourde, 2006; Sirin, 2005). For example, Bradley and Corwyn (2002) reported that low‐SES children were less likely to visit museums, libraries, theatrical events, or educational institutions. Moreover, research of Constantino (2005) indicated that high‐SES children had access to more books than low‐SES children and, consequently, were more likely to read regularly. Because of these indirect effects, we can draw the conclusion that both test‐based and judgement‐based recommendations may be lower for low‐SES students than for high‐SES students.
However, previous studies (e.g., Dutch Inspectorate of Education, 2018a; Luyten & Bosker, 2004; OECD, 2016) that included students’ prior performance as well as their SES identified that students’ prior performance could not entirely explain the effect of SES on track recommendations. This finding indicates that there is also a direct effect of SES, which cannot be accounted for by students’ prior performance. This direct effect may be caused by track recommendation bias (Driessen et al., 2008; Jungbluth, 2003). Research (e.g., Driessen et al., 2008; Dutch Inspectorate of Education, 2018a; OECD, 2016) emphasized that students’ SES was a stronger source of track recommendation bias compared to other student background characteristics, such as gender or ethnicity. There are multiple considerations of teachers, both explicit and implicit, that can explain this finding. An example of an explicit consideration is when teachers consider the parents of a low‐SES student to be less able to provide (educational) support (e.g., Bakker et al., 2007; Hoover‐Dempsey et al., 1992). Consequently, teachers may be more careful when formulating a track recommendation. Implicit considerations may occur if stereotypes are activated when teachers perceive a student as belonging to a particular subgroup (Fiske & Neuberg, 1990; Peterson et al., 2016). Consequently, information about that student will be interpreted in terms of the activated stereotype and, in turn, used for forming judgements (Krolak‐Schwerdt et al., 2013). For example, students’ SES can activate such a stereotype and can cause teachers to perceive low‐SES students as less capable than high‐SES students, which could subsequently lead to lower track recommendations. In addition, research (Glock & Krolak‐Schwerdt, 2013) demonstrated that the stronger the stereotype was, the stronger the impact on judgements was. As teachers’ recommendations were overall quite accurate (De Boer et al., 2010), the effects of biased track recommendations were, on average, small (Klapproth et al., 2012; Pietsch & Stubbe, 2007). However, the effects may increase among certain stigmatized subgroups, such as low‐SES students.
In addition, because judgement‐based recommendations rely more strongly on teachers’ own judgements of their students compared to test‐based recommendations, non‐cognitive student characteristics may have a substantial impact. Indeed, prior research (Bol et al., 2014; Caro et al., 2009) indicated that judgement‐based recommendations tended to be more biased by students’ SES than test‐based recommendations. More specifically, Luyten and Bosker (2004) reported that the influence of students’ background characteristics on track recommendations was stronger at schools that did not administer a school leavers’ test compared to schools that did administer a test. Hence, because teachers may (unintendedly) formulate biased track recommendations (Driessen et al., 2008; Jungbluth, 2003), the Dutch policy reform shifting from test‐based to judgement‐based recommendations can result in stronger effects of students’ SES on track recommendations. To further examine this assumption, we included students’ prior performance in the present study.
Student and school level
Most research on the impact of SES on teacher judgements, expectations, and/or track recommendations focused on the effects situated at student level (e.g., Ready & Wright, 2011; Sorhagen, 2013). Because track recommendations are generally made during staff or decision council meetings within a school (Barg, 2013; Bonizzoni et al., 2016; Boone & Van Houtte, 2013; Dollmann, 2016; Klapproth et al., 2012, 2013; Primary Education Council & Secondary Education Council, 2014), the effects of SES on school track recommendations may also be situated at school level. In other words, perhaps the differences between track recommendations for low‐ and high‐SES students are not situated within schools, but between schools. Timmermans et al. (2015) reported that students in high‐SES classes more frequently received a school track recommendation for the highest secondary school track than students in low‐SES classes. This can occur since students are grouped in classes and teachers experience these classes daily. It is likely that teachers form a frame of reference based on the composition of the class (Boone et al., 2018; Klapproth & Fischer, 2000), perceiving students in high‐SES classes as possessing more advanced academic skills than students in low‐SES classes (Ready & Wright, 2011).
However, a study in Flanders, Belgium (Boone et al., 2018) reported no significant effect of SES class composition on school track recommendations. They suggested that this might be due to the fact that school track recommendations were non‐binding in Flanders; that is, track recommendations did not serve as formal entrance criteria for secondary education. Consequently, teachers may experience less parental pressure to get a track recommendation for the highest (academic) secondary school track (Dronkers et al., 1998). In turn, Boone et al. (2018) speculated that the impact of SES class composition would be more pronounced in educational systems with binding track recommendations, as is in the study of Timmermans et al. (2015). In general, previous research presented mixed evidence regarding the effect of SES on track recommendations at class composition level.
Present study
Because of the ongoing (political) debate addressing educational equality at the transition from primary to secondary education, it is of significant importance to examine what type of track recommendation leads to the most equal educational opportunities for students (OECD, 2016). Previous research (Bol et al., 2014) compared countries with different educational systems to investigate the impact of SES on test‐based and judgement‐based track recommendations. However, educational systems tend to vary from one another in many aspects, which makes it difficult to ensure a valid comparison and to determine the exact impact of SES on different types of track recommendations. A recent policy reform of the Dutch educational system has provided us the unique opportunity to compare the effects of students’ SES on two types of track recommendations. The policy shifted from relying primarily on students’ school leavers’ test results (test‐based recommendations) to relying more strongly on teacher judgements (judgement‐based recommendations) (Dutch Ministry of Education Culture and Science, 2014). Both types of recommendations substantially differ in the degree to which teachers consider standardized test results and other student characteristics. To summarize, in the present study, we investigate for both types of track recommendations (1) whether students’ SES has an effect on track recommendations at student and school level, and (2) whether these effects are mediated by students’ prior performance in mathematics and reading comprehension, and in case of test‐based recommendations also by students’ results on the school leavers’ test.
Based on previous research (Dutch Inspectorate of Education, 2018a; Luyten & Bosker, 2004; Timmermans et al., 2015), we expected that high‐SES students would have higher track recommendations than low‐SES students. Second, because students from different SES backgrounds differ in performance (Caro et al., 2009; Sirin, 2005), we predicted that for both types of track recommendations the effect of SES on track recommendations would primarily be explained by differences in prior performance (i.e., an indirect effect) between students with different SES. However, because test‐based recommendations might be less biased by teacher judgements (Bol et al., 2014; Caro et al., 2009; Luyten & Bosker, 2004), we expected a weaker direct effect of SES on test‐based recommendations than on judgement‐based recommendations. Finally, we formulated no specific expectation at which level the effects of SES on track recommendations will be situated, given the conflicting findings of prior research (Boone et al., 2018; Timmermans et al., 2015).
Method
Sample
The data used in this research were part of a larger data set on the educational development of students in primary and secondary education. From the full data set, we constructed our data set with various variables of students’ background and educational performance in primary school. Schools that gave their approval of using their data were included. These data were retrieved from an online student monitoring platform that primary schools used to upload student information. An institution representing the schools, which had access to this online monitoring platform, downloaded and anonymized the data.
The data set consisted of a sample of 8,639 grade 6 students from 105 primary schools of a large city in the Netherlands. Students were from four cohorts: two cohorts before the educational policy reform (having test‐based recommendations) and two cohorts after the reform (having judgement‐based recommendations), which allowed us to examine differences between both types of recommendations. The cohorts with test‐based recommendations consisted of 4,391 (50.8% of the total sample) students who were in grade 6 of primary education in the academic year 2012‐2013 or 2013‐2014, and the cohorts with judgement‐based recommendations consisted of 4,248 (49.2% of the total sample) students who were in grade 6 in academic year 2014‐2015 or 2015‐2016.
Measures
The main focus of the present study was the variable track recommendation. Additionally, students’ educational performance was included, consisting of two main variables: (a) a standardized mathematics test and (b) a standardized reading comprehension test. For test‐based recommendations, a third performance variable was included: (c) the school leavers’ test. School leavers’ test results were solely available for test‐based recommendations. Finally, students’ SES was included to examine whether track recommendations were biased by SES. The descriptive statistics of these variables are presented in Table 1.
Table 1.
Descriptive statistics of track recommendation, SES, prior performance, and school leavers’ test
| Test‐based recommendations | Judgement‐based recommendations | Total | |||||||||
|---|---|---|---|---|---|---|---|---|---|---|---|
| n | M | SD | n | M | SD | n | M | SD | Min. | Max. | |
| Track recommendation | 4281 | 4.55 | 1.23 | 4242 | 4.66 | 1.26 | 8523 | 4.61 | 1.24 | 1 | 6 |
| SES | 4385 | 0.20 | 0.94 | 4242 | 0.31 | 0.91 | 8627 | 0.25 | 0.92 | ‐2.66 | 3.65 |
| School leavers’ test | 1554 | 538.73 | 7.25 | – | – | – | 1554 | 538.73 | 7.25 | 505 | 550 |
| Prior performance | |||||||||||
| Reading comprehension test | 4373 | 61.02 | 20.20 | 4245 | 64.36 | 20.60 | 8618 | 62.66 | 20.46 | ‐27 | 147 |
| Mathematics test | 4379 | 112.76 | 12.87 | 4243 | 114.53 | 14.20 | 8622 | 113.63 | 13.57 | 21 | 168 |
Track recommendation. The Dutch secondary educational system is a tracked system. At the beginning of March in grade 6, that is, the final year of primary education, teachers formulate a track recommendation that indicates which of the six secondary school tracks is most appropriate for a specific student. The six tracks are as follows: (1) practical training, (2) basic pre‐vocational secondary education, (3) middle pre‐vocational secondary education, (4) theoretical pre‐vocational education, (5) senior general secondary education, and (6) pre‐university education. Because track recommendation consisted of six categories, we considered this variable as a continuous variable. According to several researchers (Johnson & Creech, 1983; Norman, 2010; Sullivan & Artino, 2013; Zumbo & Zimmerman, 1993), this can be done without any harm to the analyses.
In the present study, we used the initial track recommendation, that is, the recommendation without any corrections made at a later stage, to make a valid comparison between the recommendations formulated before and after the policy reform. Because a singular recommendation is mandatory and part of the official regulations in the city our data originates from, combined track recommendations of adjacent tracks are not part of this initial track recommendation. Finally, this track recommendation does not necessarily correspond to the actual track placement of a student. Since the actual track placement is influenced by other factors, such as regulations that secondary schools apply when allocating students to a specific school track, it is beyond the scope of this research.
Prior performance. Students’ prior performance was measured using students’ reading comprehension and mathematics scores on standardized tests. These scores were retrieved from schools’ monitoring and evaluation system. The monitoring and evaluation system is developed by Cito, that is, the Dutch National Institute for Educational Measurement, and consists of several standardized tests throughout primary school to monitor students’ progress in different subject domains. For the present study, students’ most recent scores on both subject domains were selected, because these generally provided the most predictive value for track recommendations (Primary Education Council & Secondary Education Council, 2014). The scores on the tests are converted by Cito into a single test score for each subject domain, resulting in reading comprehension test scores ranging from −87 to 147, and in mathematics test scores ranging from 0 to 168 (Cito, 2016). Prior research (Feenstra et al., 2010; Janssen et al., 2010) indicated that the tests had a high validity and high internal consistency (α>.80). To account for potential differences between test versions, the test scores were standardized.
School leavers’ test. While mathematics and reading comprehension were included as measures for students’ prior performance for both types of recommendations, the school leavers’ test is of significant importance as performance indicator for test‐based recommendations. Because of a changed time schedule, the results of this test are not available for judgement‐based recommendations. The school leavers’ test is a multisubject high‐stakes test administered in grade 6 of primary education. The test is administered at the same time in the whole country. Although there are multiple types of school leavers’ tests available nowadays, the vast majority of schools administer the school leavers’ test developed by Cito (Dutch Board of Tests and Examinations, 2015; Van Look & Van Tartwijk, 2018). Therefore, the Cito school leavers’ test, also known as the End of Primary Education Test, was included in the present study. It has been designed as a standardized measurement of students’ performance level to indicate an appropriate secondary school track type. The test consists of 290 multiple‐choice items, divided over four subtests: (a) Dutch language (reading comprehension, writing, decoding, spelling/grammar), (b) mathematics (arithmetic, geometry, algebra), (c) study skills (map‐reading, interpreting study texts, information sources, graphs, diagrams, and tables), and (d) world studies (geography, history, science). The results on these different subject domains are converted by Cito into a single test score ranging from 501 to 550 (Van Boxtel et al., 2011). The Cito school leavers’ test is calibrated each year to guarantee that students’ average test scores are comparable across years. Prior research (Dutch Board of Tests and Examinations, 2015; Van Boxtel et al., 2011) reported that these tests had a high validity and high internal consistency (α > .95).
Socio‐economic status (SES). Students’ six‐digit postal code was used as an approximation of students’ families’ SES, as it can be an useful marker of SES (Danesh et al., 1999). Indicators of SES to recode postal codes were provided by Statistics Netherlands (CBS), an autonomous organization that offers statistical data to gain insight into social issues (Van Leeuwen, 2019). The SES variable was composed of three indicators: (a) the most recent mean household income after tax, (b) the mean real estate value, and (c) the number of people with unemployment or social welfare benefits, all measured in 2016. The three indicators were recoded into one factor score using principal component analysis (PCA). Because six‐digit postal codes referred to smaller areas, the classification of six‐digit postal codes was more precise than classification of five‐digit or four‐digit postal codes (Van Der Aa et al., 2011). For Dutch cities, the six‐digit postal codes were, on average, shared by only 15 to 20 households, providing an accurate impression of those households (Deckers et al., 2016; Guhn et al., 2010; Van Hattem et al., 2009). However, the six‐digit classification contained missing values (41.13% of the total sample is complete). Therefore, we used the five‐digit postal code classification (in 57.26% of the total sample) or the four‐digit postal code classification (in 1.47% of the total sample) to account for missing data on the six‐digit classification. Both five‐digit and four‐digit postal code classifications were based on the same indicators as the six‐digit postal code classification. High scores on this variable indicated a high SES, while low scores indicated a low SES.
Data analyses
Because of the hierarchical structure of the data with students (level 1) nested in primary schools (level 2), the data were analysed using a two‐level multilevel model (Burstein, 1980; Hox et al., 2018). We used SPSS 26 to run all reported models. The analyses were conducted for the test‐based and the judgement‐based recommendations separately. Analyses regarding the test‐based recommendations included the variable school leavers’ test, because teachers had access to students’ results on this test when formulating a track recommendation, whereas these test results were not available when teachers formulated judgement‐based recommendations. The independent variables’ school leavers’ test and SES were grand mean centred prior to their entrance into the multilevel models (Enders & Tofighi, 2007).
The percentage of missing data was extremely low, ranging from 0.1% to 1.3% (exact numbers of n of each variable included in the analyses can be seen in Table 1), except for the variable school leavers’ test (35,4% complete records of the sample of the first two cohorts). This was due to guidelines of the online student monitoring platform, where our data were downloaded from. Until the policy reform in 2014‐2015, it was not mandatory to upload students’ school leavers’ test scores and, consequently, most schools did not upload them. Comparing data of students who were omitted from the analysis based on missing data on the school leavers’ test with data of students who were included revealed some signs of attrition bias. On average, students with missing values on the school leavers’ test had a lower SES (p < .001), received lower track recommendations (p < .001), and performed lower on reading comprehension (p < .001) and mathematics (p < .001). The effect sizes for these differences were small (d < 0.26). In addition, these findings suggested that, even though these differences were small, the missingness was not at random. Given these differences, we applied FIML (full information maximum likelihood) estimation in our main analyses to account for the missing data (Schafer & Graham, 2002).
First, to examine whether there was an indirect effect of SES on track recommendations through students’ reading comprehension and mathematics skills and at which levels the effects were located, multilevel mediation analyses were conducted using the MLmed macro for SPSS (Rockwood, 2017a, 2017b). We estimated all parameters for a 1–1–1 mediation model in which all variables were measured at level 1, the student level (as can be seen in Figure 1). Monte Carlo stimulations were used to estimate 95% confidence intervals (Rockwood & Hayes, 2017). All independent and mediator variables were automatically grand mean centred by the MLmed macro prior to their entrance into the multilevel mediation models.
Figure 1.
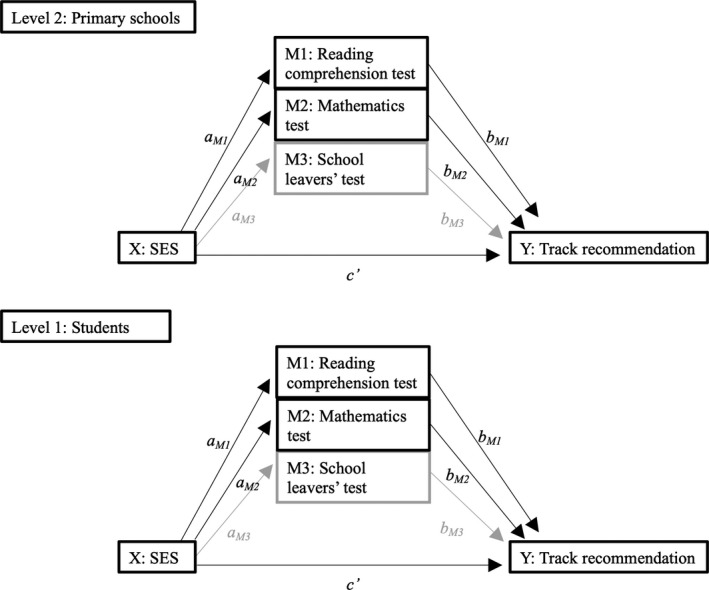
Multilevel mediation model as estimated for the present study. Path a represents the effect of students’ SES on students’ prior reading comprehension and mathematics performance. Path b represents the effect of students’ prior reading comprehension and mathematics performance on track recommendation. Path c’ represents the direct effect of students’ SES on track recommendation. Path ab represents the indirect effect of students’ SES on track recommendation through students’ prior reading comprehension and mathematics performance.
Second, a multilevel regression model was performed to examine the explained variance of the different independent variables for both types of track recommendations.
Since missing values on the included variables were identified, the number of cases varied according to the model analysed (as can be seen in Tables 3 and 4). An unconditional model (Model 0) with school track recommendation as dependent variable was estimated to investigate the distribution of variance at both levels. In Model 1, students’ SES was added to the model as a fixed effect to provide information on whether students’ SES was a predictor of track recommendations. Model 2 consisted of the indicators of prior performance as predictors (fixed effects) of track recommendation. For the test‐based recommendations, the school leavers’ test was also added to this model. In Model 3, all predictor variables were included.
To evaluate the size of differences of the effects of SES between test‐based and judgement‐based recommendations, effect sizes were calculated by means of Cohen's d, with 0.2, 0.5, and 0.8 as indicative of small, medium, and large effect sizes, respectively (Cohen, 1988). To compare whether the effects of SES on track recommendations for test‐based and judgement‐based recommendations differed, we performed a Wald test, calculated using the following equation (Brame et al., 1998):
Results
The correlations between track recommendations, students’ SES, and prior performance are presented in Table 2. Overall, high significant positive correlations were reported between students’ prior performance and both types of track recommendations (test‐based recommendations: rReading = .76, rMathematics= .76; judgement‐based recommendations: rReading = .77, rMathematics= .81). Additionally, for test‐based recommendations, high significant positive correlations were found between the school leavers’ test and track recommendations (r = .84). These high correlations indicated that the track recommendations were closely related to students’ prior performance. Finally, for both types of recommendations, low significant positive correlations were reported between students’ SES on the one hand, and track recommendations on the other hand (test‐based recommendations: r= .32; judgement‐based recommendations: r= .27.
Table 2.
Correlations between track recommendation, SES, prior performance, and school leavers’ test
| Test‐based/ Judgement‐based recommendations | ||||
|---|---|---|---|---|
| 1 | 2 | 3 | 4 | |
| Track recommendation | ||||
| SES | .32***/.29*** | |||
| Reading comprehension test | .76***/.77*** | .26***/.25*** | ||
| Mathematics test | .76***/.81*** | .19***/.23*** | .63***/.68*** | |
| School leavers’ test | .84***/ – | .28***/ – | .64***/ – | .71***/ – |
p < .05; **p < .01; ***p < .001.
Overall effects of SES
The results of the multilevel regression models, as can be seen in Table 3 (test‐based recommendations) and Table 4 (judgement‐based recommendations), illustrated that 22.5% of the variance in test‐based and 29.2% of the variance in judgement‐based recommendations is attributable to factors at school level. As expected, SES was significantly (positively) related to both test‐based and judgement‐based recommendations, even after controlling for students’ prior performance. The higher the students’ SES was, the higher the track recommendations they received. However, the impact of SES was small (test‐based recommendations: = .04, p = .016; judgement‐based recommendations: = .05, p < .001). The difference between test‐based and judgement‐based recommendations was not significant (z = −.50, p = .309), indicating that there was no significant difference between the two types of recommendations regarding to the impact of SES. After accounting for prior performance, SES explained approximately 0.5% of the variance in track recommendations (test‐based recommendations: RModel32 = 84.80%; judgement‐based recommendations: RModel32 = 76.41%).
Table 3.
Unstandardized estimates of multilevel models predicting test‐based track recommendations with SES, school leavers’ test, and prior performance
| Test‐based recommendations | ||||||||||||
|---|---|---|---|---|---|---|---|---|---|---|---|---|
| Model 0: Empty | Model 1: SES | Model 2: School leavers’ test + Prior performance | Model 2a: School leavers’ test | Model 2b: Prior performance | Model 3: SES + School leavers’ test + Prior performance | |||||||
| b | SEb | b | SEb | b | SEb | b | SEb | b | SEb | b | SEb | |
| Intercept | 4.39*** | .06 | 4 .47*** | .05 | 4.66*** | .03 | 4.73*** | .03 | 4.51*** | .03 | 4.67*** | .03 |
| SES | .26*** | .02 | .04* | .02 | ||||||||
| School leavers’ test | .55*** | .02 | .78*** | .01 | .55*** | .02 | ||||||
| Prior performance | ||||||||||||
| Reading comprehension test | .23*** | .02 | .52*** | .01 | .23*** | .02 | ||||||
| Mathematics test | .19*** | .02 | .59*** | .01 | .19*** | .02 | ||||||
| Variance | ||||||||||||
| Student level | 1.21*** | .03 | 1.19*** | .03 | .19*** | .01 | .22*** | .01 | .37*** | .01 | .19*** | .01 |
| School level | 0.35*** | .06 | .22*** | .04 | .05*** | .01 | .05*** | .01 | .09*** | .01 | .04*** | .01 |
| R 2 | .102 | .844 | .824 | .708 | .848 | |||||||
| Model fit | ||||||||||||
| ‐2LL | 13213.27 | 13075.73 | 1921.39 | 2152.20 | 8052.58 | 1914.94 | ||||||
| Number of schools | 98 | 98 | 88 | 88 | 98 | 88 | ||||||
| Number of students | 4,281 | 4,275 | 1,506 | 1,513 | 4,257 | 1,504 | ||||||
The coefficients of prior performance tests versus school leavers’ test differ in magnitude due to differences in scaling.
p < .05; **p < .01; ***p < .001.
Table 4.
Unstandardized estimates of multilevel models predicting judgement‐based track recommendations with SES and prior performance
| Judgement‐based recommendations | ||||||||
|---|---|---|---|---|---|---|---|---|
| Model 0: Empty | Model 1: SES | Model 2: Prior performance | Model 3: SES + Prior performance | |||||
| b | SEb | b | SEb | b | SEb | b | SEb | |
| Intercept | 4.41*** | .08 | 4.48*** | .07 | 4.63*** | .03 | 4.64*** | .03 |
| SES | .24*** | .02 | .05*** | .01 | ||||
| Prior performance | ||||||||
| Reading comprehension test | .49*** | .01 | .49*** | .01 | ||||
| Mathematics test | .69*** | .01 | .69*** | .01 | ||||
| Variance | ||||||||
| Student level | 1.26*** | .03 | 1.25*** | .03 | 0.36*** | .01 | .36*** | .01 |
| School level | .52*** | .08 | .39*** | .07 | 0.07*** | .01 | .06*** | .01 |
| R 2 | .087 | .759 | .764 | |||||
| Model fit | ||||||||
| ‐2LL | 13294.03 | 13185.32 | 7869,54 | 7838.05 | ||||
| Number of schools | 101 | 101 | 101 | 101 | ||||
| Number of students | 4,242 | 4,236 | 4,235 | 4,229 | ||||
p < .05; **p < .01; ***p < .001.
A substantial part of the differences in track recommendations was explained by students’ prior performance (test‐based recommendations: RModel22 = 84.38%; judgement‐based recommendations: RModel22 = 75.85%). For test‐based recommendations, results indicated that the school leavers’ test explained a larger part of track recommendations than students’ reading comprehension and mathematics performance (school leavers’ test: RModel2a2 = 82.37%; reading comprehension and mathematics performance: RModel2b2 = 70.79%).
Student level
The results of the multilevel mediation analyses are presented in Figure 2 (test‐based recommendations) and Figure 3 (judgement‐based recommendations). In line with our expectations, at student level, the models revealed significant positive indirect effects (path ab) of students’ SES on test‐based recommendations through students’ prior performance (school leavers’ test: = .08, p < .001; reading comprehension: = .03, p < .001; mathematics: = .03, p < .001). Similar results were reported for judgement‐based recommendations (reading comprehension: = .07, p < .001; mathematics: = .10, p < .001). The higher the students’ SES was, the better they performed and the higher the track recommendation they received.
Figure 2.

Results of the multilevel mediation model for test‐based recommendations. *p < .05; **p < .01; ***p < .001.
Figure 3.

Results of the multilevel mediation model for judgement‐based recommendations. *p < .05; **p < .01; ***p < .001.
Additionally, in line with our expectations, SES significantly affected judgement‐based recommendations ( = .03, p = .009), but did not affected test‐based recommendations ( = .01, p = .663) (path c’). For judgement‐based recommendations, regardless of their prior performance the higher the students’ SES was, the higher the track recommendation they received. This finding corresponded to an effect size of 0.03, which can be interpreted as an extremely small effect. This effect indicated that students with a SES of one standard deviation below average received a track recommendation of 0.03 lower than students with a SES of one standard deviation above average.1 However, the difference between test‐based and judgement‐based recommendations regarding the direct impact of SES on student level was not significant (z = −1.27, p = .102), indicating that there was no significant difference between the two types of recommendations.
School level
At school level, the multilevel mediation models presented significant positive indirect effects (path ab) of students’ SES through students’ prior performance on test‐based (reading comprehension: = .09, p = .044; school leavers’ test: = .37, p < .001) and judgement‐based recommendations (reading comprehension: b = .26, p < .001; mathematics: b = .20, p < .001). For test‐based recommendations, the indirect effect of students’ prior mathematics performance was not statistically significant (b = .00, p = .885). In addition, a direct effect of SES (path c’) on track recommendations at school level was reported for both recommendations (test‐based recommendations: = .26, p < .001; judgement‐based recommendations: = .25, p < .001). These results corresponded to effect sizes of 0.19 for both types of recommendations, which can be interpreted as small effects. In addition, the difference between test‐based and judgement‐based recommendations regarding the direct impact of SES at school level was not significant (z = .14, p = .446), indicating that there was no significant difference between the two types of recommendations.
Discussion
There is an ongoing (political) debate concerning the improvement of educational equality in track recommendations at the transition from primary to secondary education. A policy reform of the Dutch educational system provided us the unique opportunity to compare the direct and indirect effects of students’ SES on two types of school track recommendations: test‐based and judgement‐based recommendations. We used a multilevel mediation approach to examine how these effects of students’ SES on track recommendations were distributed across student and school level. Overall, as expected, track recommendations were higher for high‐SES students. This was primarily due to indirect effects; that is, SES affected prior performance, and, in turn, students’ prior performance affected their track recommendations. Moreover, a small direct effect of students’ SES on judgement‐based recommendations was reported, suggesting that students with different SES but similar prior performance received different track recommendations. In addition, the results indicated that the effects are – at least partly – situated at school level. In general, track recommendations tended to be higher at schools with a population of high‐SES students, irrespective of students’ prior performance. However, these effects were small and the differences between the two types of track recommendations were not significant. These findings did not entirely support the assumption that judgement‐based track recommendations are more biased than test‐based recommendations (Boone & Van Houtte, 2013; Driessen et al., 2008; OECD, 2016; Van Nuland, 2011). Consequently, the shift to judgement‐based recommendations did not seem to lead to a decrease of educational equality. Students’ SES played solely a minor role in teachers’ track recommendations, and the use of the school leavers’ test in test‐based recommendations did not seem to reduce this effect of SES.
Contrary to previous research (Bol et al., 2014; Caro et al., 2009; Luyten & Bosker, 2004), there was no significant difference between test‐based recommendations and judgement‐based recommendations regarding the impact of students’ SES. This finding revealed that, in this context, both types of recommendations were comparable with regard to the (small) impact of students’ SES on track recommendations. Luyten and Bosker (2004) reported that not administering a school leavers’ test strengthened the impact of SES on track recommendations, whereas the present study provided no support for this finding. There were no differences with regard to the effect of SES on track recommendations between teachers who had access to the results of the school leavers’ test and teachers who had no access to these results. The results of the school leavers’ test did not add additional information when students’ prior performance in mathematics and reading comprehension was already available to teachers. These findings suggested that teachers relied more strongly on students’ prior performance in mathematics and reading comprehension when results of the school leavers’ test were not available. However, in situations where all performance indicators were available (i.e., when using test‐based recommendations), teachers relied more strongly on the results of the school leavers’ test when formulating a track recommendation instead of relying on reading comprehension and mathematics test results. Students’ prior performance explained only 70.8% of the variance in test‐based recommendations and 75.9% of the variance in judgement‐based recommendations. When the school leavers’ test was included, 84.4% of the variance in test‐based recommendations was explained by students’ prior performance and the school leavers’ test together. Overall, regarding educational equality based on SES, it did not seem to matter whether test‐based or judgement‐based recommendations were used.
Finally, by using multilevel analyses, we were able to examine the effects of SES on track recommendations at student and school level, while previous research (Boone et al., 2018; Timmermans et al., 2015) focused primarily on student or class level. The present study reported no direct effect of students’ SES on test‐based track recommendations at student level but did report a significant direct effect at school level. These results suggested that there were no differences between test‐based recommendations of students with different SES but similar performance in the same school, whereas these differences were present between schools. In other words, schools with similar performance but a different population provided different track recommendations. Consequently, it did seem to matter which school students attended. Contrary, although the effect was extremely small, a direct effect of SES on judgement‐based recommendations existed at student level. This is in line with results of prior research (Bol et al., 2014; Caro et al., 2009; Schneider & Tieben, 2011), revealing that track recommendations were less influenced by SES when they were based on standardized test results instead of teachers’ judgements. Because a direct effect of SES on both types of track recommendations existed at school level, we did not find evidence for the speculations of Boone et al. (2018) that the impact of SES class composition would be more pronounced in educational systems with binding track recommendations as a result of more (high‐SES) parent pressure. They suggested that teachers who were held accountable more strongly for their recommendations, for example, when track recommendations were binding, were less prone to be biased by students’ background. We did not find evidence supporting this hypothesis.
Limitations and future research
One limitation of the present study is the specific context of this research. The present study was conducted in a large city in the Netherlands, which might affect generalizability to other Dutch regions and countries with different educational systems. School track recommendations may be formulated differently in other countries. In addition, even within the Netherlands, regions have different regulations with regard to formulating track recommendations. The city our data originate from allowed solely singular track recommendations. In other regions, it is possible to formulate track recommendations of adjacent tracks. Previous research (Oomens et al., 2019) reported that 20% to 25% of the primary schools used such combined recommendations.
We focused on initial track recommendations formulated in March, not on the actual track placement. These initial recommendations reflect primarily how teachers formulate a track recommendation. Moreover, including the initial track recommendation allowed us to compare both types of track recommendations. Because the complete procedure of formulating track recommendations and the actual track placement is much more complex, and both types of track recommendations differ in more aspects than included (Oomens et al., 2019), this is beyond the scope of the present research. For example, for test‐based recommendations, results of the school leavers’ test were available to teachers, whereas for judgement‐based recommendations, these results were not available because of a changed time schedule. However, students still make the nationwide school leavers’ test, but the results primarily serve as a second opinion. Primary school teachers are allowed to adjust their initial recommendations when the school leavers’ test results are higher than the initial track recommendation (Korpershoek et al., 2016; Oomens et al., 2019). Prior research (Dutch Ministry of Education Culture and Science, 2019; Oomens et al., 2019; Van Look & Van Tartwijk, 2018) has indicated that in most situations in which students were eligible for upward corrections, the initial track recommendation was not corrected. Moreover, a policy evaluation report of Oomens et al. (2019) indicated that corrections of the initial track recommendations did not increase educational equity. Based on parental education, as can be seen as an indicator of SES, equal percentages of corrections were reported for students with low‐educated and high‐educated parents. In addition, the degree of urbanity seemed to be related to these track recommendation corrections. In larger cities, the number of corrections was higher, as well as parental pressure (Oomens et al., 2019). This may also decrease educational equity. Future research could include these topics regarding track recommendation corrections.
In addition, the percentage of missing values across the variables was considerably low (between 0.1% and 1.3% of the total sample), except for the variable school leavers’ test. Of the school leavers’ test, there were only 35.4% complete records in the sample of the first two cohorts. As explained before, this was due to guidelines of the online student monitoring platform, where our data were downloaded from. Until the policy reform, it was not mandatory to upload students’ scores on the school leavers’ test, and consequently, most teachers did not upload them. Analyses of the missing values on the variable school leavers’ test indicated some signs of attrition bias, which may have impacted our findings. Yet, although there were indications of bias, it is important to note that these effects were small (i.e., d < 0.26). These missing values may be due to schools not having students with lower performance levels, which are more often low‐SES students, or do not upload the school leavers’ test results because it may impact the overall results of the school (Dutch Inspectorate of Education, 2012; Swart et al., 2019). Remarkably, similar missing values for the school leavers’ test were identified in other research (Boone & Van Houtte, 2013; Timmermans et al., 2015). Future research could investigate the underlying causes of this missingness further, as well as the effects on students’ track recommendations.
Another limitation of the present study was that we reported a small significant difference between the two cohorts after the policy reform (i.e., cohorts 3 and 4). The direct effect of SES on track recommendations at student level was significant in cohort 4 and not significant in cohort 3. Before the policy reform (i.e., cohorts 1 and 2), this direct effect on student level was also not significant. It might be that this effect was not yet visible in cohort 3 but emerging in cohort 4 (and potentially in later cohorts). This leads to an interesting question for future research.
Finally, in the present study, SES was determined using this six‐digit postal code. For Dutch cities, the six‐digit postal codes are, on average, shared by only 15 to 20 households, providing an accurate impression of those households (Deckers et al., 2016; Guhn et al., 2010; Van Hattem et al., 2009). However, the six‐digit classification contained missing values and, therefore, we replaced missing values with the five‐digit classification that is less precise. Moreover, using the postal codes for measuring SES rather than an individual measure of SES could have resulted in a small overlap between students’ individual SES and school SES. This could affect the results: We presented a school‐level effect of SES on track recommendations, while a part of this effect may actually be situated at the individual level.
For both recommendations, despite the strong effect of students’ prior performance on track recommendations, still 20% of the variance was unexplained either by students’ SES or prior performance. Previous research (Geven et al., 2018; Hornstra et al., 2013; Kaiser et al., 2013; Lleras, 2008) indicated that teachers could also take students’ non‐cognitive characteristics into account, such as work attitude and motivation. In order to decrease the performance gap based on SES, further research on this topic is needed. Above that, revealing the psychological mechanisms of recommendation bias are important for understanding the formulation of track recommendations and creating equal opportunities to be assigned to a certain secondary school track for all students. This could be included in future research.
Conclusion
Altogether, the findings suggested that teachers were capable of appropriately formulating school track recommendations relying mostly on students’ prior performance without being biased by students’ SES. Students’ results on the school leavers’ test did not seem to be of added value to formulate appropriate school track recommendations. Moreover, it was not the type of track recommendation that was important for educational equality at the transition from primary to secondary education, but rather which and how much (objective) information was available to the teacher when formulating a recommendation.
Conflicts of Interest
The authors declare no conflict of interest.
Author Contribution
Anne van Leest, M.D. (Conceptualization; Formal analysis; Investigation; Writing – original draft) Lisette Hornstra (Writing – review & editing) Jan van Tartwijk (Conceptualization; Writing – review & editing) Janneke van de Pol (Writing – review & editing)
Acknowledgements
This work was supported by funding from the Dutch Ministry of Education, Culture and Science (grant number OCW/PromoDoc/1065001). The authors would like to thank Renske de Kleijn and Karin van Look for their help with retrieving and the data.
Footnotes
The direct effect of SES on track recommendations at student level was significant in cohort 4 ( = .04, p = .016), but not significant in cohort 3 ( = .03, p = .122). Further elaboration of this finding is included in the discussion section.
Data Availability Statement
Research data are not shared.
References
- Bakker, J. , Denessen, E. , & Brus‐Laeven, M. (2007). Socio‐economic background, parental involvement and teacher perceptions of these in relation to pupil achievement. Educational Studies, 33(2), 177–192. 10.1080/03055690601068345 [DOI] [Google Scholar]
- Barg, K. (2013). The influence of students’ social background and parental involvement on teachers’ school track choices: Reasons and consequences. European Sociological Review, 29(3), 565–579. 10.1093/esr/jcr104 [DOI] [Google Scholar]
- Bol, T. , Witschge, J. , Van de Werfhorst, H. G. , & Dronkers, J. (2014). Curricular tracking and central examinations: Counterbalancing the impact of social background on student achievement in 36 countries. Social Forces, 92(4), 1545–1572. 10.1093/sf/sou003 [DOI] [Google Scholar]
- Bonizzoni, P. , Romito, M. , & Cavallo, C. (2016). Teachers’ guidance, family participation and track choice: The educational disadvantage of immigrant students in Italy. British Journal of Sociology of Education, 37(5), 702–720. 10.1080/01425692.2014.982860 [DOI] [Google Scholar]
- Boone, S. , Thys, S. , Van Avermaet, P. , & Van Houtte, M. (2018). Class composition as a frame of reference for teachers? The influence of class context on teacher recommendations. British Educational Research Journal, 44(2), 274–293. 10.1002/berj.3328 [DOI] [Google Scholar]
- Boone, S. , & Van Houtte, M. (2013). Why are teacher recommendations at the transition from primary to secondary education socially biased? A mixed‐methods research. British Journal of Sociology of Education, 34(1), 20–38. 10.1080/01425692.2012.704720 [DOI] [Google Scholar]
- Bradley, R. H. , & Corwyn, R. F. (2002). Socioeconomic status and child development. Annual Review of Psychology, 53(1), 371–399. 10.1146/annurev.psych.53.100901.135233. [DOI] [PubMed] [Google Scholar]
- Brame, R. , Paternoster, R. , Mazerolle, P. , & Piquero, A. (1998). Testing for the equality of maximum‐likelihood regression coefficients between two independent equations. Journal of Quantitative Criminology, 14(3), 245–261. 10.1023/A:1023030312801 [DOI] [Google Scholar]
- Burstein, L. (1980). The analysis of multilevel data in educational research and evaluation. Review of Research in Education, 8(1), 158–233. 10.3102/0091732X008001158. [DOI] [Google Scholar]
- Caro, D. H. , Lenkeit, J. , Lehmann, R. , & Schwippert, K. (2009). The role of academic achievement growth in school track recommendations. Studies in Educational Evaluation, 35(4), 183–192. 10.1016/j.stueduc.2009.12.002 [DOI] [Google Scholar]
- Cohen, J. (1988). Some issues in power analysis. Cohen J. In Lawrence Erlbaum Associates (Ed.), Statistical power analysis for the behavioral sciences, 2(1–567). New York: Lawrence Erlbaum Associates Inc. 10.4324/9780203771587. [DOI] [Google Scholar]
- Constantino, R. (2005). Print environments between high and low socioeconomic (SES) communities. Teacher Librarian, 32(3), 22–26. [Google Scholar]
- Contini, D. , & Scagni, A. (2011). Inequality of opportunity in secondary school enrolment in Italy, Germany and the Netherlands. Quality & Quantity, 45(2), 441–464. 10.1007/s11135-009-9307-y [DOI] [Google Scholar]
- Danesh, J. , Gault, S. , Semmence, J. , Appleby, P. , & Peto, R. (1999). Postcodes as useful markers of social class: Population based study in 26,000 British households. BMJ, 318(7187), 843–845. https://doi‐org.proxy.library.uu.nl/10.1136/bmj.318.7187.843 [DOI] [PMC free article] [PubMed] [Google Scholar]
- De Boer, H. , Bosker, R. J. , & Van der Werf, M. P. C. (2010). Sustainability of teacher expectation bias effects on long‐term student performance. Journal of Educational Psychology, 102(1), 168–179. 10.1037/a0017289 [DOI] [Google Scholar]
- Deckers, I. E. , Janse, I. C. , Van der Zee, H. H. , Nijsten, T. , Boer, J. , Horváth, B. , & Prens, E. P. (2016). Hidradenitis suppurativa (HS) is associated with low socioeconomic status (SES): A cross‐sectional reference study. Journal of the American Academy of Dermatology, 75(4), 755–759.e1. 10.1016/j.jaad.2016.04.067 [DOI] [PubMed] [Google Scholar]
- Dollmann, J. (2016). Less choice, less inequality? A natural experiment on social and ethnic differences in educational decision‐making. European Sociological Review, 32(2), 203–215. 10.1093/esr/jcv082 [DOI] [Google Scholar]
- Driessen, G. (2005). De totstandkoming van de adviezen voortgezet onderwijs: Invloeden van thuis en school. [The development of school track recommendations for secondary education: The impact of home and school]. Pedagogiek, 25(4), 279–298. [Google Scholar]
- Driessen, G. , Sleegers, P. , & Smit, F. (2008). The transition from primary to secondary education: Meritocracy and ethnicity. European Sociological Review, 24(4), 527–542. 10.1093/esr/jcn018 [DOI] [Google Scholar]
- Dronkers, J. , Van Erp, M. , Robijn, M. , & Roeleveld, J. (1998). Krijgen leerlingen in de grote steden en met name in Amsterdam te hoge adviezen? De relaties tussen taal‐ en rekenscores en advies binnen en buiten de Randstand onderzocht. [Do students in big cities receive too high school track recommendations?]. Tijdschrift voor Onderwijsresearch, 23, 17–30. [Google Scholar]
- Dutch Board of Tests and Examinations (2015). Verantwoording: Centrale eindtoets po. [Accountability: Central end of primary education test], (1–70). Utrecht: Dutch Board of Tests and Examinations. [Google Scholar]
- Dutch Inspectorate of Education (2012). De beoordeling van opbrengsten in het basisonderwijs. [The assessment of educational achievement in primary education], 1–28. Utrecht: Dutch Inspectorate of Education; [Google Scholar]
- Dutch Inspectorate of Education (2018a). De staat van het onderwijs 2016/2017: Technisch rapportage onderwijskansen en segregatie [Report of education 2016/2017: Technical report of educational opportunities and segregation] (Issue April), 1–143. Dutch Ministry of Education, Culture and Science. Utrecht: Dutch Inspectorate of Education; [Google Scholar]
- Dutch Inspectorate of Education (2018b). Jaarwerkplan 2018: Doelen en activiteiten Inspectie van het Onderwijs. [Annual work plan 2018: Goals and activities of Inspectorate of Education], (1–28). Utrecht: Dutch Inspectorate of Education. [Google Scholar]
- Dutch Ministry of Education Culture and Science (2014). Toelating voortgezet onderwijs gebaseerd op definitief schooladvies. [Admission secondary education is based on final school track recommendation]. https://www.rijksoverheid.nl/onderwerpen/schooladvies‐en‐eindtoets‐basisschool/toelating‐voortgezet‐onderwijs‐gebaseerd‐op‐definitief‐schooladvies.
- Dutch Ministry of Education Culture and Science (2019). Gelijke kansen in het onderwijs. [Equal educational opportunities]. https://www.ocwincijfers.nl/onderwijs/dashboard‐gelijke‐kansen.
- Enders, C. K. , & Tofighi, D. (2007). Centering predictor variables in cross‐sectional multilevel models: A new look at an old issue. Psychological Methods, 12(2), 121–138. 10.1037/1082-989X.12.2.121 [DOI] [PubMed] [Google Scholar]
- Feenstra, H. , Kamphuis, F. , Kleintjes, F. , & Krom, R. (2010). COTAN Leerling‐ en onderwijsvolgsysteem: Begrijpend lezen groep 3 t/m 6. [COTAN Student monitoring system: Reading comprehension in grade 1–6]. Arnhem: Cito. [Google Scholar]
- Feron E., Schils T., Weel B. (2016). Does the teacher beat the test? The Value of the teacher’s assessment in predicting student ability. De Economist, 164, (4), 391–418. 10.1007/s10645-016-9278-z. [DOI] [Google Scholar]
- Fiske, S. T. , & Neuberg, S. L. (1990). A continuum of impression formation, from category‐based to individuating processes: Influences of information and motivation on attention and interpretation. Advances in Experimental Social Psychology, 23, 1–74. 10.1016/S0065-2601(08)60317-2 [DOI] [Google Scholar]
- Geven, S. , Batruch, A. , & Van de Werfhorst, H. G. (2018). Inequality in teacher judgements, expectations and track recommendations: A review study, (1–78). Amsterdam: Amsterdam Institute for Social Science Research (AISSR). [Google Scholar]
- Glock, S. , & Krolak‐Schwerdt, S. (2013). Does nationality matter? The impact of stereotypical expectations on student teachers’ judgments. Social Psychology of Education, 16(1), 111–127. 10.1007/s11218-012-9197-z [DOI] [Google Scholar]
- Glock, S. , Krolak‐Schwerdt, S. , Klapproth, F. , & Böhmer, M. (2012). Improving teachers’ judgments: Accountability affects teachers’ tracking decisions. International Journal of Technology and Inclusive Education, 1(2), 89–98. [Google Scholar]
- Guhn, M. , Gadermann, A. M. , Hertzman, C. , & Zumbo, B. D. (2010). Children’s development in kindergarten: A multilevel, population‐based analysis of ESL and gender effects on socioeconomic gradients. Child Indicators Research, 3(2), 183–203. 10.1007/s12187-009-9053-7 [DOI] [Google Scholar]
- Hoover‐Dempsey, K. V. , Bassler, O. C. , & Brissie, J. S. (1992). Explorations in parent‐school relations. The Journal of Educational Research, 85(5), 287–294. [Google Scholar]
- Hornstra, L. , Van der Veen, I. , Peetsma, T. , & Volman, M. (2013). Developments in motivation and achievement during primary school: A longitudinal study on group‐specific differences. Learning and Individual Differences, 23, 195–204. 10.1016/j.lindif.2012.09.004 [DOI] [Google Scholar]
- Hox, J. J. , Moerbeek, M. , & Van de Schoot, R. (2018). The basic two‐level regression model. Multilevel analysis: Techniques and applications, Quantitative methodology series, (3ed., 1–347). New York: Routledge. [Google Scholar]
- Janssen, J. , Verhelst, N. , Engelen, R. , & Scheltens, F. (2010). COTAN Wetenschappelijke verantwoording van de toetsen LOVS rekenen‐wiskunde voor groep 3 t/m 8. [COTAN Scientific justification of the mathematics test in grade 1–6, (1–96). Arnhem: Cito. [Google Scholar]
- Johnson, D. R. , & Creech, J. C. (1983). Ordinal measures in multiple indicator models: A simulation study of categorization error. American Sociological Review, 48(3), 398–407. [Google Scholar]
- Jungbluth, P. (2003). De ongelijke basisschool: Etniciteit, sociaal milieu, sekse, verborgen differentiatie, segregatie, onderwijskansen en schooleffectiviteit. [The unequal primary school], (1–194). Nijmegen: ITS. [Google Scholar]
- Kaiser, J. , Retelsdorf, J. , Südkamp, A. , & Möller, J. (2013). Achievement and engagement: How student characteristics influence teacher judgments. Learning and Instruction, 28, 73–84. 10.1016/j.learninstruc.2013.06.001 [DOI] [Google Scholar]
- Klapproth, F. , & Fischer, B. D. (2000). Preservice teachers’ evaluations of students’ achievement development in the context of school‐track recommendations. European Journal of Psychology of Education, 34, 825–846. 10.1007/s10212-018-0405-x [DOI] [Google Scholar]
- Klapproth, F. , Glock, S. , Böhmer, M. , Krolak‐Schwerdt, S. , & Martin, R. (2012). School placement decisions in Luxembourg: Do teachers meet the Education Ministry’s standards? The Literacy Information and Computer Education Journal, 1(1), 765–71. [Google Scholar]
- Klapproth, F. , Glock, S. , Krolak‐Schwerdt, S. , Martin, R. , & Böhmer, M. (2013). Prädiktoren der sekundarschulempfehlung in Luxemburg: Ergebnisse einer large‐scale‐untersuchung [Predictors of recommendations for secondary school type in Luxembourg]. Zeitschrift Fur Erziehungswissenschaft, 16(2), 355–379. 10.1007/s11618-013-0340-1 [DOI] [Google Scholar]
- Knoester, M. , & Au, W. (2017). Standardized testing and school segregation: Like tinder for fire? Race Ethnicity and Education, 20(1), 1–14. 10.1080/13613324.2015.1121474 [DOI] [Google Scholar]
- Korpershoek, H. , Beijer, C. , Spithoff, M. , Naaijer, H. M. , Timmermans, A. C. , van Rooijen, M. , Vugteveen, J. , & Opdenakker, M.‐C. (2016). Overgangen en aansluitingen in het onderwijs. Deelrapportage 1: Reviewstudie naar de po‐vo en de vmbo‐mbo overgang. [Transitions and interconnections in education: Report 1], (1–164). Groningen: GION Onderwijs/Onderzoek. [Google Scholar]
- Krolak‐Schwerdt, S. , Böhmer, M. , & Gräsel, C. (2013). The impact of accountability on teachers’ assessments of student performance: A social cognitive analysis. Social Psychology of Education, 16(2), 215–239. 10.1007/s11218-013-9215-9 [DOI] [Google Scholar]
- Le Métais, J. (2003). Transition from primary to secondary education in selected countries of the INCA website, (1–19). Slough, England: National Foundation for Educational Research (NFER). [Google Scholar]
- LeTendre, G. K. , Hofer, B. K. , & Shimizu, H. (2003). What is tracking? Cultural expectations in the United States, Germany, and Japan. American Educational Research Journal, 40(1), 43–89. 10.3102/00028312040001043 [DOI] [Google Scholar]
- Lleras, C. (2008). Do skills and behaviors in high school matter? The contribution of noncognitive factors in explaining differences in educational attainment and earnings. Social Science Research, 37(3), 888–902. 10.1016/j.ssresearch.2008.03.004 [DOI] [Google Scholar]
- Luyten, H. , & Bosker, R. J. (2004). Hoe meritocratisch zijn schooladviezen? [To what extent are track recommendations meritocratic?]. Pedagogische Studiën, 81, 89–103. [Google Scholar]
- Milne, A. , & Plourde, L. A. (2006). Factors of a low‐SES household: What aids academic achievement? Journal of Instructional Psychology, 33(3), 183–193. [Google Scholar]
- Norman, G. (2010). Likert scales, levels of measurement and the “laws” of statistics. Advances in Health Sciences Education, 15(5), 625–632. 10.1007/s10459-010-9222-y [DOI] [PubMed] [Google Scholar]
- OECD (2016). Netherlands 2016: Foundations for the future, Reviews of National Policies for Education(1–158). Paris: OECD Publishing; [Google Scholar]
- Oomens, M. , Scholten, F. , & Luyten, H. (2019). Evaluatie wet eindtoetsing po [Evaluation report of the end of primary school test policy, (1–128). Utrecht: Oberon, Twente University. [Google Scholar]
- Peterson, E. R. , Rubie‐Davies, C. M. , Osborne, D. , & Sibley, C. (2016). Teachers’ explicit expectations and implicit prejudiced attitudes to educational achievement: Relations with student achievement and the ethnic achievement gap. Learning and Instruction, 42, 123–140. 10.1016/j.learninstruc.2016.01.010 [DOI] [Google Scholar]
- Pietsch, M. , & Stubbe, T. C. (2007). Inequality in the transition from primary to secondary school: School choices and educational disparities in Germany. European Educational Research Journal, 6(4), 424–445. 10.2304/eerj.2007.6.4.424 [DOI] [Google Scholar]
- Primary Education Council, & Secondary Education Council (2014). Handreiking schooladvies. [School track recommendation report] (pp. 1–9). Nijmegen: ITS. [Google Scholar]
- Ready, D. D. , & Wright, D. L. (2011). Accuracy and inaccuracy in teachers’ perceptions of young children’s cognitive abilities: The role of child background and classroom context. American Educational Research Journal, 48(2), 335–360. 10.3102/0002831210374874 [DOI] [Google Scholar]
- Riley, T. , & Ungerleider, C. (2012). Self‐fulfilling prophecy: How teachers’ attributions, expectations, and stereotypes influence the learning opportunities afforded aboriginal students. Canadian Journal of Education / Revue Canadienne de l’éducation, 35(2), 303–333. [Google Scholar]
- Rockwood, N. J. (2017a). Advancing the formulation and testing of multilevel mediation and moderated mediation models, (1–176). Ohio: The Ohio State University, Department of Psychology. [Google Scholar]
- Rockwood, N. J. (2017b). MLmed user guide, (1–16). Ohio: The Ohio State University, Department of Psychology. [Google Scholar]
- Rockwood, N. J. , & Hayes, A. F. (2017). MLmed: An SPSS macro for multilevel mediation and conditional process analysis, (1–31). Ohio: The Ohio State University, Department of Psychology; [Google Scholar]
- Schafer, J. L. , & Graham, J. W. (2002). Missing data: Our view of the state of the art. Psychological Methods, 7(2), 147–177. 10.1037/1082-989X.7.2.147 [DOI] [PubMed] [Google Scholar]
- Schneider, S. L. , & Tieben, N. (2011). A healthy sorting machine? Social inequality in the transition to upper secondary education in Germany. Oxford Review of Education, 37(2), 139–166. 10.1080/03054985.2011.559349 [DOI] [Google Scholar]
- Cito (2016). Tabellen tussenopbrengsten Cito LVS. [Results of student monitoring tests in primary education, (1–15). Arnhem: Cito. [Google Scholar]
- Sirin, S. R. (2005). Socioeconomic status and academic achievement: A meta‐analytic review of research. Review of Educational Research, 75(3), 417–453. 10.3102/00346543075003417 [DOI] [Google Scholar]
- Sorhagen, N. S. (2013). Early teacher expectations disproportionately affect poor children’s high school performance. Journal of Educational Psychology, 105(2), 465–477. 10.1037/a0031754 [DOI] [Google Scholar]
- Sullivan, G. M. , & Artino, A. R. (2013). Analyzing and interpreting data from Likert‐type scales. Journal of Graduate Medical Education, 5(4), 541–542. 10.4300/jgme-5-4-18 [DOI] [PMC free article] [PubMed] [Google Scholar]
- Swart, L. , Van den Berge, W. , & Visser, D. (2019). De waarde van eindtoetsen in het primair onderwijs, (1–13). [The value of school leavers’ tests in primary education]. Den Haag: CPB Netherlands Bureau for Economic Policy Analysis; [Google Scholar]
- Tieben, N. , & Wolbers, M. (2010). Success and failure in secondary education: Socio‐economic background effects on secondary school outcome in the Netherlands, 1927–1998. British Journal of Sociology of Education, 31(3), 277–290. 10.1080/01425691003700516 [DOI] [Google Scholar]
- Timmermans, A. C. , Kuyper, H. , & Van der Werf, M. P. C. (2015). Accurate, inaccurate, or biased teacher expectations: Do Dutch teachers differ in their expectations at the end of primary education? British Journal of Educational Psychology, 85(4), 459–478. 10.1111/bjep.12087 [DOI] [PubMed] [Google Scholar]
- Van Boxtel, H. W. , Engelen, R. , & De Wijs, A. (2011). Wetenschappelijke verantwoording van de eindtoets basisonderwijs 2010, (1–100). Arnhem: Cito; [Google Scholar]
- Van der Aa, M. A. , De Vries, E. , Hoekstra, H. J. , Coebergh, J. W. W. , & Siesling, S. (2011). Sociodemographic factors and incidence of melanoma in the Netherlands, 1994–2005. European Journal of Cancer, 47(7), 1056–1060. 10.1016/j.ejca.2010.11.020 [DOI] [PubMed] [Google Scholar]
- Van Hattem, S. , Aarts, M. J. , Louwman, W. J. , Neumann, H. A. M. , Coebergh, J. W. W. , Looman, C. W. N. , Nijsten, T. , & De Vries, E. (2009). Increase in basal cell carcinoma incidence steepest in individuals with high socioeconomic status: Results of a cancer registry study in the Netherlands. British Journal of Dermatology, 161(4), 840–845. 10.1111/j.1365-2133.2009.09222.x [DOI] [PubMed] [Google Scholar]
- Van Leeuwen, N. (2019). Statistische gegevens per vierkant en postcode 2018–2017‐2016‐2015. [Statistical data per postal code of years 2018–2017‐2016‐2015]. Den Haag: Statistics Netherlands (CBS). [Google Scholar]
- Van Look, K. , & Van Tartwijk, J. (2018). Onderwijskansen in Utrecht, (1–93). Utrecht: Utrecht University, Oberon, SEO. [Google Scholar]
- Van Nuland, H. J. C. (2011). Eliciting classroom motivation: Not a piece of cake, (1–152). Leiden: Leiden University. [Google Scholar]
- Zumbo, B. D. , & Zimmerman, D. W. (1993). Is the selection of statistical methods governed by level of measurement? Canadian Psychology/Psychologie Canadienne, 34(4), 390–400. 10.1037/h0078865 [DOI] [Google Scholar]
Associated Data
This section collects any data citations, data availability statements, or supplementary materials included in this article.
Data Availability Statement
Research data are not shared.