Abstract
The National Kidney Registry (NKR) Advanced Donation Program enables living donors the opportunity to donate altruistically, or in advance of a potential recipient's transplant, and to receive a voucher that can be redeemed for a future transplant facilitated by the NKR. Family vouchers allow a donor to identify multiple individuals within their immediate family, with the first person in that group in need of a transplant being prioritized to receive a kidney. An increase in vouchers introduces concerns that demand for future voucher redemptions could exceed the supply of available donors and kidneys. A Monte Carlo simulation model was constructed to estimate the annual number of voucher redemptions relative to the number of kidneys available over a 50‐year time horizon under several projected scenarios for growth of the program. In all simulated scenarios, the number of available kidneys exceeded voucher redemptions every year. While not able to account for all real‐life scenarios, this simulation study found that the NKR should be able to satisfy the likely redemption of increasing numbers of vouchers under a range of possible scenarios over a 50‐year time horizon. This modeling exercise suggests that a donor family's future needs can be satisfied through the voucher program.
Keywords: donors and donation: living, donors and donation: paired exchange, ethics, ethics and public policy, kidney transplantation/nephrology, kidney transplantation: living donor, simulation
A data‐based Monte Carlo simulation model applied over a 50‐year horizon suggests that current practices would meet future needs for kidney redemptions through the Family Voucher Program. Englesbe and Pearson's editorial is on page 923.

Abbreviations
- KPD
kidney paired donation
- LDKT
living donor kidney transplant
- NKR
National Kidney Registry
1. INTRODUCTION
Kidney paired donation (KPD) has increased opportunities for incompatible pairs to receive living donor kidney transplants (LDKTs). The NKR (National Kidney Registry) is the largest paired donation organization in the United States. From 2008 to 2019, the NKR successfully transplanted over 3500 donor‐recipient pairs (www.kidneyregistry.org, accessed September 6, 2019). NKR‐facilitated transplants have demonstrated equivocal or improved graft outcomes compared to LDKTs nationally and allow for patients in need of retransplantation and hyperimmunized patients to benefit from LDKT in greater numbers. 1
While initial KPD swaps and chains were performed nearly simultaneously, a donor's need to donate in 2008 before his incompatible recipient was scheduled to receive a kidney from a nondirected donor resulted in a departure from this standard. 2 This was the first instance of advanced donation and the beginning of a series of advancements allowing for greater separation of time between donor and recipient surgeries for pairs who are chronologically incompatible. 3 The NKR developed the Advanced Donation Program (ADP) to support KPDs in these increasingly complex scenarios (see Table 1 for definitions). 4 When a patient donates to a recipient before their intended recipient receives a kidney, a voucher is issued, enabling their intended recipient to redeem the voucher and receive a KPD transplant if needed. In the original implementation of the program, the voucher is issued to a single, intended recipient, with known history of disease and an expected future transplant need, and can be redeemed if, and when, a kidney transplant is necessary. The first voucher advanced donation facilitated by the NKR took place in 2014 when a 64‐year‐old grandfather donated a kidney to a nonrelated individual. His 4‐year‐old grandson was provided with an NKR voucher for a future kidney transplant. The child had chronic kidney disease (CKD) and was expected to need a transplant in 10‐15 years, at which point the grandfather may have no longer been eligible to donate. 3 As of August 2, 2019, there have been a total of 296 advanced donations, with the time between procedures ranging from several days to years (NKR Quarterly Report, www.kidneyregistry.org, accessed September 6, 2019).
TABLE 1.
Terminology and definitions related to the advanced donation program
| Term | Definition |
|---|---|
| Advanced donation program ADP | Donors donate before intended recipient is transplanted |
| ADP swap saver | Donor donates to keep a swap intact when their paired recipient gets sick |
| ADP real‐time swap failure repair | Donor donates and the donor's paired recipient does not receive a kidney due to a swap failure |
| ADP standard voucher | Donor donates before their intended recipient is scheduled for transplant surgery |
| ADP family voucher | Donor donates before knowing whether their intended recipients will ever need a transplant |
| Voucher donor | Person donating a kidney and generating 1 or more vouchers |
| Voucher holder | Person in possession of a voucher |
| Voucher redemption | Occurs when a voucher holder receives a kidney transplant |
In examining ways to further increase LDKT, 1 rational concern commonly voiced by potential nondirected donors is, “what if my spouse or child needs a kidney someday and I’ve already donated?” The NKR Medical Board proposed offering a new type of voucher to protect family members of the living donors. In this new model, entitled the “Family Voucher program,” multiple healthy members of a donor's immediate family could each be issued a voucher, with the first person in that group in need of a transplant redeeming their voucher and being prioritized for an end‐chain living donor transplant. This Family Voucher program is expected to increase LDKT while providing additional security to donors and their family members with no increased risk of renal disease. While exciting, this innovation will likely increase the number of vouchers outstanding, raising concerns that demand for future voucher redemptions could exceed the supply of available kidneys to meet that demand. Thus, the goal of this effort is to address this redemption concern through a Monte Carlo simulation model.
2. MATERIALS AND METHODS
A Monte Carlo simulation model 5 was constructed to estimate the annual number of voucher redemptions relative to the number of kidneys available for transplant over a 50‐year time horizon under several projected scenarios. Monte Carlo computer simulation models are commonly used in a wide range of fields such as finance, insurance, and transportation to perform risk analyses in complex situations where it is not possible to mathematically calculate future values for important outcome variables and have been applied in projecting availability of donor livers 6 and impact of organ allocation strategies. 7 , 8 , 9 Our model tracks simulated donors and voucher holders until either a voucher is redeemed, the voucher holder dies, or the voucher “expires” (voucher holder reaches age 85 or another voucher holder from the same family redeems voucher). The flow of the model is depicted in Figure 1. The simulation model was programmed and run using ASP.NET 4.5.2.
FIGURE 1.
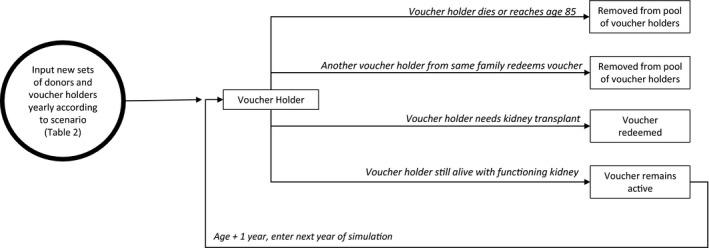
State transition diagram for simulation models
2.1. Input parameters
The circle in Figure 1 represents the model inputs for each yearly iteration: the number of donors donating kidneys through the NKR and the number of vouchers assigned by those donors. There are 4 categories of voucher holders. First, all living kidney donors who donate via the NKR receive a voucher for themselves. This voucher remains active until that donor dies or redeems the voucher and receives a kidney transplant. For category 2, each donor may designate vouchers for individuals who have received a prior kidney transplant, provided the transplant recipients are not in imminent need of a repeat allograft. The third category of voucher holders identifies individuals with ≥ stage 3 CKD and the fourth category identifies healthy immediate family members. In this simulation, donors are limited to a combined maximum of 5 vouchers for individuals in categories 2, 3, and 4. These vouchers remain active until 1 is redeemed or all voucher holders for a particular donor either reach age 85 or die. The annual changes in these inputs were varied across several different projected scenarios described in a following section.
2.2. Simulation modeling
Using the base input values discussed above, the simulation model addresses each voucher holder on a year‐by‐year basis for year 1 to year 50 by applying the appropriate probability distributions to estimate the outcome for each voucher holder in the current pool. These probability distributions and the source data on which they are based are described in a following section. Beginning with year 1, the model accesses the appropriate mortality probability distribution for each voucher holder in the pool to randomly determine his/her life or death status. For instance, based on the mortality distribution, suppose a 30‐year‐old voucher holder has a 0.03 chance of dying in the coming year. The model generates a random number between 0 and 1. If that number is 0.03 or less, the voucher holder is deemed to have died and is removed from the voucher pool, otherwise he or she remains and is included in the following year. Next, in a similar manner, depending on the voucher holder's health and prior transplant history, the model accesses the appropriate probability distribution to determine whether this individual will require a transplant, and therefore redeem their voucher in this particular year. Once a voucher tied to a particular donor is redeemed, all other voucher holders linked to that same donor are also removed from the pool. Finally, voucher holders reaching age 85 are also removed from the active voucher pool as most NKR‐affiliated transplant centers would consider this recipient age to be a contraindication for transplant.
After the model determines the status of each voucher holder, the number of eligible voucher holders is revised and their ages are increased by 1 year. As the model moves to the next simulated year, new donors and voucher holders are added per the scenario specifications. The model then continues to assess death and voucher redemption as described above and the iterations continue until 50 years are completed. This constitutes 1 replication for the scenario. Several output variables are generated for each year and each replication including number of available donors and number of voucher redemptions. The simulation is replicated 1000 times for each scenario to fully model the distribution of possible outcomes and provide precise percentile estimates.
2.3. Data sources for probability distributions
Ages of new voucher holders generated each year were randomly selected between the age of 2 and 65 years. The probabilities that a prior kidney transplant recipient would experience graft failure (and need a subsequent allograft) or death were defined using data from the SRTR (Scientific Registry of Transplant Recipients) on the 108 254 kidney transplant recipients transplanted between 1987 and 2013. This broad range was used to ensure sufficient sample size to estimate probabilities for specific combinations of year posttransplant (single‐year increments) and age at transplant (0‐10, 11‐20, 21‐30, 31‐40, 41‐50, 51‐60, and 61+). The probability that all other categories of voucher holders would require a kidney transplant (3.26%) was calculated as a weighted average of the risk of end‐stage renal disease (ESRD) for the general population (0.04%), CKD 3 (1.6%), CKD 4 (9.6%), and CKD 5 (58.2%), 10 , 11 based on the percentages of voucher holders in each group at the time of the simulation study. The probability of death for all voucher holders who were not prior kidney transplant recipients was defined using the general population death rates by age from the National Vital Statistics System (https://www.cdc.gov/nchs/nvss/mortality_tables.htm).
2.4. Voucher advanced donation scenarios
The simulation results for 5 different scenarios are reported in this analysis. Each scenario uses the same year 1 starting conditions based on the NKR’s current status at the time of model development: 2900 prior donors and 26 outstanding voucher donors (90% awarded to potential recipients with prior transplants, and 10% to recipients from the general population). In year 2, 66 new voucher donors were added (30% having had prior transplants, and 70% from the general population). The voucher donor growth rate and category of voucher holders for subsequent years depend on the scenario. An important aspect of the Voucher Advanced Donation program is that the NKR, through written and publicly available administrative policy, has decision‐making authority to determine the maximum yearly number of voucher donors added to the program and number of vouchers permitted per donor.
The 5 scenarios considered in this study represent situations ranging from most likely to extreme growth patterns for the Family Voucher program. These scenarios are defined as follows and summarized in Table 2. (1) Rapid Growth—the number of voucher donors increases by an average of 5% compounded year over year. Stated another way, the voucher program liability increases by 5% per year. (2) Slow Growth—the number of voucher donors grows slowly with an additional 2‐5 voucher donations per year. (3) Rapid Growth then Rapid Decline—the worst‐case scenario where the number of voucher donors grows rapidly for the first 25 years then declines rapidly for the next 25 years. For this scenario, voucher donors grow by 5% year over year for the first 25 years peaking at year 26, and the trend reverses by using the same values in reverse order through year 50. Thus, with this scenario, liabilities increase in the early years but coverage declines in later years when it is more likely that vouchers will be redeemed. (4) Slow Growth then Slow Decline—this scenario assumes voucher donors grow slowly (add 2‐5) for the first 25 years as in scenario 2 and then decline slowly (reduced by 2‐5) in each of the next 25 years. (5) Rapid Growth then Plateau—the rate of voucher donors grows at an average 5% rate each year for the first 25 years then remains constant in years 26‐50.
TABLE 2.
Projected growth scenarios used to define simulation inputs
| Scenario | Y 3‐25 | Y 26‐50 |
|---|---|---|
| (1) Rapid growth | 5% increase on all inputs per y | |
| (2) Slow growth | Add 2‐5 voucher donations per y; add 4 other donors per year | |
| (3) Rapid growth, rapid decline | 5% increase per y | Y 1‐25 values in reverse |
| (4) Slow growth, slow decline | Same as scenario (2) | Y 1‐25 values in reverse |
| (5) Rapid growth, plateau | 5% increase per y | No change |
2.5. Analysis of simulation results
The simulation model developed for this study is capable of analyzing virtually any scenario. However, the 5 scenarios selected cover a wide range of possible developments in the growth of the voucher program. The model's output for these scenarios provides a valid glimpse into the future voucher volumes that could be expected under each scenario. For each scenario, the 50‐year simulation run was repeated 1000 times using different random seed numbers for the same starting conditions, resulting in a sample size of 1000 values for each of the output variables. Frequency distributions of these output variables were summarized. The primary measure of model risk is the “coverage ratio,” or the number of available donors per voucher redeemed in a given year. Coverage ratios exceeding 1.0 indicate that the number of available donors will exceed the number of vouchers redeemed in any given year. For each scenario, we have chosen to report the coverage ratio value for which only 100 of the 1000 simulation runs (10th percentile) resulted in a lower coverage ratio. The 10th percentile was purposely selected to represent an ultraconservative projection for each scenario.
3. RESULTS
3.1. Scenario 1: rapid growth
Under this scenario, voucher donors increased at an average rate of 5% per year over the 50 years. Thus, both the NKR liability to meet potential voucher redemptions and the available donor supply are assumed to increase rapidly. Figure 2A illustrates that even at the 10th percentile, the simulation results indicate that the available donors far exceed the expected voucher redemptions throughout the 50‐year time horizon. For example, in year 25, the 10th percentile coverage ratio is 6.25, meaning that 90% of the simulation runs showed that the number of available donors was more than 6.25 times the number of voucher redemptions. Alternatively, Figure 2B demonstrates the output illustrating the 10th percentile number of voucher donors and the number of redemptions. The gap between the bars reflects the difference between available donors and redemptions. For example, in year 25 we would expect 200 donors available to cover 32 voucher redemptions. Additional data confirming available need for this scenario are of the 50 000 simulation runs (50 years × 1000 runs) no permeation resulted in a coverage ratio <1.0. In fact, the lowest observed coverage ratio was 3.9. Again, any value exceeding 1.0 demonstrates that voucher redemption can be covered by the available donors.
FIGURE 2.
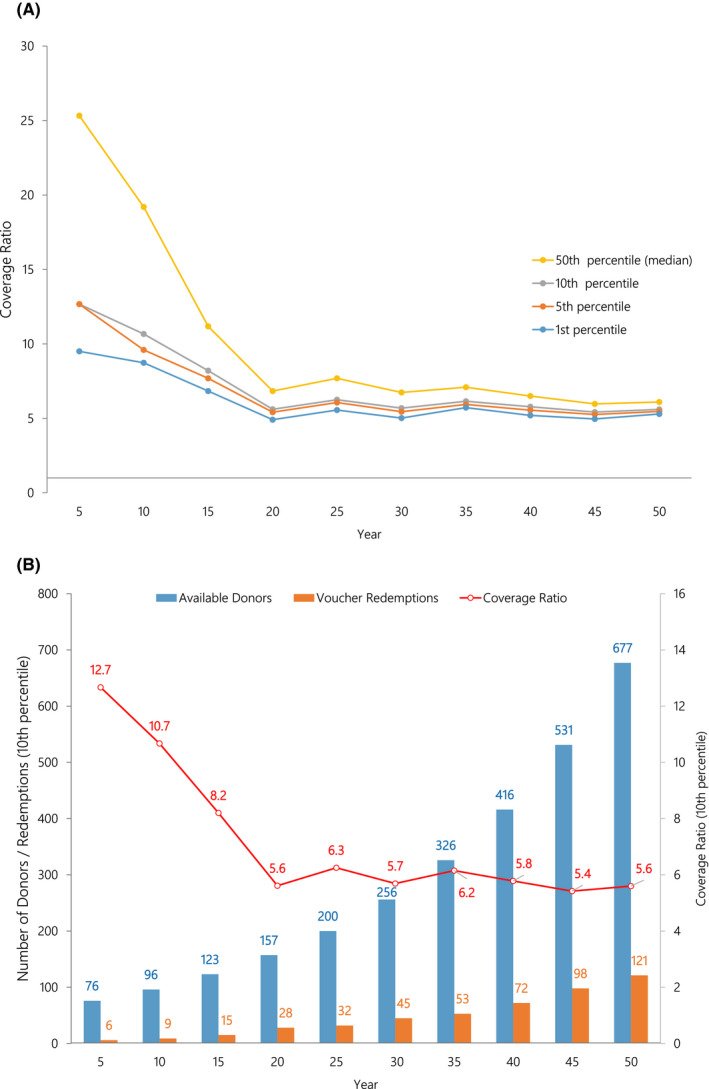
A, In the rapid growth scenario, coverage ratios at the first, fifth, 10th, and 50th percentiles are illustrated (1000 simulations). The coverage ratio is the number of available donors per voucher redemption. A coverage ratio of 2.0 indicates there are twice as many donor kidneys available as there are voucher redemptions in that year. B, In the rapid growth scenario, total available donors, voucher redemptions, along with the coverage ratio at the 10th percentiles are illustrated (1000 simulations)
3.2. Scenario 2: slow growth
In this scenario, the rate of growth in voucher donors increased between 2 and 5 per year, a much lower rate than scenario 1. In this case, the voucher liability increases slowly but so does donor availability. Figure 3A illustrates the 10th percentile coverage ratios by year. As in scenario 1, there is virtually no risk of insufficient donors to meet the required voucher redemptions. Year 40 exhibits the lowest coverage ratio at 3.71. Figure 3B illustrates the 10th percentile gap between available donors and voucher redemptions. For example, in year 40, the number of available voucher donors is 189 and only 51 vouchers are expected to be redeemed that year. Finally, as in scenario 1, following the 50 000 simulation runs, all results indicated a coverage ratio >1.0. The lowest coverage ratio of the 50 000 runs was 2.82.
FIGURE 3.
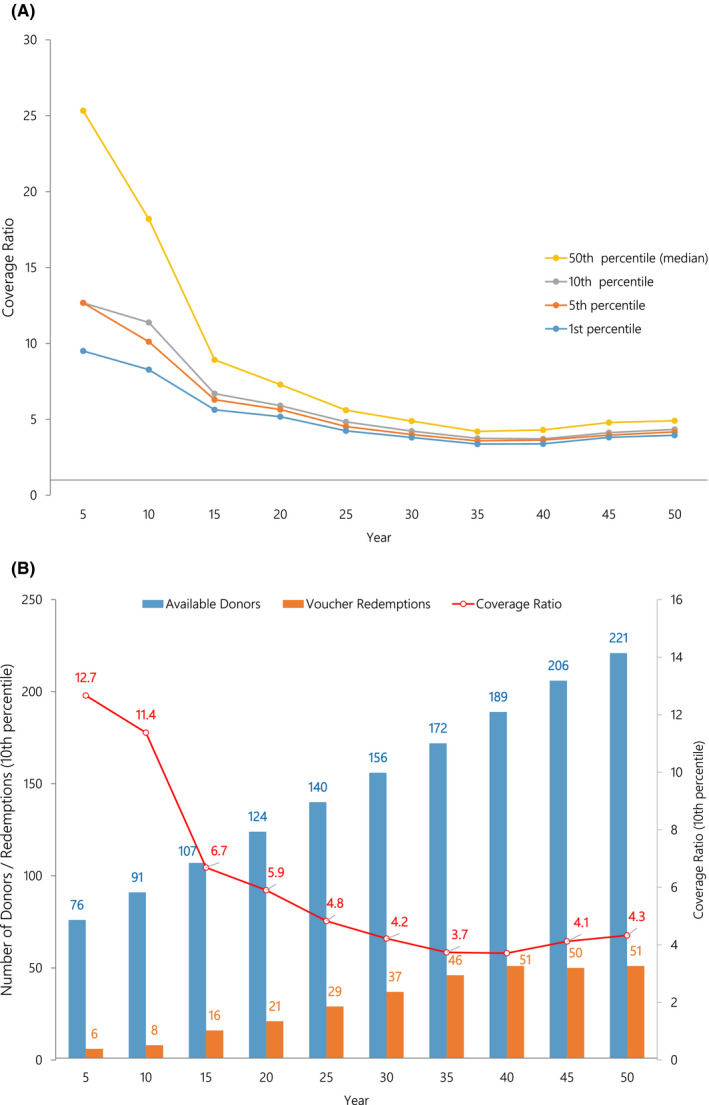
A, In the slow growth scenario, coverage ratios at the first, fifth, 10th, and 50th percentiles are illustrated (1000 simulations). The coverage ratio is the number of available donors per voucher redemption. A coverage ratio of 2.0 indicates there are twice as many donor kidneys available as there are voucher redemptions in that year. B, In the slow growth scenario, total available donors and voucher redemptions along with the coverage ratio at the 10th percentiles are illustrated (1000 simulations)
3.3. Scenario 3 rapid growth, rapid decline
This scenario is considered a worst case since it has voucher liability growing rapidly during the first 25 years followed by rapid decline the next 25 years. This builds significant potential liability early followed by reduced donor availability later when the chances of voucher redemption would be predicted to increase. Figure 4A illustrates the 10th percentile coverage ratios over time. At the 10th percentile, the coverage ratio exceeds 5.0 during the first 25 years and then declines through the remaining 25 years but, even in year 50, the coverage ratio is 1.4, higher than the 1.0 requirement to meet all voucher redemptions. Figure 4B demonstrates that at the 10th percentile, in year 50 the number of voucher donors exceeds the voucher redemptions by a margin of 66 donors to 47 redemptions. Of the 50 000 iterations, 49 995 (99.99%) of the coverage ratios exceeded 1.0. Only 5 times did the ratio drop below the 1.0 threshold. The lowest coverage ratio was 0.94. Thus, unlike scenarios 1 and 2, under this “worst case” scenario, there is an extremely small chance that the number of voucher redemptions would outnumber the available voucher donors.
FIGURE 4.
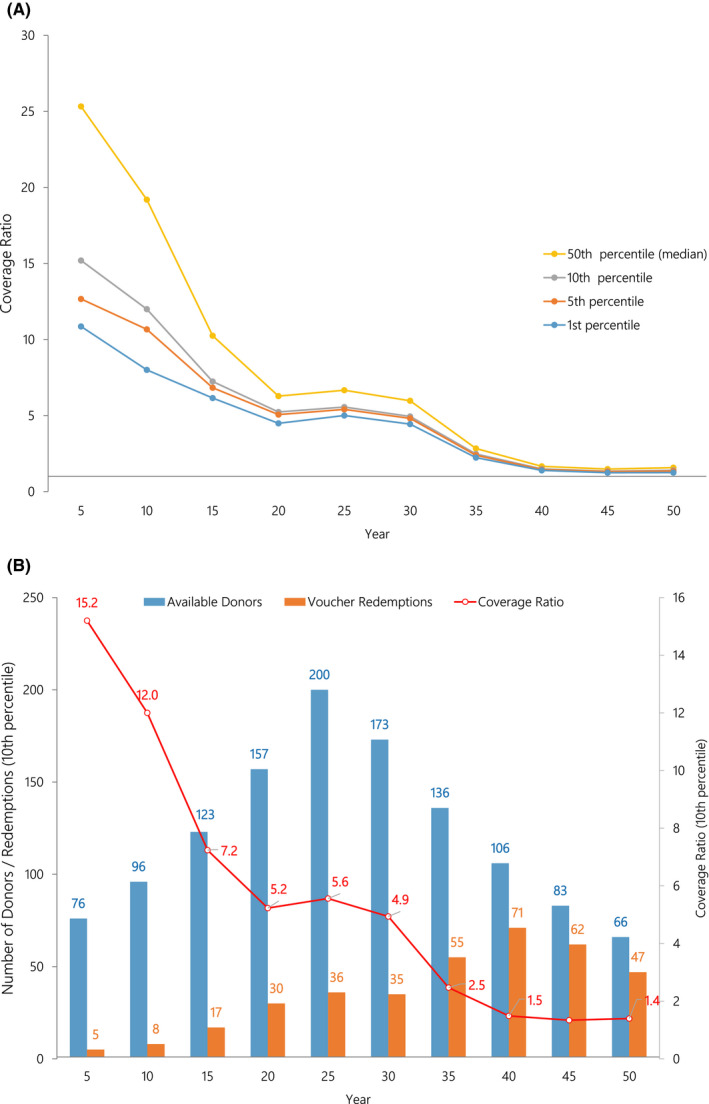
A, In the rapid growth followed by rapid decline scenario, coverage ratios at the first, fifth, 10th, and 50th percentiles are illustrated (1000 simulations). The coverage ratio is the number of available donors per voucher redemption. A coverage ratio of 2.0 indicates there are twice as many donor kidneys available as there are voucher redemptions in that year. B, In the rapid growth followed by rapid decline scenario, total available donors and voucher redemptions along with the coverage ratio at the 10th percentiles are illustrated (1000 simulations)
3.4. Scenario 4: slow growth/slow decline
For this scenario, the number of voucher donors grows at a relatively slow rate of 2‐5 over the previous year for the first 25 years and then declines annually by 2‐5 donors. The 10th percentile simulation results illustrated in Figure 5A indicate that through year 50, the coverage ratio exceeds 1.0 each year. Figure 5B illustrates that the difference between available voucher donors and voucher redemptions does not drop below 21. Furthermore, none of the 50 000 simulation runs yielded a coverage ratio <1.0 with the lowest observed value of 1.17. Thus, the late donor shortage risk associated with this scenario, while higher than for scenarios 1 and 2, is still very low.
FIGURE 5.
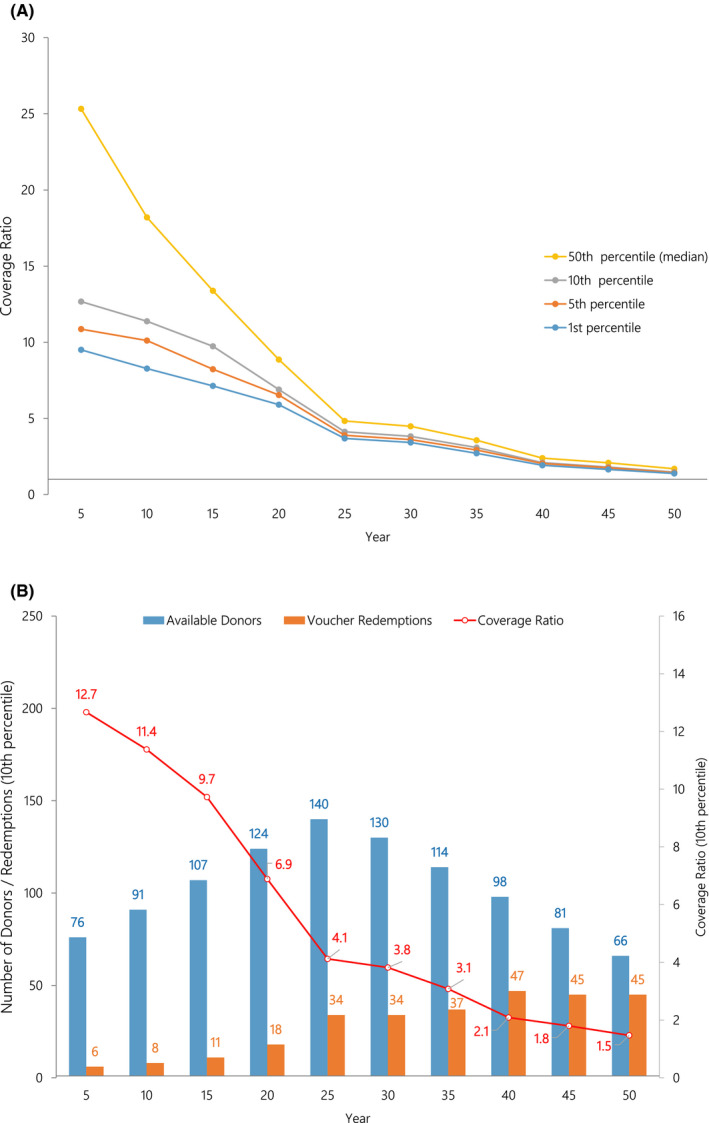
A, In the slow growth followed by slow decline scenario, coverage ratios at the first, fifth, 10th, and 50th percentiles are illustrated (1000 simulations). The coverage ratio is the number of available donors per voucher redemption. A coverage ratio of 2.0 indicates there are twice as many donor kidneys available as there are voucher redemptions in that year. B, In the slow growth followed by slow decline scenario, total available donors and voucher redemptions along with the coverage ratio at the 10th percentiles are illustrated (1000 simulations)
3.5. Scenario 5: rapid growth then plateau
For the final scenario considered in this analysis, the number of voucher donors grows at an average of 5% per year for the first 25 years and then remains flat for years 26 through 50. The coverage ratios over the 50 years shown in Figure 6A indicate that this scenario is low risk with the 10th percentile coverage ratio holding near 3.0 through years 45‐50. Following 50 000 simulations, 100% of the coverage ratios exceeded 2.0, indicating that in any year the number of voucher donors was at least double the number of projected redemptions. Figure 6B illustrates that at the 10th percentile level, the number of donors in year 50 (210) exceeds the number of redemptions (73).
FIGURE 6.
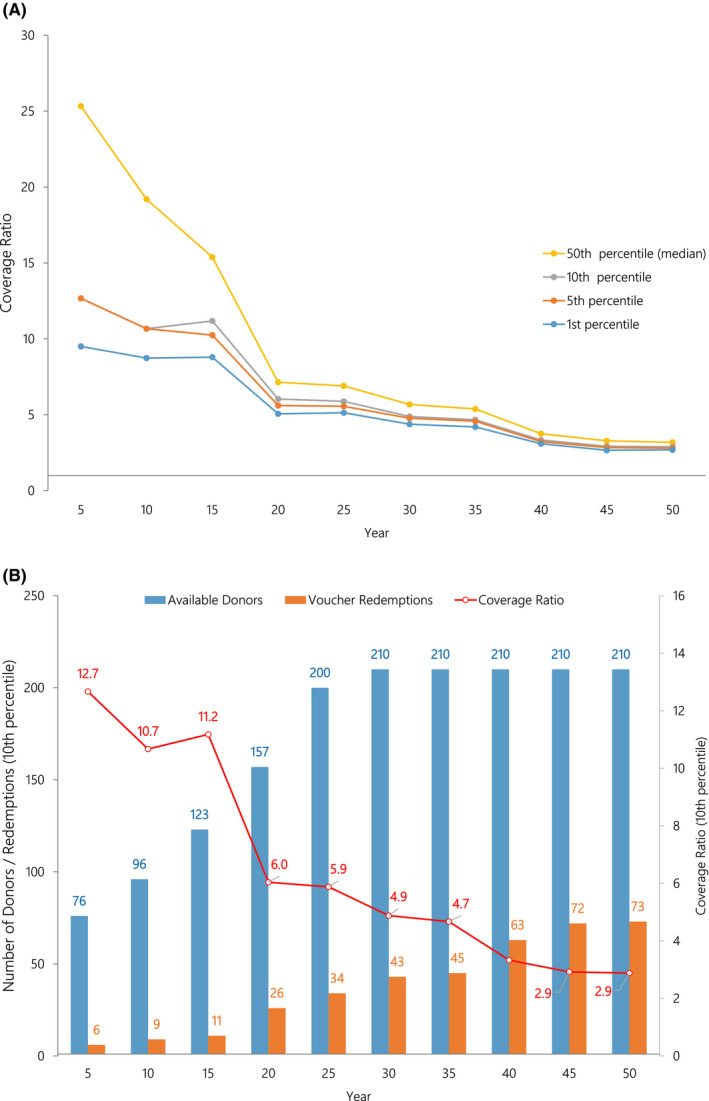
A, In the rapid growth then plateau scenario, coverage ratios at the first, fifth, 10th, and 50th percentiles are illustrated (1000 simulations). The coverage ratio is the number of available donors per voucher redemption. A coverage ratio of 2.0 indicates there are twice as many donor kidneys available as there are voucher redemptions in that year. B, In the rapid growth then plateau scenario, total available donors and voucher redemptions along with the coverage ratio at the 10th percentiles are illustrated (1000 simulations)
4. DISCUSSION
The ongoing kidney donor shortage continues to fuel creative strategies to increase LDKT rates and seek additional protections for living donors. KPD arose as a successful innovation to address incompatibility. Vouchers now address “chronological incompatibility” when the donor wishes to donate years prior to their intended recipient's transplantation. Initially, vouchers were given to individuals with kidney dysfunction in imminent need of transplant, but currently the program includes voucher holders without kidney dysfunction. While the program is promising, the concern regarding insufficient allografts to accommodate these vouchers must be addressed. This simulation study has demonstrated that the expanded voucher program should satisfy the likely redemption of vouchers under a range of possible scenarios over a 50‐year time horizon. In addition, these improvements to the voucher program will provide needed protections for potentially more KPD donors.
Ensuring confidence among the transplant community and the general public that kidney donors will be available in the future to meet all requests for voucher redemption is essential. Similar to a bank's capital requirements when a customer wishes to make a withdrawal, the NKR’s Advanced Donation Program must have sufficient donors to cover future voucher redemptions. This potential risk is evaluated in this simulation study. To appropriately evaluate the true risk, the constructed simulation model and analyses were designed to provide conservative assessments. The different scenarios cover a range of potential implementation plans that NKR could experience in the future. Regardless of the scenario constructed, simulation results illustrate that the risk of donor kidney nonavailability is negligible. The analysis demonstrates, in addition to attracting additional donors, that the program's donor availability should be sufficient to alleviate any concern that transplants to voucher holders will not be available in the future.
Potential limitations to the model and conclusions above exist. In presenting this simulation, it is a model and not a certainty to predict future events, as many events are unable to be foreseen (ie, coronavirus disease 2019). Therefore, care and sensitivity are mandatory when presenting such models to patients for clinical decision‐making such as kidney donation. Graft failure probabilities were estimated using SRTR transplants between 1987 and 2013; however, graft failure rates have improved substantially over this time period. This means that actual coverage ratios will likely be better than those estimated here. The weighted average (3.26%) used for the probability of kidney failure was based on a mix of voucher holders that include few healthy individuals. As the proportion of voucher holders with no known kidney disease increases, the actual probability of kidney failure for the pool of voucher holders will go down, resulting in further improvements to the coverage ratio. Although unlikely, death rates and rates of ESRD may significantly change in the future, which could affect coverage ratios. The model also presupposes the avoidance of extremes in either the donor pool or ESRD rate such as a dramatic reduction in individuals willing to donate (eg, after a series of high‐profile donor deaths) or a dramatic increase in unpredicted voucher redemptions (eg, due to a pandemic virus that causes acute kidney failure in many voucher holders). In the >2300 transplants, matching O and highly sensitized recipients has not been a limiting factor. 12 Actual coverage will be closely tracked by the NKR and if a large mismatch in voucher donor/voucher holder blood types arises (eg, imbalance of >10 O or B blood types), restrictions will be placed on new enrollees to the voucher program (eg, restricting entry of mismatched voucher donor‐voucher holder blood types or degree of sensitization) to maintain the ability to fulfill voucher redemptions. After 14 months of advanced donation, there are currently 667 NKR voucher holders. Of these, 84 are standard vouchers and 583 are family vouchers. Until recently, the NKR only tracked ABO blood type and calculated panel reactive antibodies for standard voucher holders (ie, single named individual with kidney disease) but has recently begun to collect ABO data on family voucher holders, though there are not sufficient data to report on at this time. While voucher holder sensitization may play a role in their ability to receive an eventual transplant, there is no way to establish currently what future sensitization levels will be (eg, transfusions, pregnancies).
One conflict of interest potentially limits our findings. The authors of this article represent NKR‐participating centers and the NKR Medical Board. The success and implementation of the voucher program in different scenarios depend on the continued functioning of the NKR and the use of its matching software to plan prioritization for patients redeeming vouchers. In the unlikely event that administrative, regulatory, or business changes require NKR to cease operation, risks that cannot be fully modeled, the following terms and conditions have been adopted:
Advanced Donation Program Obligations: All NKR Member Centers and Partner Centers agree to work with each other in good faith under the leadership of the NKR Surgical Director, should the NKR ever become insolvent and/or cease operations, to provide kidneys for Advanced Donation Program recipients. This obligation is irrevocable, exists in perpetuity, and survives the termination of this contract.
This and other risks are listed in the consent form (http://www.kidneyregistry.org/docs/ADP_Consents.pdf).
This analysis demonstrates that the expansion of the NKR’s Advanced Donation Program to include as many as 5 vouchers for immediate healthy family members can be easily accommodated by the current program, recalling that only 1 voucher redemption is permitted for each family group. Fifty‐year simulations using actual ESRD probabilities assigned to each of the 4 categories of potential voucher holders (living donors, transplant recipients, CKD stage 3‐5 patients, and immediate family enrollees) establish that there is little to no risk that the availability of kidneys will be insufficient to satisfy demand for voucher redemptions regardless of probable future scenarios. While not able to account for all real‐life scenarios, this simulation study found that the NKR should be able to satisfy the likely redemption of increasing numbers of vouchers under a range of possible scenarios over a 50‐year time horizon.
DISCLOSURE
The authors of this manuscript have conflicts of interest to disclose as described by the American Journal of Transplantation. GH and MR are employees of the National Kidney Registry, Babylon, NY (GH‐Founder and CEO, MR‐Director of Research and Technology). MC, DBL, SMF, ADW, and JLV serve as unpaid members of the Medical Board for the National Kidney Registry with MC as the Surgical Director and ADW as the Research Director. The other authors of this manuscript have no conflict of interest to disclose.
Cooper M, Leeser DB, Flechner SM, et al. Ensuring the need is met: A 50‐year simulation study of the National Kidney Registry’s family voucher program. Am J Transplant.2021;21:1128–1137. 10.1111/ajt.16101
DATA AVAILABILITY STATEMENT
The data that support the findings of this study are available from the corresponding author upon reasonable request.
REFERENCES
- 1. Flechner SM, Thomas AG, Ronin M, et al. The first 9 years of kidney paired donation through the National Kidney Registry: characteristics of donors and recipients compared with National Live Donor Transplant Registries. Am J Transplant. 2018;18(11):2730‐2738. [DOI] [PMC free article] [PubMed] [Google Scholar]
- 2. Butt FK, Gritsch HA, Schulam P, et al. Asynchronous, out‐of‐sequence, transcontinental chain kidney transplantation: a novel concept. Am J Transplant. 2009;9(9):2180‐2185. [DOI] [PubMed] [Google Scholar]
- 3. Veale JL, Capron AM, Nassiri N, et al. Vouchers for future kidney transplants to overcome "chronological incompatibility" between living donors and recipients. Transplantation. 2017;101(9):2115‐2119. [DOI] [PubMed] [Google Scholar]
- 4. Flechner SM, Leeser D, Pelletier R, et al. The incorporation of an advanced donation program into kidney paired exchange: initial experience of the national kidney registry. Am J Transplant. 2015;15(10):2712‐2717. [DOI] [PubMed] [Google Scholar]
- 5. Kroese DP, Brereton T, Taimre T, Botev ZI. Why the Monte Carlo method is so important today. Wires Comput Stat. 2014;6(6):386‐392. [Google Scholar]
- 6. Parikh ND, Hutton D, Marrero W, Sanghani K, Xu Y, Lavieri M. Projections in donor organs available for liver transplantation in the United States: 2014–2025. Liver Transpl. 2015;21(6):855‐863. [DOI] [PubMed] [Google Scholar]
- 7. Gentry SE, Chow EKH, Massie A, et al. Liver sharing and organ procurement organization performance under redistricted allocation. Liver Transpl. 2015;21(8):1031‐1039. [DOI] [PMC free article] [PubMed] [Google Scholar]
- 8. Riou J, Boelle PY, Christie JD, Thabut G. High emergency organ allocation rule in lung transplantation: a simulation study. ERJ Open Res. 2017;3(4):00020‐2017. [DOI] [PMC free article] [PubMed] [Google Scholar]
- 9. Hasankhani F, Khademi A. Efficient and fair heart allocation policies for transplantation. MDM Policy Pract. 2017;2(1):2381468317709475. [DOI] [PMC free article] [PubMed] [Google Scholar]
- 10. Hallan SI, Coresh J, Astor BC, et al. International comparison of the relationship of chronic kidney disease prevalence and ESRD risk. J Am Soc Nephrol. 2006;17(8):2275‐2284. [DOI] [PubMed] [Google Scholar]
- 11. Landray MJ, Emberson JR, Blackwell L, et al. Prediction of ESRD and death among people with CKD: the Chronic Renal Impairment in Birmingham (CRIB) prospective cohort study. Am J Kidney Dis. 2010;56(6):1082‐1094. [DOI] [PMC free article] [PubMed] [Google Scholar]
- 12. Leeser DB, Thomas AG, Shaffer AA, et al. Kidney paired donation transplant outcomes: experiences from the first ten years of the National Kidney Registry. 2019 Am Trans Congress. Am J Transplant. 2019;19(Suppl 3). [Google Scholar]
Associated Data
This section collects any data citations, data availability statements, or supplementary materials included in this article.
Data Availability Statement
The data that support the findings of this study are available from the corresponding author upon reasonable request.


