Abstract
The antimicrobial activity of citric acid (CA) is often evaluated without pH adjustment or control and its impact on micro‐organisms is better understood in acidic conditions. However, the biocidal action of the fully ionized CA molecule, predominantly available at higher pH, has not been previously investigated. The objective of this study was to evaluate the antimicrobial effect of high (10%) and low (1%) concentrations of CA, each adjusted over a wide range of pH values (4·5, 6·5 and 9·5) relative to the controls exposed to corresponding pH levels alone (no CA). The viability and morphology of Escherichia coli and Klebsiella aerogenes were evaluated using a culture‐based enumeration assay in parallel with direct SEM imaging. Overall, the highest membrane damage and loss in viability were achieved with 10% CA at pH 9·5, which yielded at least 4·6 log10 CFU per ml (P < 0·001) reductions in both organisms. Insight into the superior efficacy of CA at high pH is proposed based on zeta potential measurements which reveal a more negatively charged bacterial surface at higher pH. This pH‐dependent increase in surface charge may have rendered the cells potentially more sensitive towards chelants such as CA3− that interact with membrane‐stabilizing divalent metals.
Keywords: antimicrobials, citric acid, E. coli, K. aerogenes, pH
Significance and Impact of the Study: Citric acid (CA) is an antimicrobial molecule with three ionization states that exist in an equilibrium directly governed by pH. Traditionally, non‐ionized CA was considered more antimicrobial, presumably due to the combined effects of the molecule and the acidic environment in which it occurs. By decoupling the antimicrobial impact of pH and CA on Gram‐negative bacteria, it is demonstrated, for the first time, that the fully ionized CA species alone was the most effective at destroying the bacteria. The results from SEM imaging and surface‐charge measurements provide further insight into the antimicrobial mode of action of CA against bacteria.

Introduction
Citric (2‐hydroxypropane‐1,2,3‐tricarboxylic, C6H8O7) or CA is a weak acid with three carboxylic functional groups that have three different dissociation (pKa) values of 3·1, 4·7 and 6·4. As a triprotic acid, CA can sequentially lose up to three protons while forming equilibriums of three distinct negatively charged species with increasing pH: (Mudunkotuwa and Grassian 2010; Fig. 1). So far, the highest antimicrobial activity of CA has been demonstrated at low pH, mainly between the first and second pKa values (Young and Foegeding 1993; Buchanan and Golden 1994; Kundukad et al. 2020). Knowledge of the mechanism of CA’s antimicrobial action remains limited but it is believed that at low pH, CA in its un‐charged, un‐dissociated state (CAH3) is able to freely cross the microbial membrane. Once inside the cytoplasm, it dissociates into CA anions and protons leading to the acidification of the intracellular media (Mani‐Lopez et al. 2012) while causing functional and structural damage to the cell (Abu‐Ghazaleh 2013). The reports of CA activity under mildly acidic to higher pH environments provide conflicting results. For example, partially charged CA species predominant under neutral to high pH environments are believed to be taken up as a carbon source (Van der Rest et al. 1992) and therefore confer a protective effect. On the other hand, the negatively charged CA species are believed to inactivate bacteria by either destabilizing the outer membrane or by sequestering essential metals from the growth environment (Beuchat and Golden 1989; Buchanan and Golden 1994). The impact of a high pH environment on the antimicrobial activity of CA, where the fully ionized species (CA3−) predominates, remains altogether unexplored.
Figure 1.
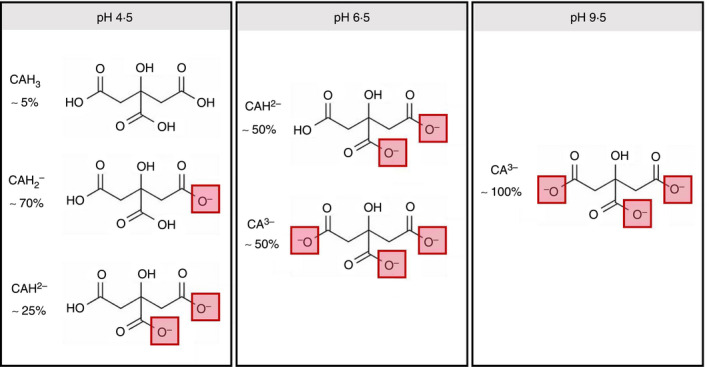
Ionization states of CA as a function of pH adapted fromMudunkotuwa and Grassian (2010).
The objective of this study was to investigate the antimicrobial activity of different levels of CA against two standard Gram‐negative bacterial species across a wide range of pH. Klebsiella aerogenes, an emerging nosocomial pathogen (Davin‐Regli and Pagès, 2015), formerly known as Enterobacter aerogenes, as well as Escherichia coli, an important foodborne pathogen, were chosen for this study due to their remarkable ability to grow and survive over a wide range of pH values (Atlas and Bartha 1998) and also because of their utility as test strains for a variety of standardized antimicrobial and preservative efficacy tests (EPA 2012).
Results and discussion
Three pH values were selected (4·5, 6·5 and 9·5) across a wide pH range to study the effect of pH on the antimicrobial efficacy of CA. As shown in the speciation diagram adopted from Mudunkotuwa and Grassian (2010) in Fig. 1, about 5% of CA (CAH3) coexists with 70% of citrate monobasic (CAH2 −) and 25% of citrate dibasic (CAH2−) at pH 4·5. At pH 6·5, about 50% of citrate dibasic coexists with 50% of citrate tribasic (CA3−). At pH 9·5, all of the CA species are expected to be in the tribasic form. Antimicrobial activities of 1% and 10% of CA against 8 log10CFU per ml (108 CFU per ml) of bacteria was studied at pH 4·5, 6·5 and 9·5 after a 5‐h exposure period by comparing the viable colony forming units (CFUs) recovered from the CA‐treated samples with those recovered from untreated, pH‐adjusted control groups. An overnight bacterial culture (the growth control) of each organism without pH adjustment was also evaluated in parallel. The pH of all samples was monitored and maintained at a constant level throughout the experimental time period. The pH of each sample before incubation is shown in Figs S1 and S2 of the Supplementary Information section and the pH of each sample measured after 5‐h incubation (pHm) is reported in Fig. 2. The results expressed in log10CFU per ml are presented in Fig. 2.
Figure 2.
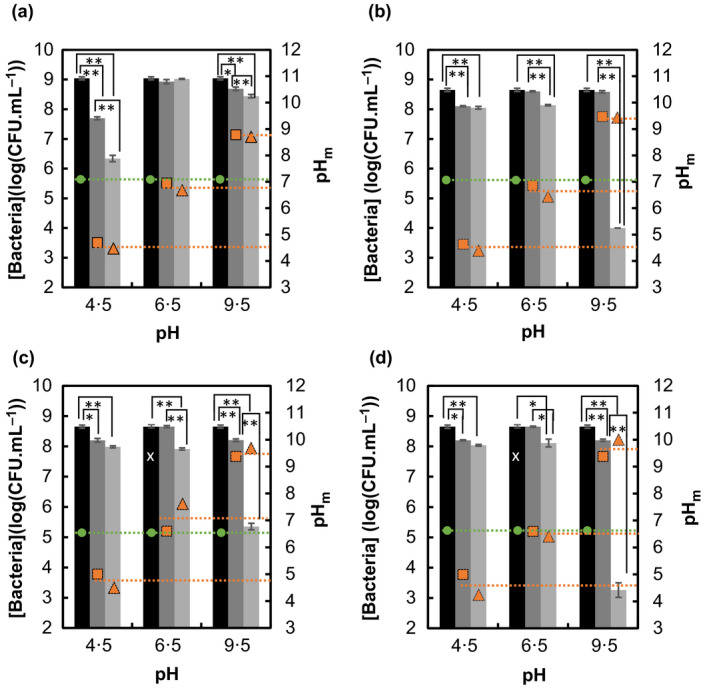
(a, b) Effect of pH on Klebsiella aerogenes and antibacterial efficacy of (a) 1% and (b) 10% CA as a function of pH. (c, d) Effect of pH on Escherichia coli and antibacterial efficacy of (c) 1% and (d) 10% CA as a function of pH. *Statistically different when P < 0·01, **statistically different when P < 0·001. x: Same as pH 6·5 control.  [Bacteria] in growth control,
  [Bacteria] in pH control,
  [Bacteria] in 1 or 10% CA,
  pHm of growth control,
  pHm of control,
  pHm of sample.
Overall, the antimicrobial activity of CA demonstrated a similar trend between the two test organisms in that the highest efficacy was observed at pH 9·5, where all CA is under its tribasic form CA3−. In both organisms, the samples supplemented with 10% CA yielded the greatest values of reduction of viable CFUs with 5·4 log10CFU per ml (P < 0·001) for E. coli and 4·6 log10CFU per ml (P < 0·001) for K. aerogenes. Escherichia coli displayed more sensitivity towards CA at high pH compared to K. aerogenes and yielded the next highest log reduction (3·3 log10CFU per ml with P < 0·001) when treated with 1% CA at pH 9·5. Conversely, limited or no impact on viability was observed in CA‐treated samples at the near neutral pH of 6·5 for each bacterial species tested. Log reductions of 0·2 log10CFU per ml (P > 0·01) and 0·5 log10CFU per ml (P < 0·001) were obtained with 1 and 10% CA, respectively, for K. aerogenes. Log reductions of 0·7 log10CFU per ml (P < 0·001) and 0·5 log10CFU per ml (P < 0·01) were obtained with 1 and 10% CA, respectively, for E. coli. The lower antimicrobial efficacy observed at pH 6·5 as compared to pH 9·5 could be explained by the protective vs toxic effects of di‐ and tri‐basic forms, respectively, as previously described (Buchanan and Golden 1994).
The effect of pH alone was most pronounced in K. aerogenes at pH 4·5 where the concentration of viable cells resulted in log reduction values ranging from 0·4 to 1·3 (P < 0·001) compared to the growth control and when supplemented with 1% CA, yielded 2·7 log10CFU epr ml (P < 0·001) compared to the corresponding pH control group. However, increasing the CA dose to 10% completely eliminated the antimicrobial activity observed in K. aerogenes treated with 1% CA at pH 4·5, presumably due to a proportional increase in the protective monobasic and dibasic species of the molecule (Buchanan and Golden 1994). On the other hand, E. coli, being a gastrointestinal pathogen, was resistant to both 1 and 10% CA treatment at pH 4·5 leading to 0·7 log10CFU per ml (P < 0·001) and 0·6 log10CFU per ml (P < 0·001), respectively, as compared to the pH control (Fig. 2c,d). This limited antibacterial property of CA in low pH environments is concerning since commercial CA‐based preservatives are commonly formulated at pH values below 4 (Xiong et al. 1999; Horn and Bhunia 2018) and according to Buchanan and Golden (1994), at least several days were required to achieve a 4 log reduction of Gram‐negative bacteria in an acidified medium. The present discovery suggests that flipping the growth environment from acidic to basic can yield a similar level of reduction but in a much shorter time (5 h).
Since the improved efficacy of CA at high pH was surprising, the cell morphology in all sample groups were further examined via scanning electron microscopy (SEM) imaging by adapting a method described by Zhou et al. (2016). The SEM images reveal no apparent structural damages in E. coli or K. aerogenes cells exposed to all three pH control samples. However, structural damage was obvious upon the addition of 1% CA in K. aerogenes at pH 9·5 (Fig. 3f) and also at 6·5 and 9·5 pH in E. coli (Fig. 4e,f) reflecting the antimicrobial activities measured in both bacteria (75·8 and 99·95% cell reduction for K. aerogenes and E. coli, respectively, Fig. 2a,c. Addition of 10% CA resulted in varying degrees of structural damage across different pH groups with even greater damages observed at pH 9·5. Interestingly, K. aerogenes cells treated with 1 CA% at pH 4·5 displayed no apparent cellular damage (Fig. 3d), even though it was significantly killed by the same treatment based on the culture assay (LR = 2·7 log10CFU per ml). Treatment of Gram‐negative bacteria with organic acids at low pH is known to trigger the formation of a viable, structurally intact but non‐culturable (VBNC) state (Purevdorj‐Gage et al. 2018). In our case, the treatment with 1% CA at pH 4·5 may have triggered the formation of VBNC cells that could have yielded the discrepancy between our direct imaging and culture‐based assessments. Moreover, repeated use of organic acids can cause the emergence of acid‐tolerant strains (Mani‐Lopez et al. 2012). These two phenotypes, overall, pose a special threat to public health due to their ability to evade detection (VBNC) and withstand the acidity of human stomach, which otherwise serves as one of the first‐line defence mechanisms against gastrointestinal pathogens. These remarks underline the need for devising a safer and more sustainable application of organic acids such as CA.
Figure 3.
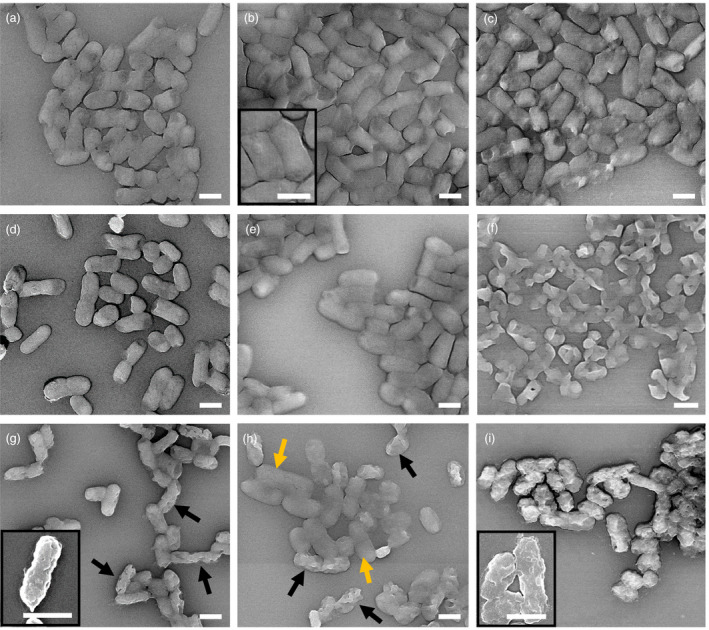
SEM‐LABE images of Klebsiella aerogenes with and without CA at the three different pH values. (a–c) controls: (a) pH 4·5, (b) pH 6·5 and (c) pH 9·5; (d–f) 1% CA: (d) pH 4·5, (e) pH 6·5 and (f) pH 9·5; (g–i) 10% CA: (g) pH 4·5, (h) pH 6·5 and (i) pH 9·5. Inserts are close up SEM‐SEI images. Scale bars are 1 μm. Black arrows show damaged cells. Yellow arrows show healthy cells.
Figure 4.
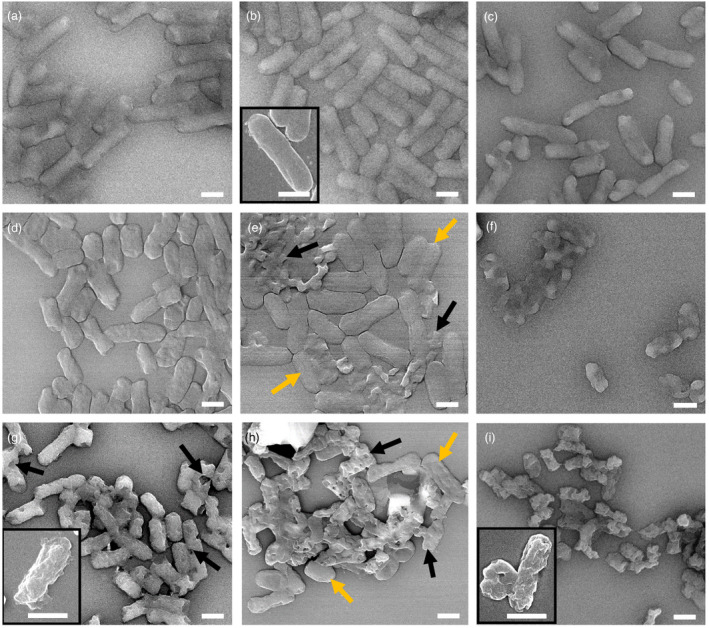
SEM‐LABE images of Escherichia coli with and without CA at the three different pH values. (a–c) controls: (a) pH 4·5, (b) pH 6·5 and (c) pH 9·5; (d–f) 1% CA: (d) pH 4·5, (e) pH 6·5 and (f) pH 9·5; (g–i) 10% CA: (g) pH 4·5, (h) pH 6·5 and (i) pH 9·5. Inserts are close up SEM‐SEI images. Scale bars are 1 μm. Black arrows show damaged cells. Yellow arrows show healthy cells.
Addition of 10% CA at pH 4·5 generated uniformly damaged cells displaying holes and shrivelled outer layers, as indicated by the black arrows (Figs 3 and 4g). Whereas, at pH 6·5, the CA‐treated cells displayed two distinct subpopulations consisting of structurally intact (yellow arrows) and damaged cells (black arrows) (Figs 3 and 4h). These two subpopulations potentially could have resulted from competing actions of protective (di‐basic) and toxic (tri‐basic) forms of CA and/or inherent heterogeneity of a bacterial population and presence of persistor cells (Lewis 2010).
Overall, the SEM observations are consistent with our culture‐based viability assays and confirm that the tribasic CA (CA3−) causes a greater disruption of Gram‐negative membrane. This observation corroborates with the work of Ayres et al. (1998) who observed an increase in the membrane permeability of Pseudomonas aeruginosa in the presence of sodium citrate at pH 9·0. This phenomenon can be linked to the role of divalent cations in the bacterial membrane. In Gram‐negative bacteria, the lipopolysaccharide (LPS) layer is overall negatively charged (Clifton et al. 2015). Divalent cations such as Ca2+ or Mg2+ form not only the salt bridges that strengthen the membrane integrity but also act to minimize the electrostatic repulsion between the negatively charged groups of the membrane (Clifton et al. 2015). Negatively charged chelating agents such as the well‐known ethylenediamine tetraacetic acid or EDTA and tribasic form of CA can chelate away a large number of divalent cations (Russel 1971; Ayres 1998). Upon removal of the divalent cations from LPS, the electrostatic repulsion between the neighbouring negatively charged groups increases, resulting in membrane destabilization and LPS release into solution (Alakomi 2000; Clifton et al. 2015). It is plausible that in our study, more effective capturing of essential metal ions was possible at pH 9·5 with CA3− due to the fact that the number of tri‐carboxylate groups available in this condition was the highest compared to those that are available at pH 6·5 (Young and Foegeding 1993). Therefore, this may explain why the antimicrobial activity is mostly observed at pH 9·5 with a higher CA3− dose.
Moreover, it is possible that pH‐dependent variations in the overall bacterial surface charge may have led to differing antimicrobial activities of CA across different pH values. To address this question, we measured the surface charge of K. aerogenes and of E. coli as a function of pH. The results presented in Fig. 5 show that the bacterial surface charge is, indeed, pH‐dependent and that the zeta potential values for each bacterium became significantly more negative with increasing pH. In general, as the cell surface becomes more negatively charged, bacterial dependency on the divalent metals is expected to increase to minimize the electrostatic repulsion between the more numerous negatively charged groups of the membrane. Upon capture of these divalent cations by the addition of CA at high pH, the bacterial membrane may lose structural integrity and become more sensitive towards the action of CA. Thus, it is plausible that the increased antimicrobial activity of CA towards Gram‐negative bacteria at high pH is driven not only by the increased chelation of divalent ions, as previously thought, but also by the increase in the negatively charged groups of the bacterial membrane that may have rendered the cells less stable. Across the entire pH range, the surface charge of E. coli was more negative compared to that of K. aerogenes, potentially explaining the greater reduction of E. coli observed with both 1% and 10% CA at pH 9·5 as compared to K. aerogenes. Moreover, the charge of E. coli at pH 6·5 (ζ = −12·7 mV) being similar to the charge of K. aerogenes at pH 9·5 (ζ = −13·3 mV) but lower than the charge of K. aerogenes at pH 6·5 (ζ = −10·2 mV) could explain why membrane damage is observed in E. coli but not in K. aerogenes in response to 1% CA at pH 6·5. From this last observation, it is possible that strong membrane disruption via CA or any other chelant may require a certain charge threshold (i.e. ζ ≤ −13 mV), therefore explaining the dependence of antimicrobial activity of CA on pH. Furthermore, the higher sensitivity of E. coli to CA3− compared to K. aerogenes could also, in part, come from the fact that K. aerogenes is expected to have a significantly thicker capsule (Springer and Roth 1973; Amako et al. 1988) which may retard the activity of CA3−.
Figure 5.
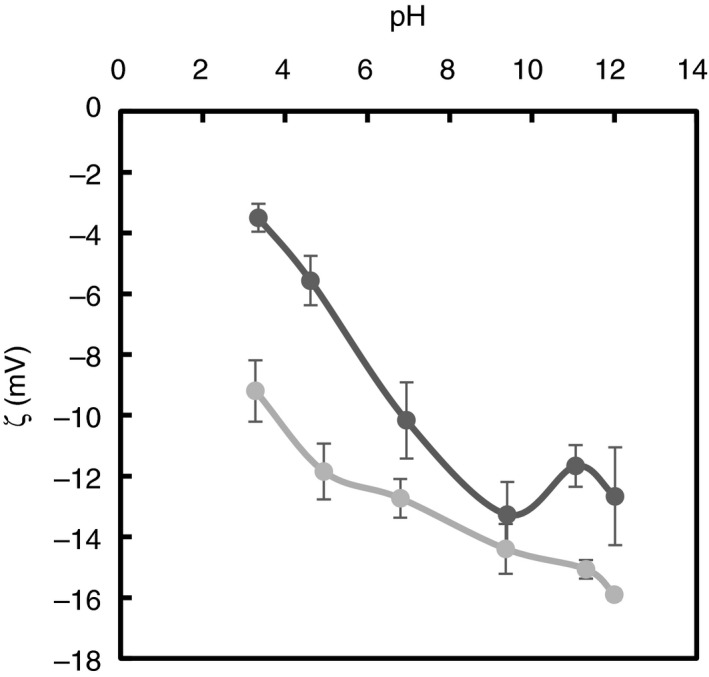
Surface charge of  Klebsiella aerogenes and
  Escherichia colias a function of pH.
Additionally, given the differences between the Gram‐positive and Gram‐negative cell walls and apparent lack of an LPS layer in Staphylococcus aureus, a similar test was conducted with this bacterium. Staphylococcus aureus was challenged with 10% CA at pH 4·5, 6·5 and 9·5 for 5 h. The results at pH 9·5 showed a significantly lower LR (1·3 log10CFU per ml with P < 0·01, see Fig. S3 of the Supplementary Information section for more details) with this bacterium as compared to the reductions observed in both K. aerogenes and E. coli (this study). Thus, chelation of multivalent ions present in the membrane via CA3− remains a plausible explanation for the enhanced observed antimicrobial behaviour with Gram‐negative bacteria.
In summary, the current research determined that the antimicrobial effect of CA is dependent on the pH and concentration of different ionized species of the molecule. The findings from this work underline the enhanced antimicrobial activity of tribasic CA and its ability to deactivate a high concentration of Gram‐negative bacteria more efficiently than the other species of the molecule, yielding up to 4·6–5·3 log10CFU per ml reductions of K. aerogenes and E. coli in as little as 5 h. SEM imaging of both bacteria revealed superior membrane damage at pH 9·5. At this pH, CA exists entirely in its tribasic form (CA3−), which is likely to provide superior chelation of divalent ions, critical to the structural integrity of bacteria. Additionally, zeta potential measurements revealed that the bacterial surface charge was more negative at higher pH. This increase in surface charge may have enhanced the bacterial dependency on the membrane‐stabilizing divalent metals ions, therefore rendering the cells potentially more sensitive towards chelants such as CA3−. The higher sensitivity of E. coli to CA at near‐neutral and high pH values could be explained by the fact that its surface charge was more negative than the surface charge of K. aerogenes. Knowledge of the effect of pH on CA efficacy should permit a more systematic means for selecting organic acids to optimize the inhibition or inactivation of bacterial pathogens.
Materials and methods
Microbial strains
All bacterial strains were purchased from the American type culture collection (Manassas, VA, www.atcc.gov). Klebsiella aerogenes (ATCC 13048) and Escherichia coli (ATCC 10536) cultures were maintained in a 40% (v/v) glycerol solution at −80°C.
Bacteria cell culture and plate counting
A fresh culture of either K. aerogenes or E. coli was prepared by inoculating 35 ml Nutrient Broth (General Laboratory Products Inc, Yorkville, IL) with a single colony isolated on a tryptic soy agar (TSA) plate. The liquid culture was then incubated overnight at 30°C while shaking at 150 rev min−1. The concentration of the overnight bacterial culture was determined by optical density at 620 nm and also by serial dilution and plating on TSA plates. Colony forming units of bacteria per ml (CFU per ml) were counted after 24 h of incubation at 35°C.
Neutralization confirmation
Neutralization of CA antimicrobial activity upon dilution in phosphate buffer was confirmed and is presented in the Supplementary Information section in greater detail.
Citric acid study
The overnight culture was aliquoted into 5 ml individual samples containing 8 log10CFU per ml of bacteria. Three samples were supplemented with 1% CA (Sigma Aldrich) and the pH in each sample was adjusted to pH 4·5, 6·5 and 9·5 using either HCl or NaOH with samples plated in triplicates for each pH level. The pH control set was prepared by adjusting the pH to 4·5, 6·5 and 9·5 as described above but without the addition of CA. The controls and samples were then incubated at 30°C with shaking at 150 rev min−1 and were sampled at specified time intervals for microbial CFU enumeration. The impact of each pH level was evaluated with and without adding CA in parallel with the same bacterial culture which was not pH adjusted (growth control). The same experiment was repeated with 10% CA.
Statistical analysis and calculation of percent reduction
Each data point represents the mean ± standard deviation of three repeat tests. The software used for the data analysis was Microsoft® Excel. The Welch t test was used to compute the differences between the samples and the controls with significance assigned to P < 0·01. The percent log reduction was calculated using the following formula: PLR = (1 − 10− LR)*100 where LR is the log reduction.
Scanning electron microscopy imaging
The morphologies of K. aerogenes and E. coli in all sample groups were observed by SEM. For each sample, 2 ml of aliquots was centrifuged at 2000 g for 10 min and resulting pellets were re‐suspended in 1 ml of PBS. The samples were centrifuged again at 2000 g for 10 min and the pellets were re‐suspended in 1 ml of a 0·5% glutaraldehyde PBS solution and held for 30 min at room temperature. The samples were then centrifuged (2000 g, 10 min) and the pellets were re‐suspended in 0·5 ml of sterile MilliQ water. Aliquots of 200 µl of each sample solution were then drop casted onto previously methanol washed silicon wafers and air‐dried overnight. The following day, the specimens were fixed for 1 h with 200 µl of a 0·1% glutaraldehyde solution followed by an additional 1‐h fixation with 200 µl of a 0·5% glutaraldehyde solution. Finally, the specimens were dehydrated by adding ethanol in a graded series (70% for 6 min, 90% for 6 min and 100% for 6 min). The wafers were left to air dry and coated with platinum using a Cressington sputter coater before SEM imaging using a JEOL 7500 HRSEM.
Charge and pH measurements
For each bacteria, the overnight culture was washed twice by centrifugation at 2000 g for 10 min, the resulting pellets were re‐suspended in water containing 0·5% NaCl and pH of the final bacterial suspensions was adjusted with either HCl or NaOH. The concentration of salt used was the same as in the nutrient broth to stay consistent with the citric acid study. The zeta potential of bacteria as a function of pH was measured on a Zetasizer Nano Serie 200. Each data point represents the mean ± standard deviation of three repeats for each pH value. The pH of bacteria suspensions was measured using a VWR Scientific digital pH temperature meter (model 8015).
Conflict of Interest
No conflict of interest declared.
Supporting information
Figure S1. (a) pH measured in K. aerogenes controls (no CA) and samples (with CA) before incubation.
Figure S2. pH measured in E. coli controls (no CA) and samples (with CA) before incubation.
Figure S3. Effect of pH on S. aureus and antibacterial efficacy of 10% CA as a function of pH.
Acknowledgements
The authors thank Dr. Jaime Hutchison, Dr. Denis Bendejacq and Dr. Kamel Ramdani for fruitful discussions.
References
- Abu‐Ghazaleh, B. (2013) Effects of ascorbic acid, citric acid, lactic acid, NaCl, potassium sorbate and Thymus vulgaris extract on Staphylococcus aureus and Escherichia coli . Afr J Microbiol Res 7, 7–12. [Google Scholar]
- Alakomi, H.‐l. , Skyttä, E. , Saarela, M. , Mattila‐Sandholm, T. , Latva‐Kala, K. and Helander, I.M. (2000) Lactic acid permeabilizes Gram‐negative bacteria by disrupting the outer membrane. Appl Environ Microbiol 66, 2001–2005. [DOI] [PMC free article] [PubMed] [Google Scholar]
- Amako, K. , Meno, Y. and Takade, A. (1988) Fine structures of the capsules of Klebsiella pneumoniae and Escherichia coli K1. J Bacteriol 170, 4960–4962. [DOI] [PMC free article] [PubMed] [Google Scholar]
- Atlas, R.M. and Bartha, R. (1998) Microbial Ecology: Fundamentals and Applications, 4th ed. Benjamin/Cummings, Menlo Park, CA: Harlow. [Google Scholar]
- Ayres, H.M. , Furr, J.R. and Russell, A.D. (1998) Effect of divalent cations on permeabilizer‐induced lysozyme lysis of Pseudomonas aeruginosa . Lett in Appl Microbiol 27, 372–374. [DOI] [PubMed] [Google Scholar]
- Beuchat, L.R. and Golden, D.A. (1989) Antimicrobials occurring naturally in foods. Food Technol 43, 134–142. [Google Scholar]
- Buchanan, R.L. and Golden, M.H. (1994) Interaction of citric acid concentration and pH on the kinetics of Listeria monocytogenes inactivation. J Food Prot 57, 567–570. [DOI] [PubMed] [Google Scholar]
- Clifton, L.A. , Skoda, M.W.A. , Le Brun, A.P. , Ciesielski, F. , Kuzmenko, I. , Holt, S.A. and Lakey, J.H. (2015) Effect of divalent cation removal on the structure of Gram‐negative bacterial outer membrane models. Langmuir 31, 404–412. [DOI] [PMC free article] [PubMed] [Google Scholar]
- Davin‐Regli, A. and Pagès, J.M. (2015) Enterobacter aerogenes and Enterobacter cloacae; versatile bacterial pathogens confronting antibiotic treatment. Front Microbiol 6, 392. [DOI] [PMC free article] [PubMed] [Google Scholar]
- EPA (2012) Product Performance Test Guidelines. United States Environmental Protection Agency OPPTS 810.2300: Sanitizers for Use on Hard Surfaces‐Efficacy Data Recommendations. United States Environmental Protection Agency. EPA‐712‐C‐07‐091. Office of Chemical Safety and Pollution Prevention (7510P). [Google Scholar]
- Horn, N. and Bhunia, A.K. (2018) Food‐associated stress primes foodborne pathogens for the gastrointestinal phase of infection. Front Microbiol 9, 1962. [DOI] [PMC free article] [PubMed] [Google Scholar]
- Kundukad, B. , Udayakumar, G. , Grela, E. , Kaur, D. , Rice, S.S. , Kjelleberg, S. and Doyle, P.S. (2020) Weak acids as an alternative anti‐microbial therapy. Biofilm 2, 10.1016/j.bioflm.2020.100019. [DOI] [PMC free article] [PubMed] [Google Scholar]
- Lewis, K. (2010) Persister cells. Annu Rev Microbiol 64, 357–372. [DOI] [PubMed] [Google Scholar]
- Mani‐Lopez, E. , García, H.S. and López‐Malo, A. (2012) Organic acids as antimicrobials to control Salmonella in meat and poultry products. Food Res Int 45, 713–721. [Google Scholar]
- Mudunkotuwa, I.A. and Grassian, V.H. (2010) Citric acid adsorption on TiO2 nanoparticles in aqueous suspensions at acidic and circumneutral pH: surface coverage, surface speciation, and its impact on nanoparticle−nanoparticle interactions. J Am Chem Soc 132, 14986–14994. [DOI] [PubMed] [Google Scholar]
- Purevdorj‐Gage, L. , Nixon, B. , Bodine, K. , Xu, Q. and Doerrler, W.T. (2018) Differential effect of food sanitizers on formation of viable but nonculturable Salmonella enterica in poultry. J Food Prot 81, 386–393. [DOI] [PubMed] [Google Scholar]
- Russell, A.D. (1971) Ethylenediamine tetraacetic acid. In Inhibition and Destruction of the Microbial Celled, ed. Hugo, W.B. pp. 209–225. London: Academic Press. [Google Scholar]
- Springer, E.L. and Roth, I.L. (1973) Ultrastructure of the capsule of Klebsiella pneumoniae and slime of Enterobacter aerogenes revealed by freeze etching. Archiv Mikrobiol 93, 277–286. [DOI] [PubMed] [Google Scholar]
- Van der Rest, M.E. , Molenaar, D. and Konings, W.N. (1992) Mechanism of Na(+)‐dependent citrate transport in Klebsiella pneumoniae . J Bacteriol 174, 4893–4898. [DOI] [PMC free article] [PubMed] [Google Scholar]
- Xiong, R. , Xie, G. and Edmondson, A.S. (1999) The fate of Salmonella enteritidis PT4 in home‐made mayonnaise prepared with citric acid. Lett Appl Microbiol 28, 36–40. [DOI] [PubMed] [Google Scholar]
- Young, K.M. and Foegeding, P.M. (1993) Acetic, lactic and citric acids and pH inhibition of Listeria monocytogenes Scott A and the effect on intracellular pH. J Appl Bacteriol 74, 515–520. [PubMed] [Google Scholar]
- Zhou, C. , Wang, F. , Chen, H. , Meng, L. , Qiao, F. , Liu, Z. , Hou, Y. , Wu, C. et al. (2016) Selective antimicrobial activities and action mechanism of micelles self‐assembled by cationic oligomeric surfactants. ACS Appl Mater Inter 8, 4242–4249. [DOI] [PubMed] [Google Scholar]
Associated Data
This section collects any data citations, data availability statements, or supplementary materials included in this article.
Supplementary Materials
Figure S1. (a) pH measured in K. aerogenes controls (no CA) and samples (with CA) before incubation.
Figure S2. pH measured in E. coli controls (no CA) and samples (with CA) before incubation.
Figure S3. Effect of pH on S. aureus and antibacterial efficacy of 10% CA as a function of pH.


