

Abstract
Introduction
Loss to follow‐up in dementia studies is common and related to cognition, which worsens over time. We aimed to (1) describe dropout and missing cognitive data in the Swedish dementia registry, SveDem; (2) identify factors associated with dropout; and (3) estimate propensity scores and use them to adjust for dropout.
Methods
Longitudinal cognitive data were obtained from 53,880 persons from the SveDem national quality dementia registry. Inverse probability of censoring weights (IPCWs) were estimated using a logistic regression model on dropout.
Results
The mean annualized rate of change in Mini‐Mental State Examination (MMSE) in those with a low MMSE (0 to 10) was likely underestimated in the complete case analysis (+1.5 points/year) versus the IPCW analysis (−0.3 points/year).
Discussion
Handling dropout by IPCWs resulted in plausible estimates of cognitive decline. This method is likely of value to adjust for biased dropout in longitudinal cohorts of dementia.
Keywords: attrition, cognition, dementia, dropout, inverse probability of censoring weighting, loss to follow‐up, registry
1. BACKGROUND
Dementia is a syndrome characterized by loss of cognition and progressive functional decline. Alzheimer's disease is the most common neurodegenerative disorder causing dementia. It is associated with increased mortality,1, 2 and the reported time living with dementia varies from 3 to 12 years.3 Cognition has been used widely in longitudinal studies to reflect the stage of the dementia. It is often used as an outcome to evaluate the effectiveness of interventions for dementia. Cognition is typically assessed by cognitive scales such as the Mini‐Mental State Examination (MMSE) or the Montreal Cognitive Assessment as parts of a basic work‐up while a more thorough neuropsychiatric test battery is needed for more extensive evaluations.
In 1987, La Rue et al.4 highlighted the methodological concern on loss to follow‐up in AD. Recently, this has been described and reviewed in various longitudinal studies of dementia or older populations.5, 6, 7 These studies report various factors related to death and or dropout, such as demographic factors; caregiver status; medication use; and symptoms of cognition, behavior, and function. Although various modifiable factors and strategies to minimize this have been reported, it likely remains an important issue for observational studies and registries.
Dropout in a registry may be directly related to cognition (eg, severe cognitive deficits resulting in difficulties administering tests) or indirectly related to cognition (eg, minimal symptoms initiating a wait‐and‐see strategy, testing considered unnecessary after admission to nursing home, severe behavioral symptoms resulting in refusal to be tested). The various plausible reasons for dropout related to a person's cognitive status likely result in an underrepresentation of persons with only a mild cognitive deficit shortly after diagnosis or a severe cognitive deficit over longer time. When using data from complete cases only, the non‐random dropout causes a major risk for biased estimates of cognitive disease progression in terms of underestimating the progression at severe stages. Such confounding is particularly likely in natural cohorts relying on data obtained in usual clinical practice.
Several recommendations have been provided regarding handling dropout to enable unbiased estimates of disease progression in dementia research.8 Among them is multiple imputation and inverse probability of censoring weighting (IPCW). The relative advantages and disadvantages of these approaches have been described and it has been recognized that it may be worth using multiple imputation for missing values in (follow‐up) observations with almost complete data and IPCW to adjust for dropout (intended follow‐up observations with complete missing data).9 IPCW attempts to adjust for the underrepresentation of severe cognitive deficits. It weights complete cases by the inverse of their probability of being a complete case. This is done by first estimating the probability to drop out, for example using a logistic regression. Second, a weight is applied to each observation using the inverse of the predicted probability of dropout. This method and variations to it have been applied and discussed on longitudinal data on cognition in previous studies.10
RESEARCH IN CONTEXT
Systematic review: We searched publications on dropout handling in dementia in PubMed, and in references and citations of retrieved relevant publications. Previous research indicated methodological concerns related to dropout bias, factors associated to dropout, and methods to handle dropout.
Interpretation: We have described the application of inverse probability of censoring weighting to handle dropout in the Swedish dementia registry, SveDem, and used it to generate plausible estimates of the natural dementia disease progression. Results confirmed the methodological concerns and results from previous studies, indicating the relevance of handling dropout in longitudinal dementia data.
Future directions: Our study provides an accessible description of handling dropout in longitudinal data using inverse probability censoring weights, which could serve as a basis for future studies on the SveDem registry and as an example for handling dropout in other longitudinal dementia (real‐world registry) data.
The SveDem national incident dementia registry was created in 2007 to improve quality and equality of care for dementia patients throughout Sweden. Patients with different dementia diagnoses are registered at the time of the diagnosis with the aim to follow them annually until death.11 Cognition in SveDem is assessed with the MMSE at baseline and follow‐up. Until the end of 2017, > 74,000 patients have been registered with > 60,000 follow‐ups. All memory clinics, 75% of primary care units, and > 600 nursing homes diagnosing dementia in Sweden have joined SveDem.12
SveDem is a unique data source to follow cognition over time in patients with dementia in clinical settings. However, with follow‐up time the proportion of dropout in many dementia cohorts increases. Therefore, ways to handle dropout in the SveDem registry are needed.
We aimed to (1) describe dropout and missing cognitive data in the Swedish dementia registry, SveDem; (2) identify factors associated with dropout; and (3) estimate propensity scores and use them to adjust for dropout.
2. METHODS
Data from patients newly diagnosed with dementia were obtained from SveDem between January 1, 2007 and April 13, 2016, from memory outpatient clinics, primary care, and nursing home settings. The targeted time interval of follow‐up assessments was 1 year, up to eight yearly follow‐ups. We selected the data from 91,371 observations from 53,880 persons after excluding all records of the persons who had one or more records containing a possible error or who did not have any observation of MMSE13 (see Figure 1).
Figure 1.
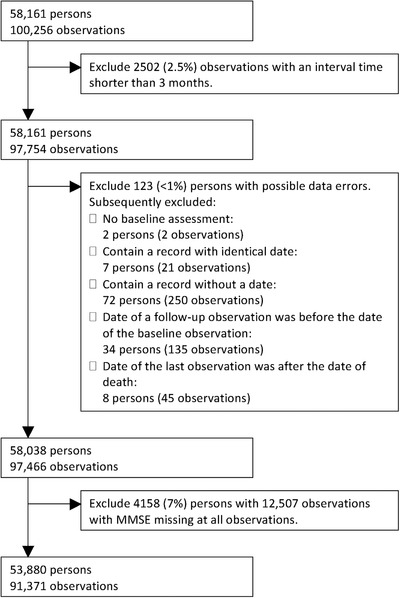
Flowchart of the data selection steps
2.1. Measures
The following measures were selected for analyses: date of assessment, date of birth, sex, date of death, living in nursing home (yes or no), performance of MMSE (yes, no, or untestable), MMSE total score, and a rating of global cognition (classified as improved, stable, or declined). The MMSE total score was used to classify the dementia as very mild (MMSE 26 to 30), mild (MMSE 21 to 25), mild‐moderate (MMSE 16 to 20), moderate (MMSE 11 to 15), and severe (MMSE 0 to 10).
SveDem is collated with the national population registry monthly so that deceased patients are withdrawn from the follow‐up schedule and a date of death is entered.
2.2. Statistical analysis
Descriptive statistics were used to describe missing data and dropout in terms of proportion and the distribution of the time from the last observation to the study end or death.
Intermediate missing values (ie, a missing MMSE score preceded and followed by a present MMSE score) were linearly interpolated over time.
A logistic regression model was fitted to the data to estimate for each observation the probability of being dropped out within the subsequent year. Dropout was defined as the last observed MMSE score without death or study end occurring in the subsequent year (which was the targeted follow‐up interval of the registry). All other observations with an (interpolated) MMSE score available were rated as non‐dropout. The selection of covariates was based on a priori candidates to predict dropout and the outcome of interest to reflect the natural disease progression (cognition). These were cognitive status (in terms of categorized MMSE and global cognition at the previous observation), age, sex, living in nursing home, and time since baseline assessment. The interactions between time and cognition (both MMSE and global cognition) that remained significant in a stepwise backward procedure were included. A missing score on global cognition and living in nursing home was included as an outcome category to prevent these observations from being omitted from the regression analysis.
Internal validity of the model was visually assessed by comparing the mean of the predicted probability of dropout to the observed probability of dropout in deciles of the predicted dropout probabilities.
IPCWs were derived as follows. First, the probability of dropping out of the study at the next scheduled visit was estimated for each observation through a logistic regression model including the predefined covariates. Second, each person's cumulative probability of remaining in the study (1—dropout probability) up to the current visit was calculated by multiplying the estimated probabilities of remaining in the study for all preceding observations. Third, the IPCW at each observation was derived by dividing 1 by the cumulative probability of remaining in the study. Weights were not balanced/stabilized by adjusting them for the baseline weight because any analysis would then require adjusting both for the IPCWs and the baseline weights. Instead, following the recommendations by Seaman and White9 incomplete cases were checked for zero or near‐zero fitted probabilities. Weights were visually inspected for presence of very large weights, which could dominate the analysis model. One weight was considered an outlier and was truncated at 150 because in the complete cases the sum of weights in the largest 10% (29,366) was close to half of the total sum of weights (83,039), which was considered an indication of an invalid dropout prediction model.
For each observation, the change from the current to the subsequent MMSE was divided by the interval time to obtain annualized rate of change in MMSE. Change rates outside the interval from −30 to 30 MMSE points per year (n = 15) were truncated to this interval. The mean rate of MMSE change and variation was described for each category of MMSE score. This was done with and without applying the IPCW. The IPCW at the current observation (reflecting the cumulative probability of dropout in the subsequent period) was applied to the rate of change from the current to the subsequent observation.
In addition, the natural progression was predicted using a simple model. First, the observed proportion of each change from the current to the subsequent MMSE (rounded to full MMSE points) was obtained for each of the MMSE categories of the current MMSE. Then, a virtual cohort of persons assumed to start at the observed distribution of MMSE at baseline for those with an MMSE between 15 and 30 was set up. The MMSE at each year was estimated by multiplying the proportion of each MMSE value at each time point with the proportions of changes in MMSE based on the specific classified MMSE they were in.
2.3. Sensitivity analysis
In a sensitivity analysis, the impact of various choices was tested. First, weights were not truncated. Second, weights were strongly truncated at 15. Third, MMSE change was not truncated.
The difference in two simple methods for handling those who were rated as untestable for MMSE were assessed to explore the extent to which dropout was related to those considered untestable. First, the observations at which cognition was rated as untestable were manually imputed with an MMSE of 0 and the analysis was further handled as complete case analysis. Second, a mixed model was fitted to those whose cognition was considered untestable at some point. The observations at which cognition was rated as untestable were manually imputed using the predicted values of the mixed model (both the fixed‐portion linear prediction and the contributions based on predicted individual random intercept and random effect of time) and the analysis was further handled as complete case analysis.
Last, the MMSE at observations with untestable cognition were manually imputed by subtracting a specific number of MMSE points followed by multiplying it by a specific factor such that the outcome was closest to the results obtained by the main IPCW analysis (referred to as the calibration approach).
3. RESULTS
The sample contained 37,187 regular follow‐up observations from memory clinics and primary care and 190 from a nursing home setting, from 53,880 persons with a mean age of 80 (standard deviation [SD] = 7.8), 59% female and mean MMSE of 20.9 (SD = 5.0) at baseline. A small proportion of the observations at baseline (4%) represented the severe stage of dementia with a mean MMSE of 7.6 (SD = 2.5).
At almost all available observations either a score of MMSE, global cognition, or untestable was available (see Table 1). A missing intermediate MMSE (preceded and followed by a present MMSE score) occurred in 1.8% of the persons.
Table 1.
Percentage present or missing cognitive data at baseline and follow‐up observations
| Baseline | Follow‐up | |
|---|---|---|
| Available observations | 53,880 | 37,491 |
| MMSE score present | >99% | 68% |
| 26–30 (very mild) | 18% | 17% |
| 21–25 (mild) | 40% | 38% |
| 16–20 (mild‐moderate) | 27% | 28% |
| 11–15 (moderate) | 11% | 12% |
| 6–10 (severe) | 3% | 5% |
| 0–5 (very severe) | <1% | <1% |
| MMSE untestable | <1% | 8% |
| MMSE missing | <1% | 24% |
| Global cognition present | 0% | 95% |
| MMSE missing (or untestable) and global cognition missing | <1% | 2% |
Abbreviation: MMSE, Mini‐Mental State Examination.
During the follow‐up period 19,211 (36%) persons died. The time between the last observation of MMSE and death, as well as between the last observation of MMSE and study end is displayed in Figure 2. Because the targeted interval was 1 year, all times longer than 1 year (76% of the persons who died and 75% of the persons who did not die) reflect right‐censored data (ie, dropout). About 5% was no longer considered right censored when taking untestable or a rating of global cognition into account.
Figure 2.
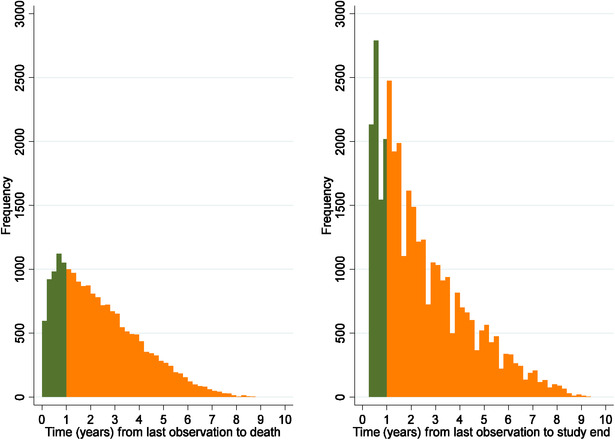
Histogram of each person's time between last observation of cognitive status and study end (left) or death (right). Green (dark) indicates a time within the targeted interval and orange (light) indicates a time outside the targeted interval. Cognitive status was defined as either a rating of the Mini‐Mental State Examination (MMSE), global cognition, or being untestable
The time between two intervals was < 4 months in 0.3%, between 4 and 8 months in 22%, ± 3 months of the targeted interval of 1 year in 65%, and > 16 months in 13%.
All factors except both interaction terms significantly predicted dropout by the logistic regression analysis (see Table 2). This indicated that dropout was conditional on these factors, and thus, not completely at random. The pseudo R2 was 0.014 (see calibration plot in Figure S1 in supporting information).
Table 2.
Logistic regression results for predicting dropout
| Covariate | Odds ratio (95% CI) | P‐value |
|---|---|---|
| Age | 1.01 (1.01–1.01) | 0.000 |
| Female | 1.10 (1.06–1.13) | 0.000 |
| MMSE | ||
| 26–30 (very mild) | Reference | |
| 21–25 (mild) | 1.11 (1.06–1.15) | 0.000 |
| 16–20 (mild to moderate) | 1.32 (1.26–1.38) | 0.000 |
| 11–15 (moderate) | 1.66 (1.57–1.75) | 0.000 |
| 0–10 (severe) | 1.99 (1.84–2.16) | 0.000 |
| Global cognition | ||
| Improved | 1.02 (0.94–1.11) | 0.643 |
| Stable | Reference | |
| Declined | 1.14 (1.08–1.21) | 0.000 |
| Missing | 1.07 (1.02–1.13) | 0.010 |
| Time (years) | 0.89 (0.87–0.91) | 0.000 |
| Living in nursing home | ||
| No | Reference | |
| Yes | 1.46 (1.37–1.55) | 0.000 |
| Missinga | 1.59 (1.19–2.14) | 0.002 |
| Constant | 0.27 (0.24–0.32) | 0.000 |
Proportion missing living in nursing home was <1%.
Abbreviation: CI; confidence interval; MMSE, Mini‐Mental State Examination.
The mean annualized rate of change in MMSE between visits without and with applying the IPCW is plotted in Figure 3. This indicates that the decline in MMSE in those with a low MMSE at their previous observation in the whole population was likely lower than that observed in the complete cases. Figure 4 indicates the predicted progression of MMSE over a 15‐year period. This shows a corresponding pattern of more progressive decline in weighted predictions.
Figure 3.
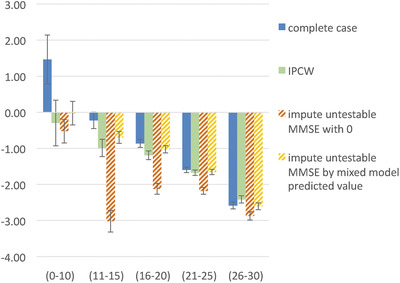
Mean annualized change in Mini‐Mental State Examination (MMSE) (y‐axis) by categorized MMSE at previous observation (x‐axis) and 95% confidence interval
Figure 4.
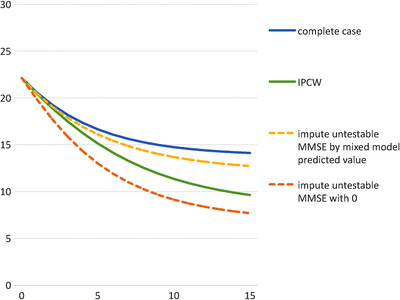
Mean predicted Mini‐Mental State Examination (MMSE) (y‐axis) over 15 years after diagnosis (x‐axis); (using observed distribution of starting MMSE between MMSE 15 and 30)
The results of the sensitivity analysis indicated an ignorable effect of not truncating weights and not truncating MMSE rate of change. When truncating weights at 15 instead of 150, the mean annualized change was 0.0 instead of −0.3 for MMSE 0–10 and relatively unchanged in the other MMSE categories. The results of using the mixed model (see Table S1 in supporting information) to impute the MMSE for those considered untestable remained relatively close to the weighted results. Imputing untestable with 0 resulted in relatively large differences for the moderate MMSE ranges (see Figure 3). The calibration approach by manually imputing the missing MMSE by subtracting 0.5 points from the previous MMSE and then multiplying it with 0.80 resulted in similar estimates as the IPCW method.
4. DISCUSSION
The SveDem registry showed a significant proportion of dropout, in which cognitive status likely plays a role. After weighting MMSE observations for the IPCW, the results showed robust and face valid estimates of disease progression, indicating the potential as well as the importance of this method.
Controlled research (cohort) studies are designed to ensure generalization to the real world and therewith attempt to obtain observations of cognition regardless of whether this is considered relevant from a clinical point of view. The SveDem registry is a natural cohort containing data obtained in usual clinical practice. The consideration to obtain an observation of cognition is likely also dependent on whether this is considered clinically relevant or whether there is sufficient time to perform the MMSE. Therefore, the results of this study showing the presence of conditional dropout is not unexpected.
Other longitudinal studies related to aging or to dementia5, 6, 7 have identified a variety of factors to be associated to dropout, often including (global) cognition. The inconsistency in the results in these studies could be due to the difference in the set of factors adjusted for, or a variation in efforts to follow up with participants.
The unweighted results reflect an invalid situation in which the mean cognition improved 1.5 MMSE points per year when persons had severe dementia. Although on an individual level people could show a (temporary) improvement of cognition, this subsample's mean is highly unlikely to improve due to the neurodegenerative disease underlying the dementia resulting in the slowly progressive decline of cognition. The weighted results showed a mean annual decline of 0.3 MMSE points in this subsample of severe dementia (MMSE 0–10), which seems a more plausible reflection of the disease progression. Nevertheless, one could expect a larger decline. Probably, the floor level of the MMSE could cause the relatively slow decline in this severe stage of dementia. Other scales could be more sensitive in this stage of the disease, such as scales on activities of daily living.
The rate of MMSE change differed across the spectrum (as indicated in Figure 3, the mean annual MMSE change was −2.4 for those with MMSE 26 to 30 and −0.3 for those with MMSE 0 to 10). The IPCW model takes this into account as both the severity level (ie, categorized MMSE) as well as the change (ie, global change in cognition) were included as predictors for dropout. For example, in an analysis to predict cognitive decline by early (cognitive) predictors, IPCW ensures that cases who dropped out are compensated by upweighting cases who did not drop out with a similar (often relatively large) decline specific to this early mild stage. This also holds for survival analysis in which for example a dropout in severe dementia is compensated by observed cases with a decline rate specific to that stage. Interestingly, the interaction between cognitive status and cognitive change was not significant, indicating a similar effect of change in cognition across the absolute level of cognition.
Reasons for dropout other than cognition (eg, language issues) have not been explored, because such information is not collected in SveDem. Another reason is that some patients are referred from memory clinics to primary care clinics not affiliated to SveDem, and thus, data are no longer collected. The results, however, indicate that cognitive status is an important driver of dropout. As cognition is a key outcome in dementia, not taking cognition into account could introduce a significant bias in longitudinal analysis on this outcome. This is particularly the case when including severe stages of dementia. It is, therefore, strongly recommended to consider selective dropout and apply methods to adjust for it.
The IPCW method seems to enable a plausible estimate of cognitive decline in comparison to the complete case analysis. Although it was possible to calibrate a manual imputation to the IPCW results, it is likely not generalizable to other datasets that have selected a different population.
The results based on the mixed model with random intercept and random effect of time were relatively similar to the IPCW‐based results. This supports the validity of both methods. The advantage of the IPCW method is that it enables adjustment of estimates not only for those considered untestable but also for dropout, and is applicable to statistical analysis other than mixed linear regression.
4.1. Limitations
We have not compared the IPCW to other proven approaches to adjust for missing data such as multiple imputation. This leaves the possibility that better adjustment methods are available. Seaman and White9 have discussed several conditions to choose IPCW over MI. IPCW is less technical and easier to understand or explain than MI. If a large part of the data is missing or if the analysis model includes interaction, quadratic, or random effect terms, an imputation model is likely more easily misspecified than an IPCW model. For example, relatively complex epidemiological models exist for the evaluation of disease pathways in terms of pathology or risk factors and their mediators,15 which would require an adequate imputation model. If the distribution of the predictors differs between the observed and missing data, then IPCW will likely better reflect its related uncertainty due to the implicit required extrapolation in MI of imputed values outside the observed distribution. If individuals have missing values on many or all variables at a single observation (eg, due to a completely missed visit) an imputation model for their joint distribution could relatively easy be misspecified. However, IPCW uses only complete cases and omits valuable information from observations with partially available data. A solution could be to impute missing data on those observations for which only part of the data is missing and use IPCW for those observations after having dropped out of a study (ie, in which all data of an observation are missing). A comprehensive overview of these conditions is, however, outside the scope of this research. Other studies have provided a detailed overview of methods, statistical background, and benchmarks.10, 14 These studies covered topics such as handling death differently from dropout, joint modeling, mixed modeling, generating estimates conditional on being alive, associations between dropout and death, and known death status after dropout.
Our results may not be generalizable to missing data in trials as missing data might differ due to the shorter follow‐up time and the concerted efforts to maintain patients in the study and a different study aim.16
The validity of the adjusted estimates depends on the correctness of the specified model. Possibly factors other than the ones included might have been related to dropout, such as the availability of an informal caregiver. Although the R2 was low, the calibration plot indicated a correct estimate of the probability of dropout, and the MMSE progression in adjusted analysis is more clinically plausible than the unadjusted analysis. Thus, the adjustment appears to at least partially adjust for the likely bias due to dropout.
The data entering of the registry was likely not fully completed. However, dropout due to not having been entered is unlikely to be associated with a person's cognitive status and could be considered completely at random.
5. CONCLUSIONS
Dropout in the SveDem registry was partially conditional on cognitive status and resulted in implausible estimates of cognitive decline. Handling dropout by IPCWs resulted in plausible estimates of cognitive decline. This method is likely to be of value to adjust for probable biased dropout in longitudinal cohorts of dementia.
ETHICS APPROVAL AND CONSENT TO PARTICIPATE
This research was approved by the ethical review board in Stockholm, reference DNR 2016/2244‐31.
AVAILABILITY OF DATA AND MATERIAL
The individual data from this study are not possible to share. Data from the Swedish Dementia Registry, SveDem are available for research only after ethical approval for a specific project. The code for the data analysis of this study is available from the corresponding author on reasonable request. Results on regional and national level are published in a yearly report available at www.svedem.se.
COMPETING INTERESTS
ME has nothing to disclose.
RH reports the following to conduct the study: fellowship grant from Alzheimer association Nederland. RH reports the following outside this study: consulting fees from Piramal and Roche; grants from Horizon 2020, JPND Joint Programming Neurodegenerative Disease Research, IMI Innovative Medicines Initiative, national and European funding organizations, and private‐public collaborations (ZonMw Netherlands; Alzheimer Netherlands; Dutch Flutemetamol Study; Alzheimer Research UK; Swedish National study on Aging and Care; European Brain Council).
LJ is an employee of H. Lundbeck A/S.
SP is supported by a postdoctoral fellowship from the Swedish Society for Medical Research.
AW reports the following outside this study: consulting fees from Biogen, grants from Merck.
FUNDING
SveDem is supported financially by the Swedish Associations of Local Authorities and Regions.
This study was supported by the Swedish Research Council (grant # 2016‐02317), FORTE (grant # 2017‐0164), Svenska Sällskapet för Medicinsk Forskning, the Swedish Order of St John, the Swedish Stroke Association, and grants from the Regional Agreement on Medical Training and Clinical Research (ALF) between Stockholm County Council and Karolinska Institutet.
Ron Handels acknowledges financial support received from the Dutch Alzheimer's Association, "Alzheimer Nederland," grant number WE.15‐2016‐09.
The funding bodies had no role in the design of the analysis, interpretation of data, and in writing the manuscript.
AUTHOR CONTRIBUTIONS
Conception (RH, LJ, and ME), design (RH and LJ), acquisition (ME, AW, and SGP), analysis (RH and LJ), interpretation (RH and LJ), draft manuscript (RH), and substantially revise manuscript (all).
AUTHORS' INFORMATION (OPTIONAL)
ME is registry holder/director of the Swedish dementia registry and responsible for/managing the daily running of the registry.
Supporting information
Table S1: Mixed model results for MMSE over time, adjusted for covariates in subsample of persons who will become untestable (n = 2274).
Figure S1: Calibration plot of the logistic regression: 50 equally sized groups of 1605 participants ordered by ascending probabilities; each capped spike represents the 95% confidence interval of the observed proportion of dropout; the diagonal line represents the desired situation in which the mean predicted probability of dropout is equal to observed proportion of dropout.
ACKNOWLEDGMENTS
The authors are grateful to SveDem (www.svedem.se) for providing data for this study as well as many thanks to all participants in SveDem (patients, caregivers, and staff).
Handels R, Jönsson L, Garcia‐Ptacek S, Eriksdotter M, Wimo A. Controlling for selective dropout in longitudinal dementia data: Application to the SveDem registry. Alzheimer's Dement. 2020;16:789–796. 10.1002/alz.12050
REFERENCES
- 1. Garcia‐Ptacek S, Farahmand B, Kareholt I, Religa D, Cuadrado ML, Eriksdotter M. Mortality risk after dementia diagnosis by dementia type and underlying factors: a cohort of 15,209 patients based on the Swedish Dementia Registry. J Alzheimers Dis. 2014;41(2):467‐477. [DOI] [PubMed] [Google Scholar]
- 2. Andersen K, Lolk A, Martinussen T, Kragh‐Sorensen P. Very mild to severe dementia and mortality: a 14‐year follow‐up–the Odense study. Dement Geriatr Cogn Disord. 2010;29(1):61‐67. [DOI] [PubMed] [Google Scholar]
- 3. Kua EH, Ho E, Tan HH, Tsoi C, Thng C, Mahendran R. The natural history of dementia. Psychogeriatrics. 2014;14(3):196‐201. [DOI] [PubMed] [Google Scholar]
- 4. La Rue A. Methodological concerns: longitudinal studies of dementia. Alzheimer Dis Assoc Disord. 1987;1(3):180‐192. [DOI] [PubMed] [Google Scholar]
- 5. Burke SL, Hu T, Naseh M, et al. Factors influencing attrition in 35 Alzheimer's Disease Centers across the USA: a longitudinal examination of the National Alzheimer's Coordinating Center's Uniform Data Set. Aging Clin Exp Res. 2018, Dec 10. 10.1007/s40520-018-1087-6. Epub ahead of print. [DOI] [PMC free article] [PubMed] [Google Scholar]
- 6. Coley N, Gardette V, Toulza O, et al. Predictive factors of attrition in a cohort of Alzheimer disease patients. The REAL.FR study. Neuroepidemiology. 2008;31(2):69‐79. [DOI] [PubMed] [Google Scholar]
- 7. Chatfield MD, Brayne CE, Matthews FE. A systematic literature review of attrition between waves in longitudinal studies in the elderly shows a consistent pattern of dropout between differing studies. J Clin Epidemiol. 2005;58(1):13‐19. [DOI] [PubMed] [Google Scholar]
- 8. Weuve J, Proust‐Lima C, Power MC, et al. Guidelines for reporting methodological challenges and evaluating potential bias in dementia research. Alzheimers Dement. 2015;11(9):1098‐1109. [DOI] [PMC free article] [PubMed] [Google Scholar]
- 9. Seaman SR, White IR. Review of inverse probability weighting for dealing with missing data. Stat Methods Med Res. 2013;22(3):278‐295. [DOI] [PubMed] [Google Scholar]
- 10. Dufouil C, Brayne C, Clayton D. Analysis of longitudinal studies with death and drop‐out: a case study. Stat Med. 2004;23(14):2215‐2226. [DOI] [PubMed] [Google Scholar]
- 11. Religa D, Fereshtehnejad SM, Cermakova P, et al. SveDem, the Swedish Dementia Registry–a tool for improving the quality of diagnostics, treatment and care of dementia patients in clinical practice. PLoS One. 2015;10(2):e0116538. [DOI] [PMC free article] [PubMed] [Google Scholar]
- 12. Kvalitetsregister N. Nulägesrapport våren 2017 satsningen på nationella kvalitetsregister. 2017. Available at: http://www.kvalitetsregister.se/tjanster/omnationellakvalitetsregister/satsning20122016/nulagesrapport.2015.html on 11‐04‐2019.
- 13. Folstein MF, Folstein SE, McHugh PR. “Mini‐mental state”. A practical method for grading the cognitive state of patients for the clinician. J Psychiatr Res. 1975;12(3):189‐198. [DOI] [PubMed] [Google Scholar]
- 14. Wen L, Terrera GM, Seaman SR. Methods for handling longitudinal outcome processes truncated by dropout and death. Biostatistics. 2018;19(4):407‐425. [DOI] [PMC free article] [PubMed] [Google Scholar]
- 15. Hafeman DM, VanderWeele TJ. Alternative assumptions for the identification of direct and indirect effects. Epidemiology. 2011;22:753‐764. [DOI] [PubMed] [Google Scholar]
- 16. Coley N, Gardette V, Cantet C, et al. How should we deal with missing data in clinical trials involving Alzheimer's disease patients? Curr Alzheimer Res. 2011;8(4):421‐433. [DOI] [PubMed] [Google Scholar]
Associated Data
This section collects any data citations, data availability statements, or supplementary materials included in this article.
Supplementary Materials
Table S1: Mixed model results for MMSE over time, adjusted for covariates in subsample of persons who will become untestable (n = 2274).
Figure S1: Calibration plot of the logistic regression: 50 equally sized groups of 1605 participants ordered by ascending probabilities; each capped spike represents the 95% confidence interval of the observed proportion of dropout; the diagonal line represents the desired situation in which the mean predicted probability of dropout is equal to observed proportion of dropout.
Data Availability Statement
The individual data from this study are not possible to share. Data from the Swedish Dementia Registry, SveDem are available for research only after ethical approval for a specific project. The code for the data analysis of this study is available from the corresponding author on reasonable request. Results on regional and national level are published in a yearly report available at www.svedem.se.