

Abstract
BACKGROUND AND PURPOSE:
Double inversion recovery has been suggested as the MR imaging contrast of choice for segmenting cortical lesions in patients with multiple sclerosis. In this study, we sought to determine the utility of double inversion recovery for cortical lesion identification by comparing 3 MR imaging reading protocols that combine different MR imaging contrasts.
MATERIALS AND METHODS:
Twenty-five patients with relapsing-remitting MS and 3 with secondary-progressive MS were imaged with 3T MR imaging by using double inversion recovery, dual fast spin-echo proton-density/T2-weighted, 3D FLAIR, and 3D T1-weighted imaging sequences. Lesions affecting the cortex were manually segmented by using the following 3 MR imaging reading protocols: Protocol 1 (P1) used all available MR imaging contrasts; protocol 2 (P2) used all the available contrasts except for double inversion recovery; and protocol 3(P3) used only double inversion recovery.
RESULTS:
Six hundred forty-three cortical lesions were identified with P1 (mean = 22.96); 633, with P2 (mean = 22.6); and 280, with P3 (mean = 10). The counts obtained by using P1 and P2 were not significantly different (P = .93). The counts obtained by using P3 were significantly smaller than those obtained by using either P1 (P < .001) or P2 (P < .001). The intraclass correlation coefficients were P1 versus P2 = 0.989, P1 versus P3 = 0.615, and P2 versus P3 = 0.588.
CONCLUSIONS:
MR imaging cortical lesion segmentation can be performed by using 3D T1-weighted and 3D FLAIR images acquired with a 1-mm isotropic voxel size, supported by conventional T2-weighted and proton-density images with 3-mm-thick sections. Inclusion of double inversion recovery in this multimodal reading protocol did not significantly improve the cortical lesion identification rate. A multimodal approach is superior to using double inversion recovery alone.
Multiple sclerosis is an inflammatory and neurodegenerative disease that affects both the white matter and gray matter of the central nervous system. Postmortem immunohistochemical characterization of cortical lesions (CLs) has allowed the identification of a substantial burden of cortical GM lesions in patients with long-standing MS.1–5 However, the prevalence of cortical lesions at earlier stages of MS is underexplored.6 As a result, an efficient, standardized MR imaging protocol for segmentation of CLs in early-stage MS has become an important research goal. Double inversion recovery (DIR) MR imaging has generally been selected because it enhances the conspicuity of GM by suppressing unwanted signal from both WM and CSF. However, DIR images have a low signal-to-noise ratio due to the application of 2 inversion pulses. They are also prone to hyperintense vascular artifacts, which can confound CL identification.7–14
In 2011, an international panel of experts formulated consensus recommendations for scoring CLs at 1.5T and 3T by using DIR.11 As part of the recommendations, they noted that in the future, the additional use of other MR imaging contrasts (T1-weighted, T2-weighted, or fluid-attenuated inversion recovery images) in combination with DIR could improve the detection of cortical lesions by reducing the number of false-positives and false-negatives. Several groups have since reported on such multicontrast approaches for segmenting CLs. Examples include the following: 1) CL segmentation performed by using a single MR imaging contrast followed by subsequent verification of lesion labels on other contrasts13; 2) CL segmentation performed independently by using 2 different MR imaging contrasts, where a tight correlation between the counts is considered evidence that each MR imaging contrast yields counts proportional to the real lesion load15; 3) CL segmentation performed by using a single MR imaging contrast with the results subsequently reviewed by a second (more experienced) rater who uses other contrasts to resolve ambiguities/potential false-positives16; and 4) CL segmentation performed independently for each independent contrast, and then each count compared with the counts obtained from the other MR imaging contrasts to determine which one detects the highest number of lesions.17 The variability among these methods has led to difficulty in developing a standardized CL segmentation protocol.11 Consequently, a major goal of this work was to identify a robust, multicontrast CL segmentation protocol that could be used with more generally available MR imaging pulse sequences at clinically accessible magnetic field strengths.
According to the consensus recommendations, only type I leukocortical and type II intracortical lesions should be considered for radiologic scoring11 in MS. However, type I lesions affecting both the cortex and the juxtacortical white matter are often difficult to differentiate from purely juxtacortical lesions. Consequently, these lesions can be misclassified. Type II lesions are the smallest and affect the cortex without reaching either the pial or white matter boundaries. These lesions are also challenging to detect visually by using 1.5T or 3T MR imaging. Subpial lesions (type III and IV), extending from the pial boundary down to the white matter surface, are not considered within the consensus guidelines for MR imaging at 1.5 and 3T due to their low detectability at these clinical field strengths. Even with these simplifying assumptions in place, CL identification has been highly variable.10,13,18,19 The prevalence of MR imaging–identified intracortical lesions ranges from 8.2% to 46% across different published reports.10,12,13,18,19 This variability may partially reflect the variable sensitivity of current MR imaging protocols but also may indicate the inherent variability of cortical lesion involvement across MS disease stages and individual patients. Support for this hypothesis is provided by histology studies in which the percentage of intracortical lesions (type II) also shows a wide range: 7%–31% and 17%–71% when we consider types I and type II combined.1–6,19,20,21
A significant aim of our study was to simplify and improve the process of manual cortical lesion segmentation when using multiple MR imaging contrasts derived from 3T MR imaging. We specifically strived to identify a lesion-segmentation method with reduced variability and reduced false-positive identifications. To do this, we avoided classification of cortical lesions into subtypes.
Materials and Methods
Participants
A cohort of 20 patients with MS (15 female, 5 male; 17 with relapsing-remitting MS, 3 with secondary-progressive MS; between 26 and 63 years of age) was recruited from the MS Clinic of the Montreal Neurological Hospital in a prospective study designed to assess cortical GM pathology. Twenty-eight scans were used for testing 3 MR imaging–based, multicontrast CL segmentation protocols. Eight subjects had a second MR imaging 24 months after the first one (these scans were included in the 28 scans). None of the patients underwent treatment with corticosteroids in the month before the MR imaging. Fourteen patients were receiving immune-modulating treatment. The median Expanded Disability Status Scale score was 2 (range, 0–8).
MR Imaging Acquisition
All patients were imaged on a Tim Trio 3T (Siemens, Erlangen, Germany) whole-body MR imaging scanner with a volume-transmit coil and a 12-channel receive coil. For each patient, we acquired the following images: T1-weighted images collected with a 3D gradient recalled-echo sequence, proton density–weighted (PD-weighted) and T2-weighted images obtained from a dual-echo turbo spin-echo sequence, and 3D FLAIR and 3D DIR images. Scan parameters for each sequence are listed in the Table.
MRI acquisition parametersa
| T1WI | PD/T2WI | FLAIR | DIR | |
|---|---|---|---|---|
| Sequence | 3D FLASH | Dual-echo TSE | 3D SPACE (tse_vfl) | 3D SPACE (tse_vfl) |
| Orientation | Axial | Axial | Sagittal | Sagittal |
| TR (ms) | 22 | 2200 | 6000 | 7500 |
| TE (ms) | 5 | 12, 83 | 355 | 323 |
| TI (ms) | NA | NA | 2200 | 3000 |
| Sections | 192 | 60 | 176 | 120 |
| Voxel size (mm × mm × mm) | 1 × 1 × 1 | 1 × 1 × 3 | 1 × 1 × 1 | 1.5 × 1.5 × 1.5 |
| Scan time (min:sec) | 9:38 | 7:02 | 8:5 | 6:53 |
Note:—SPACE indicates sampling perfection with application-optimized contrasts by using different flip angle evolutions (Siemens, Erlangen, Germany); tse_vfl, turbo spin echo-variable flip angle; NA, not applicable.
Pertinent MRI sequence acquisition parameters for the 5 MRI contrasts used in our manual cortical lesion-segmentation methods.
MR Imaging Analysis
All MR images were scored by 1 rater (J.M. with >10 years of experience in quantification procedures on MR imaging research scans of patients with MS). After bias field correction (Sled et al22) of all images, 3D FLAIR, PD-weighted, T2-weighted, and DIR images were linearly registered and resampled to the image space of the T1-weighted image (1-mm3 isotropic voxels). Subsequently, CLs were manually segmented by using the interactive software package Display, part of the minc-toolkit (https://github.com/BIC-MNI) developed at the McConnell Brain Imaging Center of the Montreal Neurological Institute. This program allows simultaneous viewing and segmentation in the coronal, sagittal, and axial planes and cycling between each image volume. The image volumes are coregistered so that when assessing a given voxel or region and switching from one contrast (eg, DIR) to another (eg, FLAIR), the rater is assessing the intensity signal of the same region of the brain on each contrast. Each window allows zooming in and out, and a painting tool allows marking voxels with a given color (label number). All CLs identified in one plane are simultaneously shown in the other 2 orientations. Marked voxels are saved in a separate label file that can be loaded on its own or superimposed on the brain images.
For lesion segmentation, the rater scrolled through contiguous sections in the axial plane while inspecting the images in the following order for each axial section: T1WI, FLAIR, DIR, PD-weighted, and T2WI and cycling back and forth between each contrast, as needed. The preferred image orientation used for CL segmentation was the axial plane. However, results were verified by examining the image volume in the sagittal and coronal planes, and the operator could examine sections above and below to resolve any ambiguities and assess the shape of the candidate lesion in 3D.
To be considered a CL, an image region had to include at least 3 contiguous voxels; be hyperintense on T2-weighted images, FLAIR, and DIR; and be hypointense on T1-weighted images in relation to normal-appearing adjacent cortex. These criteria were adopted in an attempt to reduce the number of false-positive identifications. We found the high gray matter/white matter contrast and resolution of the 3T T1-weighted sequence particularly useful in assessing whether a CL crossed the cortical boundary or was simply adjacent to the boundary (juxtacortical lesions).
The 3 multicontrast rating protocols used in this study were defined as follows:
Protocol 1 (P1): CLs were segmented by using T1WI, FLAIR, DIR, PD-weighted, and T2WI. All images were bias field corrected, resampled to 1-mm isotropic resolution, and linearly registered to the image space of the T1-weighted image.
Protocol 2 (P2): CLs were segmented by using T1WI, FLAIR, PD-weighted, and T2WI. All images were bias field corrected, resampled to 1-mm isotropic resolution, and linearly registered to the image space of the T1-weighted image.
Protocol 3 (P3): CLs were segmented by using DIR alone. The DIR image was bias field corrected, and segmentation was performed by using the DIR at the native resolution of 1.5 × 1.5 × 1.5 mm3.
There was an interval of at least 8 days between each protocol read (8 days between the end of the read using P1 and the beginning of the read with P2 and 10 days between P2 and P3). During this time, the rater performed manual cortical lesion segmentation of scans from a completely different cohort of subjects to minimize recall of lesion locations and morphology before commencing the next rating protocol.
All scans were read in random order to minimize any recall effect. CL subtype classification (intracortical, leukocortical, and so forth) was not performed to avoid ambiguity. Only CLs that affected the neocortical gray matter were considered. No segmentation of lesions in the cerebellum or subcortical gray matter was performed.
Once all the CL segmentations were completed, the intersection of the labels generated by using P1 and P2 was computed to calculate the percentage of lesions that were detected by both P1 and P2. The same operation was performed by using the labels from P1 and P3, and then from P2 and P3. These comparisons were performed to determine the percentage of lesions detected in common across the 3 rating protocols.
Statistical Analysis
We quantitatively compared the results from each protocol by using 3 approaches:
Intraclass correlation coefficients (ICCs) were calculated between reading protocols (ie, P1 versus P2, P1 versus P3, and P2 versus P3). We used the ICC because it provides a general measurement of agreement between ≥2 raters or evaluation methods. In our case, we were comparing 3 evaluation methods: our 3 MR imaging reading protocols. Additionally, the ICC describes how strongly units in the same group resemble each other and operates on data structured as groups. Our 3 groups are the lesion count results of each reading protocol, and the units of the group are the counts obtained in each of 20 cases. We only used the 20 baseline scans for ICC and did not include the 8 repeat scans acquired at month 24. The value 1 represents perfect agreement; and zero, no agreement at all.
A nonparametric, Wilcoxon signed rank test for correlated samples was applied to test significant differences in lesion counts obtained between different segmentation protocols.
The pair-wise percentage agreement in lesion location between reading protocols was assessed on the basis of the spatial correspondence of the segmented labels for each lesion. To be considered the same lesion, the segmented regions had to have a minimum of 3 overlapping voxels. Note that here we were not assessing the degree of overlap of the lesion labels at the voxel level but the agreement in capturing the same lesions across the different protocols, independent of the extent or borders of each lesion.
Results
Six hundred forty-three CLs were segmented by using protocol P1; 633, using P2; and 279 using P3 (On-line Table). The counts obtained by using P1 and P2 were not significantly different (P = .93). The counts obtained by using P3 were significantly smaller than those obtained by using either P1 (P < .001) or P2 (P < .001). The intraclass correlation coefficient of P1 versus P2 was 0.989, the ICC of P1 versus P3 was 0.615, and the ICC of P2 versus P3 was 0.588.
The percentage agreement among the labels (Fig 1) generated by using each reading protocol demonstrates that CLs segmented by using P1 (75%) are largely the same as those segmented by using P2 (76%). Most lesions segmented with P3 (76.4%) were also segmented in the first 2 reading protocols. This feature suggests that the lower total lesion counts obtained by using P3 may be due to a higher number of false-negatives obtained when reading DIR images alone.
Fig 1.

Representative multicontrast cortical lesion segmentation examples. Image contrasts shown include FLAIR, DIR, T2WI, and T1WI (A–D). Lesion location is demarcated by a red pointer. D, Enlarged view of the lesion showing the overlap of labels produced by using protocols P1 and P2. The green voxels represent the overlap between masks generated with P1 and P2, the red voxels identify voxels segmented only with P1, and the blue voxels represent voxels segmented only with P2.
When assessing the discrepancies in lesion segmentation across protocols, we can make several general observations:
Discrepancies in the lesions segmented as true-positives by using P1 and P2 arose in cases in which the involvement of the cortex was unclear. Specific examples are as follows: 1) lesions considered leukocortical on one contrast and juxtacortical on a different one; 2) areas that appeared hypointense on T1WI but very slightly hyperintense in either FLAIR, DIR, and/or T2WI (Fig 2); and 3) areas that had the expected intensity characteristics of a CL but were found in regions in which there were clear, colocalized, CSF flow artifacts.
Lesions detected by using P3, but not in P1 or P2, were most frequently a result of: 1) labeling purely juxtacortical lesions with no cortical involvement as cortical lesions and 2) voxels with high signal only on DIR without evidence of lesions in all the other modalities (Fig 3), which could be explained by intrinsic noise of the technique or vascular artifacts.
Lesions not identified by using P3 were related to the following: 1) considering a hyperintense area as vascular artifacts when, in fact, the area was a lesion (Fig 3)11,13,18; 2) leukocortical lesions that were incorrectly identified as being juxtacortical; 3) CLs in areas where the cortex appears to have higher signal on DIR (eg, the cingulate cortex, insular cortex), resulting in the CLs being more difficult to identify with confidence; 4) CLs that appeared almost isointense with adjacent normal-appearing cortex on DIR images but that appeared hyperintense on inspection of FLAIR and hypointense on T1-weighted images (Fig 2).
Fig 2.

Cortical lesions not apparent on DIR: T1-weighted (A), FLAIR (B), and DIR (C). CLs affecting the cortex are marked with a red square and zoomed. Note the clear hypointense signal on the T1-weighted image and the clear hyperintense signal on FLAIR images. The lesion is less evident on DIR because it is only slightly hyperintense compared with surrounding cortex, possibly due to greater partial volume effects than in FLAIR.
Fig 3.
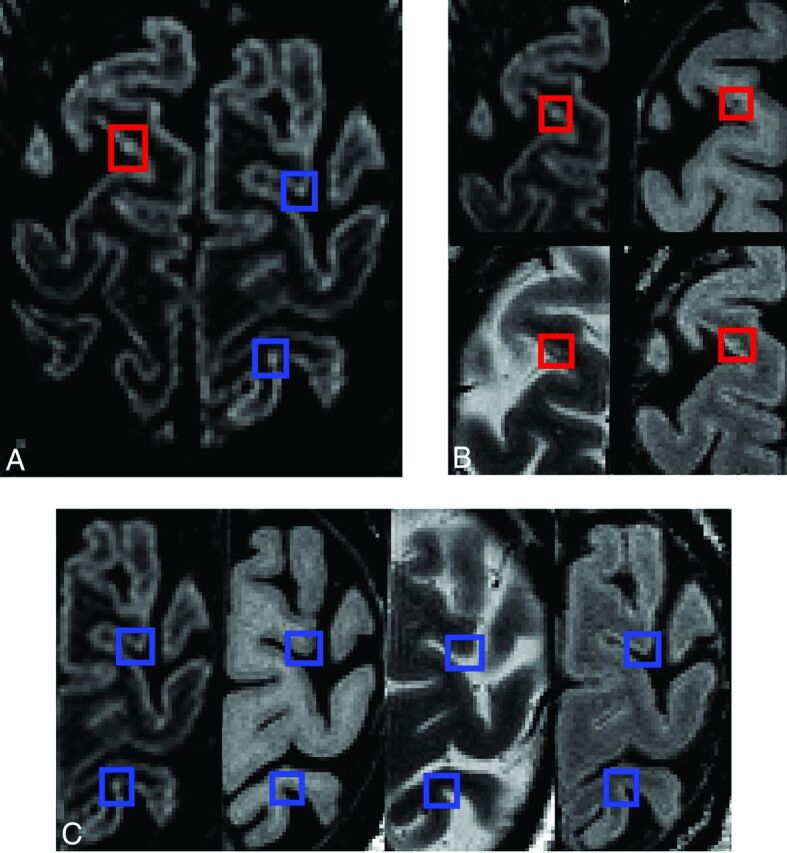
Cortical lesions visible in all sequences with demonstration of confounding artifacts (high-signal noise or potential vascular artifacts). A, DIR. B, Magnified view of DIR, T1-weighted, T2-weighted, and FLAIR: The true cortical lesion visible on all contrasts is in red boxes. C, Magnified view of DIR, T1-weighted, T2-weighted, and FLAIR: Blue boxes show hyperintense voxels visible on DIR only. Because there are no corresponding intensity changes on the other contrasts, these artifacts are clearly identifiable.
Discussion
Using 3 MR imaging reading protocols, this work has demonstrated the advantage of a multicontrast approach to segmenting CLs. Careful side-by-side comparison of CLs on different MR imaging contrasts demonstrates how some areas of the cortex may have lesions that are easily missed by using DIR alone. In particular, most of the areas of discrepancy were observed when CLs had partial involvement of both the cortex and the adjacent cerebral white matter. This problem has also been identified by other groups10,13,18,23,24 that demonstrated that different kinds of high-resolution T1-weighted images (MPRAGE, phase-sensitive inversion recovery) can aid in classifying a CL as leukocortical (hence true-positive) or purely juxtacortical (hence false-positive).
Some CLs not identified by using P3 were related to a lack of clear hyperintense signal in CL voxels on DIR. The use of other contrasts to segment these cases is beneficial. For example in Fig 3, a more clearly visible CL, hyperintense on FLAIR and hypointense on T1, was identified, though DIR showed an ambiguous hyperintensity in relation to the surrounding cortex. Additionally, some areas not identified as CL by using P3 might be related to a tendency to be conservative when one uses DIR alone, treating focal small hyperintensities as possible vascular artifacts or cortical signal heterogeneity, hence not being segmented and counted as CLs.
In cortical lesion segmentation methods to date, most groups have used a single imaging contrast.10,11,16,17,19,25 A systematic comparison of the spatial correspondence of lesions obtained from different MR imaging contrasts has not been performed, to our knowledge. We have addressed this issue in 2 ways: 1) by using software that overlaps the masks created by using different segmentation protocols, and 2) by careful side-by-side comparison of the different image contrasts registered to the T1-weighted image space. These methods allowed us to assess areas that were consistently rated as CLs in all 3 protocols. They also provided more information about which areas were marked as lesions in one protocol but not in another.
Our results (On-line Table) suggest that DIR alone detects a lower number of lesions compared with protocols P1 and P2. However, if we considered the areas common to all 3 protocols, the rater consistently scored the same 75%–76% of lesions. When spatially overlapping the lesions labeled on P1 and P2, we see that 75% of lesions counted in P1 were also labeled as lesions in P2 and that 76% of the total lesions labeled in P2 were labeled as lesions in P1. Additionally, 76.4% of all lesions labeled by P3 colocalized with lesions obtained by both P1 and P2. This colocalization of 76.4% shows that P3 (DIR alone) does detect what is considered CL by using additional MR imaging contrasts, which implies good specificity, but with a lower frequency, which implies a lower sensitivity than the multiprotocol approaches. This is likely due to lower rater confidence in equivocal lesion candidates when observed on DIR alone.
In the absence of a formal mathematic calculation of sensitivity and specificity (due to the lack of histologic or 7T gold standard counts for these data), the overlapping of the areas assessed could be considered indirect evidence of the lower sensitivity of DIR when used independent of other contrasts. This consideration is important when deciding on sample sizes in any given study.
We acknowledge that our in vivo study does not have a true gold standard due to the absence of either brain tissue biopsy samples or concomitant ultra-high-field MR images. Our main aim was to compare the CL segmentation performed with DIR with 2 multimodal techniques. The segmentation performed by using all available MR imaging contrasts, including DIR, was taken as the reference. Our motivation to do this study was that the consensus recommendations for MS cortical lesion scoring suggest that the use of DIR alone is sufficient, while the addition of other MR imaging contrasts is merely helpful.11 Our results showed that the multimodal protocols were significantly more sensitive than the use of DIR by itself. The visual characteristics (intensity, shape, and location) of the additional lesions detected with the multimodal reading protocols were comparable with those of the lesions detected by using DIR alone. The main difference was that these additional lesions were nearly isointense with surrounding cortical gray matter and were therefore difficult to ascertain as lesions with confidence (due to cortical signal heterogeneity typical of DIR11) without supporting information from other sequences.
The similarity of our results by using P1 and P2 suggests that within a multimodal MS protocol with sufficient resolution, 3D FLAIR appears to be as useful as DIR in the visual assessment of cortical lesions. Although a prior postmortem study showed the superior sensitivity of 3D DIR to 3D FLAIR at 3T when used alone, that study used a matched resolution for 3D DIR and 3D FLAIR.19 Scan times were not reported, but to achieve the same resolution with adequate SNR, the 3D DIR likely had a much longer scan time than the 3D FLAIR, which would limit the feasibility for an in vivo multicontrast protocol. In another study from the same group, but at 7T,17 the sensitivity of 3D FLAIR to cortical lesions was shown to be superior to that of 3D DIR. In addition to the effect of field strength, the authors concluded that the higher resolution of the 3D FLAIR contributed to its superior sensitivity. Because DIR is not available as a product sequence on many platforms, but only as a “works-in-progress” sequence available to academic sites with research agreements, the use of high-resolution (1-mm isotropic or better) 3D FLAIR and MPRAGE within a multimodal protocol could allow more centers to score cortical lesions routinely.
Our observation of an increased yield of cortical lesions by using a multicontrast reading protocol has clear relevance to MR imaging research studies looking at the relationship of cortical lesions to, for example, cognition or disease progression. In addition, the ability to detect cortical lesions on clinical scans may become increasingly important because future diagnostic criteria for MS are likely to include the presence of cortical lesions as a radiologic feature supportive of a diagnosis of MS.26 As such, clinicians may want to consider including these isotropic acquisitions as part of their standard MS protocols. An accelerated 1-mm isotropic T1-weighted MPRAGE sequence could be acquired in about 5 minutes, while 3D FLAIR, though on the order of 7–8 minutes, can be reformatted in multiple planes at any desired thickness and thus could replace the standard set of sagittal and axial FLAIR images typically used to assess white matter lesions.
Future work should assess the prevalence of false-negative and false-positive counts obtained with combinations of different contrasts, with reference to either 7T MR imaging or histology. However, histologic examination of MS tissue samples is usually performed with cases of late-stage disease,2,4,5,20,27 which do not necessarily represent the in vivo characteristics of cortical MS tissue. An alternative approach would be to focus on the simultaneous use of 7T MR imaging and 3T multicontrast MR imaging for validation of proposed 3T MR imaging CL segmentation protocols.
Conclusions
A multicontrast approach to CL segmentation has been presented. The first 2 multicontrast reading protocols (P1 and P2) detected a higher number of lesions compared with DIR alone (P3), providing preliminary evidence that the incorporation of multiple contrasts for CL segmentation facilitates CL detection at the clinically accessible field strength of 3T. Most important, P1 and P2 use MR imaging contrasts that are generally available on most scanners at clinical field strengths of 1.5T and 3T. Consequently, these reading protocols are amenable to use in large-scale clinical trials of MS disease-modifying therapies, where the availability of DIR may be limited.
Supplementary Material
ABBREVIATIONS:
- DIR
double inversion recovery
- CL
cortical lesion
- ICC
intraclass correlation coefficient
- PD
proton-density
- P1
protocol 1
- P2
protocol 2
- P3
protocol 3
Footnotes
Disclosures: Josefina Maranzano—RELATED: Grant: Canadian Institutes of Health Research (CIHR, MOP 84367)*; UNRELATED: Employment: I worked at NeuroRx Research between January 2005 and June 2014. David A. Rudko—RELATED: Grant: Canadian Institutes of Health Research*; UNRELATED: Grants/Grants Pending: Canadian Institutes of Health Research.* Douglas L. Arnold—RELATED: Grant: Canadian Institutes of Health Research*; UNRELATED: Consultancy: Acorda, Biogen, Hoffman-La Roche, MedImmune, Mitsubishi, Novartis, Receptos, Sanofi-Aventis; Grants/Grants Pending: Biogen, Novartis; Other: equity interest in NeuroRx Research. Sridar Narayanan—RELATED: Grant: Canadian Institutes of Health Research,* Comments: I was a coapplicant on the grant application by the Principal Investigator Douglas L. Arnold, who is also a coauthor of this article; UNRELATED: Consultancy: NeuroRx Research; Payment for Lectures (including service on Speakers Bureaus): Novartis Canada, Comments: educational lecture unrelated to any Novartis product. *Money paid to the institution.
References
- 1. Gray E, Thomas TL, Betmouni S, et al. Elevated activity and microglial expression of myeloperoxidase in demyelinated cerebral cortex in multiple sclerosis. Brain Pathol 2008;18:86–95 10.1111/j.1750-3639.2007.00110.x [DOI] [PMC free article] [PubMed] [Google Scholar]
- 2. Wegner C, Esiri MM, Chance SA, et al. Neocortical neuronal, synaptic, and glial loss in multiple sclerosis. Neurology 2006;67:960–67 10.1212/01.wnl.0000237551.26858.39 [DOI] [PubMed] [Google Scholar]
- 3. Bø L, Vedeler CA, Nyland H, et al. Intracortical multiple sclerosis lesions are not associated with increased lymphocyte infiltration. Mult Scler 2003;9:323–31 10.1191/1352458503ms917oa [DOI] [PubMed] [Google Scholar]
- 4. Peterson JW, Bö L, Mörk S, et al. Transected neurites, apoptotic neurons, and reduced inflammation in cortical multiple sclerosis lesions. Ann Neurol 2001;50:389–400 10.1002/ana.1123 [DOI] [PubMed] [Google Scholar]
- 5. Kidd D, Barkhof F, McConnell R, et al. Cortical lesions in multiple sclerosis. Brain 1999;122(pt 1):17–26 10.1093/brain/122.1.17 [DOI] [PubMed] [Google Scholar]
- 6. Lucchinetti CF, Popescu BF, Bunyan RF, et al. Inflammatory cortical demyelination in early multiple sclerosis. N Engl J Med 2011;365:2188–97 10.1056/NEJMoa1100648 [DOI] [PMC free article] [PubMed] [Google Scholar]
- 7. Chard D. Cortical lesion counts by double inversion recovery should be part of the MRI monitoring process for all MS patients: no. Mult Scler 2014;20:539–40 10.1177/1352458514526946 [DOI] [PubMed] [Google Scholar]
- 8. Rovira A, Auger C. Cortical lesion counts by double inversion recovery should be part of the MRI monitoring process for all MS patients: commentary. Mult Scler 2014;20:541–42 10.1177/1352458514529174 [DOI] [PubMed] [Google Scholar]
- 9. Calabrese M, De Stefano N. Cortical lesion counts by double inversion recovery should be part of the MRI monitoring process for all MS patients: yes. Mult Scler 2014;20:537–38 10.1177/1352458514526084 [DOI] [PubMed] [Google Scholar]
- 10. Sethi V, Muhlert N, Ron M, et al. MS cortical lesions on DIR: not quite what they seem? PLoS One 2013;8:e78879 10.1371/journal.pone.0078879 [DOI] [PMC free article] [PubMed] [Google Scholar]
- 11. Geurts JJ, Roosendaal SD, Calabrese M, et al. ; MAGNIMS Study Group. Consensus recommendations for MS cortical lesion scoring using double inversion recovery MRI. Neurology 2011;76:418–24 10.1212/WNL.0b013e31820a0cc4 [DOI] [PubMed] [Google Scholar]
- 12. Simon B, Schmidt S, Lukas C, et al. Improved in vivo detection of cortical lesions in multiple sclerosis using double inversion recovery MR imaging at 3 Tesla. Eur Radiol 2010;20:1675–83 10.1007/s00330-009-1705-y [DOI] [PMC free article] [PubMed] [Google Scholar]
- 13. Tallantyre EC, Morgan PS, Dixon JE, et al. 3 Tesla and 7 Tesla MRI of multiple sclerosis cortical lesions. J Magn Reson Imaging 2010;32:971–77 10.1002/jmri.22115 [DOI] [PubMed] [Google Scholar]
- 14. Geurts JJ, Pouwels PJ, Uitdehaag BM, et al. Intracortical lesions in multiple sclerosis: improved detection with 3D double inversion-recovery MR imaging. Radiology 2005;236:254–60 10.1148/radiol.2361040450 [DOI] [PubMed] [Google Scholar]
- 15. Mistry N, Abdel-Fahim R, Mougin O, et al. Cortical lesion load correlates with diffuse injury of multiple sclerosis normal appearing white matter. Mult Scler 2014;20:227–33 10.1177/1352458513496344 [DOI] [PubMed] [Google Scholar]
- 16. Papadopoulou A, Muller-Lenke N, Naegelin Y, et al. Contribution of cortical and white matter lesions to cognitive impairment in multiple sclerosis. Mult Scler 2013;19:1290–96 10.1177/1352458513475490 [DOI] [PubMed] [Google Scholar]
- 17. Kilsdonk ID, de Graaf WL, Soriano AL, et al. Multicontrast MR imaging at 7T in multiple sclerosis: highest lesion detection in cortical gray matter with 3D-FLAIR. AJNR Am J Neuroradiol 2013;34:791–96 10.3174/ajnr.A3289 [DOI] [PMC free article] [PubMed] [Google Scholar]
- 18. Nielsen AS, Kinkel RP, Tinelli E, et al. Focal cortical lesion detection in multiple sclerosis: 3 Tesla DIR versus 7 Tesla FLASH-T2. J Magn Reson Imaging 2012;35:537–42 10.1002/jmri.22847 [DOI] [PMC free article] [PubMed] [Google Scholar]
- 19. Seewann A, Kooi EJ, Roosendaal SD, et al. Postmortem verification of MS cortical lesion detection with 3D DIR. Neurology 2012;78:302–08 10.1212/WNL.0b013e31824528a0 [DOI] [PubMed] [Google Scholar]
- 20. Geurts JJ, Bö L, Pouwels PJ, et al. Cortical lesions in multiple sclerosis: combined postmortem MR imaging and histopathology. AJNR Am J Neuroradiol 2005;26:572–77 [PMC free article] [PubMed] [Google Scholar]
- 21. Bø L, Vedeler CA, Nyland HI, et al. Subpial demyelination in the cerebral cortex of multiple sclerosis patients. J Neuropathol Exp Neurol 2003;62:723–32 10.1093/jnen/62.7.723 [DOI] [PubMed] [Google Scholar]
- 22. Sled JG, Zijdenbos AP, Evans AC. A nonparametric method for automatic correction of intensity nonuniformity in MRI data. IEEE Trans Med Imaging 1998;17:87–97 10.1109/42.668698 [DOI] [PubMed] [Google Scholar]
- 23. Moraal B, Roosendaal SD, Pouwels PJ, et al. Multi-contrast, isotropic, single-slab 3D MR imaging in multiple sclerosis. Eur Radiol 2008;18:2311–20 10.1007/s00330-008-1009-7 [DOI] [PubMed] [Google Scholar]
- 24. Nelson F, Poonawalla A, Hou P, et al. 3D MPRAGE improves classification of cortical lesions in multiple sclerosis. Mult Scler 2008;14:1214–19 10.1177/1352458508094644 [DOI] [PMC free article] [PubMed] [Google Scholar]
- 25. Calabrese M, Rocca MA, Atzori M, et al. A 3-year magnetic resonance imaging study of cortical lesions in relapse-onset multiple sclerosis. Ann Neurol 2010;67:376–83 10.1002/ana.21906 [DOI] [PubMed] [Google Scholar]
- 26. Filippi M, Rocca MA, Calabrese M, et al. Intracortical lesions: relevance for new MRI diagnostic criteria for multiple sclerosis. Neurology 2010;75:1988–94 10.1212/WNL.0b013e3181ff96f6 [DOI] [PubMed] [Google Scholar]
- 27. Gray E, Thomas TL, Betmouni S, et al. Elevated myeloperoxidase activity in white matter in multiple sclerosis. Neurosci Lett 2008;444:195–98 10.1016/j.neulet.2008.08.035 [DOI] [PubMed] [Google Scholar]
Associated Data
This section collects any data citations, data availability statements, or supplementary materials included in this article.