Abstract
Photoacoustic imaging is a promising technique to provide guidance during multiple surgeries and procedures. One challenge with this technique is that major blood vessels in the liver are difficult to differentiate from surrounding tissue within current safety limits, which only exist for human skin and eyes. In this paper, we investigate the safety of raising this limit for liver tissue excited with a 750 nm laser wavelength and approximately 30 mJ laser energy (corresponding to approximately 150 mJ/cm2 fluence). Laparotomies were performed on six swine to empirically investigate potential laser-related liver damage. Laser energy was applied for temporal durations of 1 minute, 10 minutes, and 20 minutes. Lasered liver lobes were excised either immediately after laser application (3 swine) or six weeks after surgery (3 swine). Cell damage was assessed using liver damage blood biomarkers and histopathology analyses of 41 tissue samples total. The biomarkers were generally normal over a 6 week post-surgical in vivo study period. Histopathology revealed no cell death, although additional pathology was present (i.e., hemorrhage, inflammation, fibrosis) due to handling, sample resection, and fibrous adhesions as a result of the laparotomy. These results support a new protocol for studying laser-related liver damage, indicating the potential to raise the safety limit for liver photoacoustic imaging to approximately 150 mJ/cm2 with a laser wavelength of 750 nm and for imaging durations up to 10 minutes without causing cell death. This investigation and protocol may be applied to other tissues and extended to additional wavelengths and energies, which is overall promising for introducing new tissue-specific laser safety limits for photoacoustic-guided surgery.
1. Introduction
Photoacoustic imaging is typically implemented with a laser that irradiates biological structures of interest, resulting in a temperature rise that causes thermal expansion and a subsequent acoustic pressure wave that is sensed by an ultrasound probe [1–4]. This imaging approach was successfully demonstrated for a wide range of clinical applications including brain functional imaging [5–7], breast cancer detection [8–10], skin lesion diagnosis [11–13], and tumor therapy guidance [14–16]. Photoacoustic imaging has additional potential to guide a range of surgeries and procedures, including biopsy [17,18], interventional discrimination of nerves and tendons [19], spinal fusion surgery [20,21], liver surgeries [22], cardiac catheter-based interventions [23], hysterectomies [24], endonasal transsphenoidal surgeries [25–27], fetal surgeries [28], and robotic surgeries [25].
Laser safety is one of the most important biohazard considerations for photoacoustic imaging. Currently, the American National Standards Institute (ANSI) limits the maximum permissible exposure (i.e., pulse energy per unit area) to 20-100 mJ/cm2 for laser wavelengths ranging 400-1500 nm [29]. However, one limitation for the wide variety of possible photoacoustic applications is the absence of tissue-specific laser safety limits [30]. Safety limits are currently only defined for skin and retinal tissue, and the community generally uses these guidelines to develop safety protocols for other tissues. While the extrapolation of this guideline is typically not a problem, there are some interventional photoacoustic applications that would be regarded as unsafe (i.e., above the safety limit for skin) when operating under this extrapolation. For example, imaging of deep-seated targets (including targets such as the bladder [31], prostate brachytherapy seeds [14–16], and major blood vessels in the liver [22]) results in increased fluence attenuation, increased optical scattering, and decreased photoacoustic signal-to-noise ratios [1,31]. Therefore, the expansive potential for surgical and interventional guidance with photoacoustic imaging remains challenging under the current safety limits.
In this paper, we present an empirical methodology to assess laser-related tissue damage and offer the opportunity for increased energy limits to improve photoacoustic image contrast. We focus on liver surgical guidance, following previous work from our research group. Specifically, Kempski et al. [22] conducted the first known in vivo interventional photoacoustic liver imaging study and demonstrated an energy requirement of 30 mJ (which corresponds to a fluence of 152.6 mJ/cm2) with 750 nm wavelength. These requirements were chosen because they were previously shown to sufficiently differentiate between the focused photoacoustic signal originating from a major blood vessel in the imaging plane and the more diffuse photoacoustic signals originating from background liver tissue [22]. However, these requirements exceed the ANSI safety limit of 25.2 mJ/cm2 for skin at 750 nm wavelength. This energy was required to visualize and distinguish major blood vessels in the liver with sufficient contrast and characteristic features. Over an imaging duration of 40 minutes, with energies ranging from 20 to 40 mJ, significant liver damage (i.e., necrosis and hemorrhaging) was observed after a histopathological analysis of the imaged tissue. Considering that this was an exploratory study with time durations and laser energies that exceeded expected technological requirements, the level of tissue damage could be mitigated and possibly eliminated under more constrained time durations and laser energy conditions that are representative of an actual surgical guidance scenario. Therefore, the purpose this paper is to provide quantitative and qualitative assessments of the effects of approximately 30 mJ laser energy applied to in vivo liver tissue for temporal durations ranging 1-20 minutes. Results are based on biomarkers and histopathological analyses. A swine animal model was utilized for this empirical study, considering the similarity of optical and thermal liver properties to those of human livers [22].
The remainder of this paper is organized as follows. Section 2 describes Monte Carlo simulation methods to support our motivation, empirical and surgical procedures, and tissue processing techniques. Section 3 presents laser fluence profiles from the Monte Carlo simulations, results from biomarker analyses, and cell damage profiles from histopathology analyses. Section 4 discusses our findings and their implications for photoacoustic guidance of liver surgeries, and Section 5 summarizes our final conclusions.
2. Methods
2.1. Simulated skin and liver fluence profiles
To demonstrate differences in light propagation through skin and liver tissues and justify establishing different laser safety limits for these unique tissues, 3D Monte Carlo simulations [32] were performed with optical properties summarized in Table 1. The Monte Carlo simulations were conducted with a 1 cm 1 cm 1 cm cubic voxel of either human skin, human liver, or swine liver tissue with a resolution cell of 100 m in each dimension. Light was propagated from a 5 mm-diameter fiber bundle with 750 nm wavelength placed at the center of the cube on one surface. A 2D slice parallel to the light propagation direction was taken at the center of the cubic voxel to view the laser fluence profile at this cross section where fluence is expected to be the greatest. The run time for each simulation was 10 minutes. The flunce was quantified within a tissue depth up to 0.2 cm within this selected plane to assess relative fluence differences.
Table 1. Optical properties modeled with Monte Carlo simulations.
2.2. Empirical assessment of in vivo livers exposed to laser energy
The following studies were approved by the Johns Hopkins University Institutional Animal Care and Use Committee. Six female Yorkshire swine (26.4-40.4 kg) were subject to a combination of survival and non-survival laparotomies. During each laparotomy, the swine was anesthetized and subsequently intubated to provide gas anesthesia throughout the surgery. A midline incision exposed the abdominal organs. Table 2 summarizes the laser application duration and number of planned laser application sites per swine. Specifically, Swine 1-3 each underwent one non-survival laparotomy, while Swine 4-6 each underwent one survival laparotomy followed by a non-survival laparotomy after a 6-week recovery period.
Table 2. Summary of laser application duration per experimental site and the intended number of sites (with one site defined as one location on a liver lobe) for the non-survival surgeries (Swine 1-3) and the survival surgeries, followed by non-survival surgeries after 6 weeks of recovery (Swine 4-6).
| Laser Duration per Site | Number of Sites | Recovery Period | |
|---|---|---|---|
| Non-Survival (Swine 1-3) | 20 min | 2 | No Recovery |
| 10 min | 2 | ||
| 1 min | 2 | ||
| Survival (Swine 4-6) | 10 min | 4 | 6 Weeks |
| 1 min | 2 | ||
Laser energy was applied to the surface of multiple liver lobes during the non-survival laparotomies performed on Swine 1-3 and the survival laparotomies performed on Swine 4-6. The applied laser energy per pulse was maintained at approximately 30 mJ, based on previous reports of energy requirements for useful photoacoustic signal visualization [22]. A 5 mm-diameter fiber bundle was connected to a Phocus Mobile laser (Opotek, Carlsbad, CA, USA) to deliver this output energy with a 5 ns pulse width and 10 Hz repetition rate. The laser duration was either 1 minute, 10 minutes, or 20 minutes, as reported in Table 2, following our expectations for possible imaging time durations during surgical guidance. The beam profile was expected to be a top hat geometry, but a qualitative post-study analysis of the beam geometry indicated that there was potentially at least one hot spot within the beam geometry.
Due to changes in the system operating temperature, the laser output energy varies over time. In order to monitor and compensate for these fluctuations in energy, a custom command-line interface was employed to adjust and record laser energies in real-time. Specifically, calibration between the internal power meter and an external power meter was performed prior to the start of the procedure, and the internal power meter was used throughout the duration of the study to adjust and record laser energies in real time.
The recovery periods for the six swine were chosen based on prior work [22,36]. In particular, Swine 1-3 were euthanized immediately after laser application, and the lasered liver tissues were resected for histopathological analysis. These experiments were conducted to directly compare with tissue damage results described by Kempski et al. [22], which were obtained immediately after photoacoustic imaging during surgery. Swine 4-6 underwent a six-week recovery period, which was chosen in order to observe possible liver regeneration from thermal damage, with consideration that Bosman et al. [36] reported swine liver regeneration and recovery from thermal damage after four weeks. The non-survival laparotomy was performed on these swine after the recovery period in order to resect lasered liver lobes for evaluation. Blood from Swine 4-6 was drawn bi-weekly to assess inflammation biomarkers for severe liver damage throughout recovery. These chronicity studies for Swine 4-6 were designed to determine possible longer-term effects of healing (or damage) from laser application.
2.3. Tissue marking and resection strategies
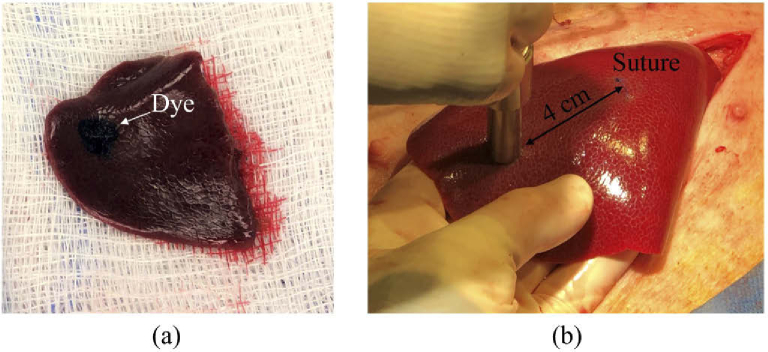
The lasered locations within Swine 1-3 were marked with histology tissue marking dye (Richard-Allen Scientific, San Diego, CA), immediately after laser application and tissue resection, as shown in Fig. 1(a). For Swine 4-6, a bio-compatible tissue marking strategy was required to ensure that the lasered locations could be identified after six weeks, which precluded the use of tissue dye and instead required anatomical landmarks. Therefore, a line of suture was placed to act as a reference landmark on each liver lobe. The laser location was then measured to be a perpendicular distance ranging 3-4 cm from the sutured line to ensure the laser application site was free from inflammation due to suturing. The specific distance for each lobe was recorded at the time of laser application. An example of the suture and laser tip placement is shown in Fig. 1(b). After euthanization of Swine 4-6, the entire liver was removed from the abdominal cavity and the laser sites were marked with tissue dye using the reference landmarks identified in the first laparotomy. At the conclusion of the non-survival surgery for each of the six swine, a control tissue sample was resected from a liver lobe that was not lasered.
Fig. 1.
Demonstration of the marking strategies implemented for (a) non-survival and (b) survival swine. For non-survival swine, tissue dye was directly applied to the resected liver immediately after each laser application. For survival swine, the laser location was marked by measuring a specific distance (e.g., 3-4 cm) from a suture placed during the first laparotomy.
2.4. Liver damage assessments
2.4.1. Biomarkers
Six biomarkers were measured from the blood samples: (1) albumin to globulin ratio (A/G ratio); (2) alanine aminotransferase (ALT); (3) aspartate aminotransferase (AST); (4) alkaline phosphatase (ALP); (5) gamma-glutamyl transferase (GGT); and (6) lactate dehydrogenenase (LDH). The A/G ratio represents an overall protein level that decreases in conditions that interfere with protein production (e.g., severe liver damage) [37]. ALT is an enzyme found mostly within hepatocytes that increases with liver damage [38]. AST is an enzyme found within hepatocytes (i.e., liver cells) that increases with liver or skeletal muscle injury [39]. ALP is an enzyme that increases in conditions of liver disease or bone disorders [40]. GGT is an enzyme that is elevated in the presence of diseases that cause damage to the liver or bile ducts [41]. LDH is an enzyme with increased levels caused by a wide variety of conditions including acute liver disease [42]. Normal ranges for these biomarkers are summarized in Table 3.
Table 3. Liver Injury Biomarkers Normal Ranges for Domestic Swine.
2.4.2. Histopathalogy analysis
The presence of hemorrhage, inflammation, fibrosis, and necrosis was qualitatively assessed by haematoxylin and eosin (H&E) staining to determine the local effect of laser application on the liver tissue defined as absent, minimal, mild, moderate, or severe. Necrosis was defined by loss of hepatocellular integrity with nuclear loss or pyknosis and disruption of cell membranes. Hemorrhage was defined as extravasation of red blood cells into perivascular tissues. Inflammation consisted of aggregates of neutrophils and/or lymphocytes and macrophages within tissue. Fibrosis is attributed to the excess deposition of extracellular matrix components including collagen [45]. All histopathology analyses were performed by co-author S.B., a board-certified veterinary pathologist.
3. Results
3.1. Simulation-based skin and liver laser damage assessments
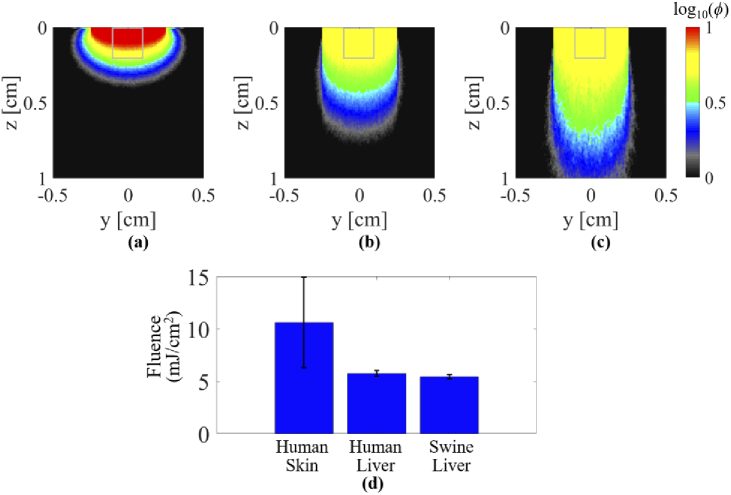
Figures 2(a-c) show Monte Carlo simulation results for human skin, human liver, and swine liver tissues, from left to right, respectively, for a 1-cm tissue depth. To quantify and compare subsurface locations that were representative of areas with the largest fluence, the mean and standard deviation of fluence within the outlined regions (i.e., within 2 mm from the tissue surface) were computed, as shown in Fig. 2(d). The skin tissue had higher fluence levels when compared to the human liver tissue and swine liver tissue. These distinct fluence profiles indicate substantial differences in laser interaction between skin and liver tissues, motivating further empirical assessments of liver-specific laser damage.
Fig. 2.
Simulated fluence profiles for (a) human skin tissue, (b) human liver tissue, (c) swine liver tissue. (d) Mean one standard deviation of fluence measured within the regions of interest outlined on each simulated profile result.
3.2. Fluctuations in applied laser energy
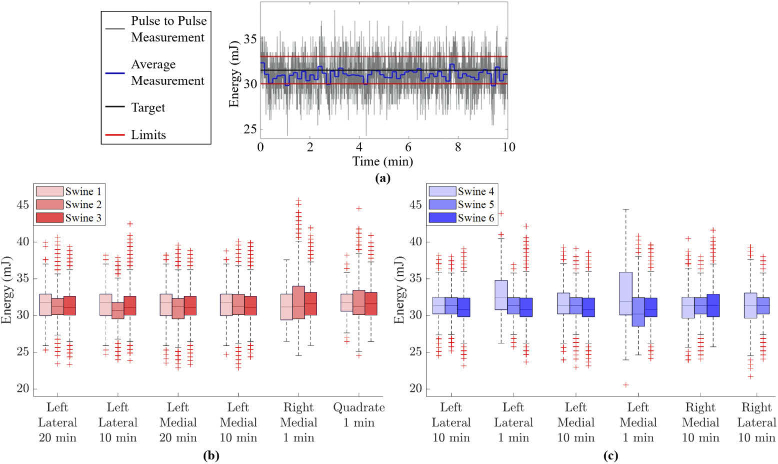
Figure 3 demonstrates the minimal fluctuations in laser energy observed throughout each experiment. Specifically, Fig. 3(a) shows one example of the energy as a function of time during the 10 minute laser application for Swine 1. Figure 3(a) includes the pulse-to-pulse measurements, the sliding-average over 50 pulses, the mean energy, and the allowable tolerance on the mean energy. Figures 3(b) and 3(c) show a summary of the consistent energy levels applied to the liver lobes for each laser application for non-survival and survival swine, respectively. The box-and-whisker plots show the median (horizontal line) and the upper and lower quartiles of the energy at each laser site (upper and lower edges of each box). The interquartile ranges varied from 2.2 mJ to 5.8 mJ, demonstrating minimal variations in laser energy application, despite the lengthy application durations, which would otherwise suffer from energy drift without the energy compensation methods described in Section 2.2.
Fig. 3.
(a) Example of laser energy fluctuation during a 10-minute laser application for Swine 1, showing the pulse-to-pulse measurements, the sliding-average over 50 pulses, the mean energy, and the allowable tolerance on the mean energy. Summary of energies applied to each laser site within (b) non-survival, and (c) survival swine. Note that Swine 6 did not have an accessible right lateral lobe.
3.3. Blood biomarker analysis
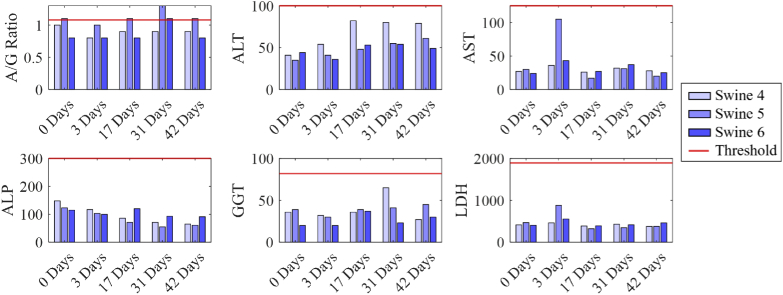
Figure 4 shows the biomarker results over six weeks of blood draws for Swine 4-6. The measured biomarker levels for Swine 4-6 were within the normal ranges, with the exception of the A/G ratio for Swine 5, which exceeded the threshold on day 31. However, the A/G ratio for Swine 5 returned to the threshold level by the day 42 blood draw.
Fig. 4.
Biomarker results with the upper bounds of normal ranges indicated by the horizontal line.
3.4. Histopathology results
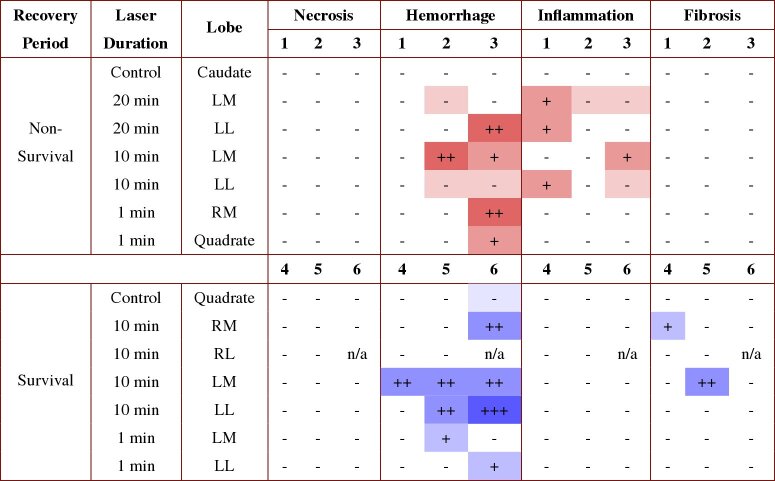
Table 4 summarizes the histopathology findings for lasered and control regions from each swine. The rows denote the different liver lobes evaluated for each swine and the columns denote histology results, ordered by swine number. No swine experienced tissue necrosis, which is considered to be most indicative of laser-related tissue damage. Swine 1 experienced mild inflammation on the left medial lobe exposed to 20 minute laser duration and on isolated regions of the left lateral lobe exposed to 10 and 20 min laser durations (i.e., 3 out of 6 laser application sites total). Otherwise, there were no significant findings in the histopathology results for this swine. Swine 2 and 3 experienced minimal to moderate hemorrhage on 8 out of 12 laser application sites and minimal to mild inflammation on 6 out of 12 laser application sites, as indicated in Table 4. Although Swine 4-6 experienced no tissue necrosis, these swine exhibited other pathology, including acute hemorrhage varying from minimal to moderate (7 out of 17 sites total), with one additional control site in Swine 6 showing minimal hemorrhage and one laser site in Swine 6 showing severe hemorrhage. The severity of the hemorrhage was uncorrelated with laser duration time. In addition, fibrosis was present on 2 out of 35 laser sites across Swine 1-6 combined. The implications of these results are discussed in Section 4.
Table 4. Summary of hemorrhage, inflammation, and necrosis observed after the histopathological analysis of lasered and control tissues. LM = left medial, LL = left lateral, RM = right medial, RL = right lateral. Pathology is indicated as absent (-), minimal (shaded -), mild (+), moderate (++), or severe (+++). Note that the RL lobe of Swine 6 was inaccessible, and corresponding results are therefore reported as n/a.
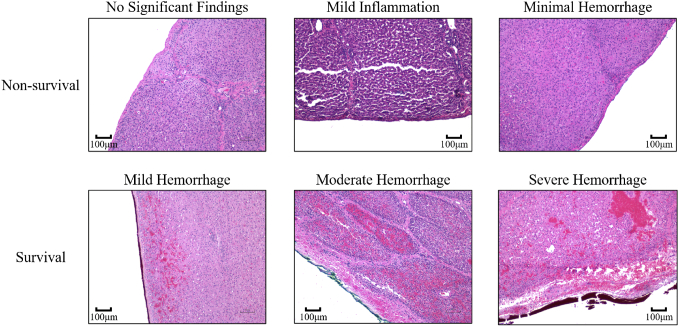
Figure 5 shows example histopathology results after H&E staining at 10x magnification for multiple levels of the pathology described in Table 4. One example slide was taken from each swine. The top row of Fig. 5 shows no significant findings (Swine 2), mild inflammation (Swine 1), and minimal hemorrhage (Swine 3), from left to right, respectively. The bottom row shows mild hemorrhage (Swine 5), moderate hemorrhage (Swine 4), and severe hemorrhage (Swine 6), from left to right, respectively.
Fig. 5.
Sample H&E slides showing varying levels of inflammation and hemorrhage. The images in the top row were taken from the Swine 2 (right medial, 1 min), Swine 1 (left medial, 20 min), and Swine 3 (left lateral, 10 min), from left to right, respectively. The images in the bottom row were taken from Swine 5 (left medial, 1 min), Swine 4 (left medial, 10 min), and Swine 6 (left lateral, 10 min), from left to right, respectively.
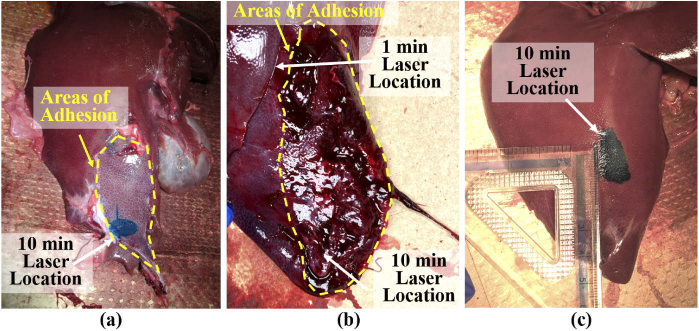
Figures 6(a) and 6(b) show example areas of post-surgical fibrous adhesions on the right medial and left lateral lobes of Swine 4 and Swine 6, respectively, as indicated by the outlined regions. The fibrotic tissue coincides with the laser sites in Figs. 6(a) and 6(b). The extensive fibrous adhesions between the abdominal wall and the left lateral lobe resulted in tearing of the tissue when the liver was resected from the abdomen, as shown in Fig. 6(b). This site of fibrous adhesions and tearing was associated with the 10 minute laser application site that showed severe hemorrhage in Table 4. For comparison, Fig. 6(c) shows the right lateral lobe without any fibrous adhesions.
Fig. 6.
Liver surfaces after resection of (a) the right medial lobe of Swine 4 (shown with tissue dye applied), and (b) the left lateral lobe of Swine 6, which contained fibrous adhesions attached to the lower half of the lobes as indicated by the yellow outlined regions. (c) The right lateral lobe of Swine 4 (after the application of tissue dye) is shown for comparison, representing a liver lobe surface with no fibrous adhesions.
4. Discussion
This paper presents the first known quantitative and qualitative analyses of the effect of laser energy applied to in vivo liver tissue. The associated results demonstrate the need for tissue-specific laser safety limits under temporal and energy requirements that are of interest for photoacoustic-guided liver surgeries. Across six swine studied for these analyses, laser-related damage was considered absent, as indicated by the lack of tissue necrosis findings after laser application, which is also supported by the totality of the biomarker results. The hemorrhage and inflammation reported in Table 4 are attributed to the resection methodology and fibrous adhesions commonly found after surgery, as discussed in more detail below.
Considering that the swine liver is expected to regenerate after four weeks [36], one goal of our studies was to determine whether possible laser-related tissue damage would recover over time by comparing results from Swine 1-3 (which had no recovery period) to results from Swine 4-6 (which had a 6-week recovery period). The minimal to moderate hemorrhage observed during the histopathological analysis of Swine 1-3 was likely caused by resecting the tissue while the animals were alive, as excessive bleeding was observed intraoperatively. Similarly, the minimal to severe hemorrhage observed in the histopathological analysis of Swine 4-6 was likely caused by separating the liver from the abdominal wall, as these two structures were connected by the fibrous adhesions commonly caused by open abdominal surgeries. In addition, the sub-capsular hemorrhage observed in Swine 4-6 was acute, and hemorrhage was present on the control region of Swine 6, although no laser was applied. Therefore, we further suspect that the hemorrhage was associated with the multifocal fibrous adhesions and not directly caused by laser application. The minimal to mild inflammation reported in Table 4 is likely caused by handling during the non-survival surgeries, because this pathology was absent from the survival surgeries performed on Swine 4-6, and these survival swine were euthanized prior to tissue handling and resection.
While results from the non-survival studies (i.e., Swine 1-3 in Table 4) indicate the potential of safely using imaging durations up to 20 minutes, this time interval was not repeated for the survival studies (i.e., Swine 4-6) in order to focus the limited time and resources available for the recovery studies on the shorter laser application durations (i.e., 1 minute and 10 minutes). Sustained damage after 6 weeks under these shorter temporal durations would have implied expected damage at the lengthier temporal durations. With newfound awareness of the minimal damage observed after recovery from the shorter temporal laser application durations, future work can possibly repeat the 20 minute laser application interval and allow a recovery period before assessment to determine safety.
In comparison to the previous photoacoustic-guided liver surgery study from our group [22], which showed significant tissue damage after laser application (i.e., degeneration/necrosis, inflammation, and hemorrhage), the results presented in this manuscript demonstrate that when using the minimum energy identified for photoacoustic target visualization and differentiation (i.e., 30 mJ) and with more realistic temporal durations for imaging blood vessels in the liver during surgery (i.e., 1, 10, and 20 minutes), the level of tissue pathology can be mitigated. Therefore, these results represent a new opportunity to define laser safety limits for liver tissues and support the introduction of a maximum limit that exceeds the existing limit for human skin. The potential for this new limit is additionally supported by differences in the fluence profiles between human skin and liver tissue shown in Fig. 2.
The empirical combination of Monte Carlo simulations, biomarkers, and histopathological analyses has the potential to be extended to additional tissue types, laser wavelengths, laser energies, and laser application durations to expand our understanding of appropriate laser safety limits under these multiple conditions. While laser-related damage to individual cells has been studied in the past [46,47], the presented approach to studying bulk tissue responses considers the thermal dissipation and other related effects that are not present with individual cells. Therefore, the methods we devised to assess potential laser-related tissue damage represent new protocols to study and assess tissue-specific laser safety.
While our results from 41 total liver samples from six swine indicate the potential of raising the laser safety limit in liver tissue, additional studies with larger sample sizes are likely required to support tissue specific laser safety standardization changes. In addition, the presented series of experiments has the limitation of possible uncertainty when marking the region of tissue to analyze, which was particularly challenging in the swine with a post-surgical recovery period. However, when re-identifying the lasered spot, we used anatomical landmarks, photographs, and detailed notes to mitigate potential errors. Therefore, we are confident that the correct region was analyzed. It is also possible that the fiber bundle used during our experiments contained at least one hot spot of higher fluence with respect to neighboring regions. However, the presence of a hot spot could be considered a worst-case scenario, and our results are nonetheless encouraging to support higher laser energies under this possible condition. Another possible limitation is that the histopathology results are qualitative, and quantitative assessments are ideally preferred. Hence, we included biomarkers to add a global quantitative assessment. Future work may additionally include a local quantitative assessment such as immunohistochemistry analysis.
5. Conclusion
The results of this investigation into tissue-specific laser safety provided qualitative and quantitative assessments of the effects of approximately 30 mJ laser energy applied to in vivo liver tissue for temporal durations ranging from 1 to 20 minutes. We demonstrated that liver tissue can be exposed to fluence levels above the recommended safety limits for skin with no necrosis and generally normal biomarker levels from the commencement to the culmination of a 6 week monitoring period. These results suggest that the safety limit may be raised for photoacoustic imaging in the liver. We have also achieved a novel experimental protocol for in vivo, bulk tissue, empirical evaluations of laser safety that minimizes tissue handling and reliably identifies lasered regions, which may be applied to investigate safety limits for other tissue types.
Acknowledgements
This work was supported by the Alfred P. Sloan Research Fellowship in Physics, NSF CAREER Award ECCS-1751522, and in part by NIH National Institute of General Medical Sciences T32GM007057-44. The authors thank Melanie Adams and Mary Archer for animal care and surgery support.
Funding
Alfred P. Sloan Foundation10.13039/100000879; National Science Foundation10.13039/100000001 (ECCS-175152); National Institutes of Health10.13039/100000002 (T32GM007057-44).
Disclosures
The authors declare no conflicts of interest.
References
- 1.Steinberg I., Huland D. M., Vermesh O., Frostig H. E., Tummers W. S., Gambhir S. S., “Photoacoustic clinical imaging,” Photoacoustics 14, 77–98 (2019). 10.1016/j.pacs.2019.05.001 [DOI] [PMC free article] [PubMed] [Google Scholar]
- 2.Beard T. R., Kaserman D. L., Osterkamp R., The Global Organ Shortage: Economic Causes, Human Consequences, Policy Responses, 1st ed (Stanford University Press, 2013). [Google Scholar]
- 3.Bouchard R., Sahin O., Emelianov S., “Ultrasound-guided photoacoustic imaging: current state and future development,” IEEE Trans. Ultrason. Ferroelectr. Freq. Control 61(3), 450–466 (2014). 10.1109/TUFFC.2014.2930 [DOI] [PubMed] [Google Scholar]
- 4.Xu M., Wang L. V., “Photoacoustic imaging in biomedicine,” Rev. Sci. Instrum. 77(4), 041101 (2006). 10.1063/1.2195024 [DOI] [Google Scholar]
- 5.Nie L., Guo Z., Wang L. V., “Photoacoustic tomography of monkey brain using virtual point ultrasonic transducers,” J. Biomed. Opt. 16(7), 076005 (2011). 10.1117/1.3595842 [DOI] [PMC free article] [PubMed] [Google Scholar]
- 6.Wang X., Pang Y., Ku G., Xie X., Stoica G., Wang L. V., “Noninvasive laser-induced photoacoustic tomography for structural and functional in vivo imaging of the brain,” Nat. Biotechnol. 21(7), 803–806 (2003). 10.1038/nbt839 [DOI] [PubMed] [Google Scholar]
- 7.Nasiriavanaki M., Xia J., Wan H., Bauer A. Q., Culver J. P., Wang L. V., “High-resolution photoacoustic tomography of resting-state functional connectivity in the mouse brain,” Proc. Natl. Acad. Sci. 111(1), 21–26 (2014). 10.1073/pnas.1311868111 [DOI] [PMC free article] [PubMed] [Google Scholar]
- 8.Heijblom M., Piras D., Xia W., van Hespen J. C. G., Klaase J. M., van den Engh F. M., van Leeuwen T. G., Steenbergen W., Manohar S., “Visualizing breast cancer using the twente photoacoustic mammoscope: what do we learn from twelve new patient measurements?” Opt. Express 20(11), 11582–97 (2012). 10.1364/OE.20.011582 [DOI] [PubMed] [Google Scholar]
- 9.Kruger R. A., Lam R. B., Reinecke D. R., Del Rio S. P., Doyle R. P., “Photoacoustic angiography of the breast,” Med. Phys. 37(11), 6096–6100 (2010). 10.1118/1.3497677 [DOI] [PMC free article] [PubMed] [Google Scholar]
- 10.Kolkman R. G. M., Steenbergen W., van Leeuwen T. G., “In vivo photoacoustic imaging of blood vessels with a pulsed laser diode,” Lasers Med. Sci. 21(3), 134–139 (2006). 10.1007/s10103-006-0384-z [DOI] [PubMed] [Google Scholar]
- 11.Smith L., Macneil S., “State of the art in non-invasive imaging of cutaneous melanoma,” Skin Research Technology 17(3), 257–269 (2011). 10.1111/j.1600-0846.2011.00503.x [DOI] [PubMed] [Google Scholar]
- 12.Liu M., Schmitner N., Sandrian M. G., Zabihian B., Hermann B., Salvenmoser W., Meyer D., Drexler W., “In vivo three dimensional dual wavelength photoacoustic tomography imaging of the far red fluorescent protein e2-crimson expressed in adult zebrafish,” Biomed. Opt. Express 4(10), 1846–1855 (2013). 10.1364/BOE.4.001846 [DOI] [PMC free article] [PubMed] [Google Scholar]
- 13.Zhang E. Z., Povazay B., Laufer J., Alex A., Hofer B., Pedley B., Glittenberg C., Treeby B., Cox B., Beard P., Drexler W., “Multimodal photoacoustic and optical coherence tomography scanner using an all optical detection scheme for 3D morphological skin imaging,” Biomed. Opt. Express 2(8), 2202–2215 (2011). 10.1364/BOE.2.002202 [DOI] [PMC free article] [PubMed] [Google Scholar]
- 14.Su J. L., Bouchard R. R., Karpiouk A. B., Hazle J. D., Emelianov S. Y., “Photoacoustic imaging of prostate brachytherapy seeds,” Biomed. Opt. Express 2(8), 2243–2254 (2011). 10.1364/BOE.2.002243 [DOI] [PMC free article] [PubMed] [Google Scholar]
- 15.Harrison T., Zemp R. J., “Coregistered photoacoustic-ultrasound imaging applied to brachytherapy,” J. Biomed. Opt. 16(8), 080502 (2011). 10.1117/1.3606566 [DOI] [PubMed] [Google Scholar]
- 16.Bell M. A. L., Kuo N., Song D. Y., Boctor E. M., “Short-lag spatial coherence beamforming of photoacoustic images for enhanced visualization of prostate brachytherapy seeds,” Biomed. Opt. Express 4(10), 1964–1977 (2013). 10.1364/BOE.4.001964 [DOI] [PMC free article] [PubMed] [Google Scholar]
- 17.Kim C., Erpelding T. N., Jankovic L., Wang L. V., “Performance benchmarks of an array-based hand-held photoacoustic probe adapted from a clinical ultrasound system for non-invasive sentinel lymph node imaging,” Philos. Trans. R. Soc., A 369(1955), 4644–4650 (2011). 10.1098/rsta.2010.0353 [DOI] [PMC free article] [PubMed] [Google Scholar]
- 18.Piras D., Grijsen C., Schutte P., Steenbergen W., Manohar S., “Photoacoustic needle: minimally invasive guidance to biopsy,” J. Biomed. Opt. 18(7), 070502 (2013). 10.1117/1.JBO.18.7.070502 [DOI] [PubMed] [Google Scholar]
- 19.Mari J. M., Xia W., West S. J., Desjardins A. E., “Interventional multispectral photoacoustic imaging with a clinical ultrasound probe for discriminating nerves and tendons: an ex vivo pilot study,” J. Biomed. Opt. 20(11), 110503 (2015). 10.1117/1.JBO.20.11.110503 [DOI] [PMC free article] [PubMed] [Google Scholar]
- 20.Shubert J., Bell M. A. L., “Photoacoustic imaging of a human vertebra: implications for guiding spinal fusion surgeries,” Phys. Med. Biol. 63(14), 144001 (2018). 10.1088/1361-6560/aacdd3 [DOI] [PMC free article] [PubMed] [Google Scholar]
- 21.Gonzalez E. A., Jain A., Bell M. A. L., “Combined ultrasound and photoacoustic image guidance of spinal pedicle cannulation demonstrated with intact ex vivo specimens,” Transactions on Biomedical Engineering (2021) 10.1109/TBME.2020.3046370. [DOI] [PMC free article] [PubMed] [Google Scholar]
- 22.Kempski K. M., Wiacek A., Graham M., González E., Goodson B., Allman D., Palmer J., Hou H., Beck S., He J., Bell M. A. L., “In vivo photoacoustic imaging of major blood vessels in the pancreas and liver during surgery,” J. Biomed. Opt. 24(12), 1 (2019). 10.1117/1.JBO.24.12.121905 [DOI] [PMC free article] [PubMed] [Google Scholar]
- 23.Graham M., Assis F., Allman D., Wiacek A., Gonzalez E., Gubbi M., Dong J., Hou H., Beck S., Chrispin J., Bell M. A. L., “In vivo demonstration of photoacoustic image guidance and robotic visual servoing for cardiac catheter-based interventions,” IEEE Transactions on Med. Imaging 39(4), 1015–1029 (2020). 10.1109/TMI.2019.2939568 [DOI] [PubMed] [Google Scholar]
- 24.Allard M., Shubert J., Bell M. A. L., “Feasibility of photoacoustic-guided teleoperated hysterectomies,” Journal of Medical Imaging 5(02), 1 (2018). 10.1117/1.JMI.5.2.021213 [DOI] [PMC free article] [PubMed] [Google Scholar]
- 25.Gandhi N., Allard M., Kim S., Kazanzides P., Lediju Bell M., “Photoacoustic-based approach to surgical guidance performed with and without a da vinci robot,” J. Biomed. Opt. 22(12), 1 (2017). 10.1117/1.JBO.22.12.121606 [DOI] [Google Scholar]
- 26.Bell M. A. L., Ostrowski A. K., Li K., Kazanzides P., Boctor E. M., “Localization of transcranial targets for photoacoustic-guided endonasal surgeries,” Photoacoustics 3(2), 78–87 (2015). 10.1016/j.pacs.2015.05.002 [DOI] [PMC free article] [PubMed] [Google Scholar]
- 27.Graham M., Huang J., Creighton F., Bell M. A. L., “Simulations and human cadaver head studies to identify optimal acoustic receiver locations for minimally invasive photoacoustic-guided neurosurgery,” Photoacoustics 19, 100183 (2020). 10.1016/j.pacs.2020.100183 [DOI] [PMC free article] [PubMed] [Google Scholar]
- 28.Xia W., Maneas E., Nikitichev D. I., Mosse C. A., Dos Santos G. S., Vercauteren T., David A. L., Deprest J., Ourselin S., Beard P. C., et al. , “Interventional photoacoustic imaging of the human placenta with ultrasonic tracking for minimally invasive fetal surgeries,” in International Conference on Medical Image Computing and Computer-Assisted Intervention (Springer, 2015), pp. 371–378. [DOI] [PMC free article] [PubMed] [Google Scholar]
- 29.ANSI , American National Standard for Safe Use of Lasers (Laser Institute of America, 2014). [Google Scholar]
- 30.Lediju Bell M. A., “Photoacoustic imaging for surgical guidance: Principles, applications, and outlook,” J. Appl. Phys. 128(6), 060904 (2020). 10.1063/5.0018190 [DOI] [PMC free article] [PubMed] [Google Scholar]
- 31.Park S., Park G., Kim J., Choi W., Jeong U., Kim C., “Bi2se3 nanoplates for contrast-enhanced photoacoustic imaging at 1064 nm,” Nanoscale 10(44), 20548–20558 (2018). 10.1039/C8NR05672B [DOI] [PubMed] [Google Scholar]
- 32.Jacques S. L., “Coupling 3d monte carlo light transport in optically heterogeneous tissues to photoacoustic signal generation,” Photoacoustics 2(4), 137–142 (2014). 10.1016/j.pacs.2014.09.001 [DOI] [PMC free article] [PubMed] [Google Scholar]
- 33.Salomatina E. V., Jiang B., Novak J., Yaroslavsky A. N., “Optical properties of normal and cancerous human skin in the visible and near-infrared spectral range,” J. Biomed. Opt. 11(6), 064026 (2006). 10.1117/1.2398928 [DOI] [PubMed] [Google Scholar]
- 34.Carneiro I., Carvalho S., Henrique R., Oliveira L., Tuchin V. V., “Measuring optical properties of human liver between 400 and 1000 nm,” Quantum Electron. 49(1), 13–19 (2019). 10.1070/QEL16903 [DOI] [Google Scholar]
- 35.Ritz J.-P., Roggan A., Isbert C., Muller G., Buhr H. J., Germer C.-T., “Optical properties of native and coagulated porcine liver tissue between 400 and 2400 nm,” Lasers Surg. Med. 29(3), 205–212 (2001). 10.1002/lsm.1134 [DOI] [PubMed] [Google Scholar]
- 36.Bosman S. S., Phoa S. S. K., Bosma A., van Gemert M. J. C., “Effect of percutaneous interstitial thermal laser on normal liver of pigs: Sonographic and histopathological correlations,” Br. J. Surg. 78, 572–575 (1991). 10.1002/bjs.1800780517 [DOI] [PubMed] [Google Scholar]
- 37.AACC , “Total Protein, Albumin-Globulin (A/G) Ratio,” (2019).
- 38.AACC , “Alanine Aminotransferase (ALT),” (2019).
- 39.AACC , “Aspartate Aminotransferase (AST),” (2016).
- 40.AACC , “Alkaline Phosphatase (ALP),” (2020).
- 41.AACC , “Gamma-Glutamyl Transferase (GGT),” (2019).
- 42.AACC , “Lactate Dehydrogenase (LDH),” (2018).
- 43.Elbers A. R., Geudeke M. J., van Rossem H., Kroon M. C., Counotte G. H., “Haematology and biochemistry reference values for sows kept under modern management conditions,” Vet. Q. 16(2), 127–130 (1994). 10.1080/01652176.1994.9694433 [DOI] [PubMed] [Google Scholar]
- 44.Klem T. B., Bleken E., Morberg H., Thoresen S. I., Framstad T., “Hematologic and biochemical reference intervals for norwegian crossbreed grower pigs,” Vet. Clin. Pathol. 39(2), 221–226 (2009). 10.1111/j.1939-165X.2009.00199.x [DOI] [PubMed] [Google Scholar]
- 45.Wynn T. A., “Cellular and molecular mechanisms of fibrosis,” J. Pathol. 214(2), 199–210 (2008). 10.1002/path.2277 [DOI] [PMC free article] [PubMed] [Google Scholar]
- 46.Zharov V. P., Galanzha E. I., Shashkov E. V., Khlebtsov N. G., Tuchin V. V., “In vivo photoacoustic flow cytometry for monitoring of circulating single cancer cells and contrast agents,” Opt. Lett. 31(24), 3623–3625 (2006). 10.1364/OL.31.003623 [DOI] [PubMed] [Google Scholar]
- 47.Sowers T., VanderLaan D., Karpiouk A., Donnelly E. M., Smith E., Emelianov S., “Laser threshold and cell damage mechanism for intravascular photoacoustic imaging,” Lasers Surg. Med. 51(5), 466–474 (2019). 10.1002/lsm.23026 [DOI] [PubMed] [Google Scholar]


