Abstract
Objective
Necrotizing enterocolitis (NEC) is an inflammatory bowel disease of preterm infants marked by an absolute monocyte count (AMC) drop in peripheral blood. Our objective was to determine whether the degree of AMC drop at illness onset correlates with eventual severity of disease.
Study design
The percentage change in AMC was retrospectively calculated for each of 29 rule-out NEC and 76 NEC cases from baseline to illness onset, and then compared across stages.
Results
Median AMC changes of +0.5% (p = 0.56) were found in rule-out NEC, compared with −44.5% (p < 0.0001) in Stage 2 and −81.9% (p < 0.0001) in Stage 3. An AMC change cutoff of −75% distinguishes Stages 2 and 3.
Conclusions
The severity of NEC correlated with the extent of AMC change in a dose-response fashion. Percent AMC change may be a useful marker for identifying NEC at onset and prognosticating disease severity.
Introduction
Necrotizing enterocolitis (NEC) is the most common acquired inflammatory bowel disease of preterm infants, and can be fatal in the most severely affected infants [1]. At illness onset, it is difficult to predict which infants will experience the greatest disease burden [2, 3]. Some infants present with fulminant symptoms, while others start with a milder course but retain the potential to progress to severe disease. Severe cases may require surgical intervention for resection of necrotic bowel or the evacuation of pneumoperitoneum [2–5]. Prediction of such severe cases would facilitate timely transfer of affected infants to higher levels of care that can offer pediatric surgical expertise [2, 3, 5]. To date, there is no established biomarker that can predict which infants will be most severely affected.
A drop in peripheral absolute monocyte count (AMC) has been reported in preterm infants with NEC at the time of illness onset relative to baseline, though this has not been previously tied to severity or prognosis [6]. It has been suggested that this reduction is secondary to intestinal pathology. Monocyte-derived intestinal macrophages participate in the gut wall infiltration classically seen in NEC, and once infiltration occurs, peripheral blood monocytes may be called upon to replete the intestinal monocyte pool. A reduction in peripheral blood monocyte count should thus be expected at the onset of symptoms, and has indeed been demonstrated in Modified Bell Stages 2 and 3 NEC [6]. What has not been previously demonstrated is whether the degree of change in peripheral blood AMC occurs to a greater extent in more severe disease. In this study, we propose that infants with more severe disease will experience greater gut wall infiltration and will thus have a greater reduction in blood AMC. We aim to determine whether the change in AMC has promise as a biomarker for early identification of NEC as well as its severity. First, we will corroborate prior findings that Stages 2 and 3 NEC individually show drops in AMC with regard to baseline. We will further investigate whether the two stages can be differentiated in peripheral blood; that is, if Stage 3 NEC leads to a greater AMC drop than Stage 2 NEC. These outcomes will be measured by the percentage change in AMC from baseline to illness onset. In addition, we will compare the changes in AMC that occur in NEC with those that occur in bacteremia, which may mimic NEC at illness onset. We hypothesize that no change in AMC will be seen in infants with bacteremia. Our secondary outcome is the percent change in AMC from baseline to illness onset in infants with bacteremia.
Patients and methods
A retrospective chart review of premature infants admitted to the Neonatal Intensive Care Unit (NICU) at Columbia University Medical Center between January 1, 2012 and December 31, 2016 was performed. Infants were included if they were born prior to a gestational age of 33 weeks, were at least 7 postnatal days old, had no congenital gastrointestinal anomalies [7], and had a diagnosis of NEC, rule-out NEC, or late-onset bacteremia. Demographic data including sex, birthweight, and gestational age were collected on each infant. Infants who had more than one episode of NEC and/or bacteremia were classified only by the first illness they experienced, and no data was collected on recurrent episodes. Infants with pneumoperitoneum had charts reviewed for operative, pathological, and radio-graphic documentation of NEC and those diagnosed with spontaneous intestinal perforation were excluded. The study was approved by the Institutional Review Board.
Infants who were diagnosed with NEC were classified according to the severity of illness at its peak, under standard modified Bell Stages used in clinical practice [2, 3, 5]. All cases of NEC and rule-out NEC underwent a standard workup including complete blood count (CBC), blood culture, and abdominal radiograph. They all received broad-spectrum antibiotic treatment and were placed on a nil per os (NPO) diet with gastric decompression. The duration of this treatment as well as complications determined classification and staging. Confirmed NEC cases were treated for a minimum of 7 days. Those that survived treatment with no acute surgical complications were considered Stage 2, while those that required surgical intervention and/or died during the treatment course were classified as Stage 3. Rule-out NEC infants were those who underwent the same workup and treatment as described above, but were later determined to have had benign symptoms. Rule-out infants were treated for a minimum of 48 h and a maximum of 72 h.
Infants in the bacteremia group each had a positive blood culture after the first 7 days of life. We excluded younger infants in order to confine our group to bacteremia of late-onset only. We planned to include any infant with concurrent diagnoses of bacteremia and NEC under the appropriate NEC classification. The bacteremia category was not defined by diet or bowel rest.
Illness onset for all groups was identified by the time that a blood culture was drawn. Results of CBC with white blood cell differential drawn at the same time as the blood culture were recorded as the “illness-onset” CBC. The most recent CBC drawn prior to that time point was considered “baseline.”
For each infant enrolled, the change in monocyte count from baseline to illness onset was calculated as a percent change in AMC, referred to as percent delta AMC. Using percentages rather than absolute values allowed us to respect individual baselines. The following formula was used:
| (1) |
Drops in serum monocyte count resulted in negative percentage values and rises in serum monocyte counts resulted in positive percentage values. Each patient functioned as his or her own control with the expectation that monocyte count fluctuations are minimal in the absence of true illness [6].
The study was powered to detect a change in AMC of 0.9 × 10³/uL in Stage 2 patients, and a change of 1.3 × 10³/uL in Stage 3 patients, based on prior work [6]. When calculated with standard deviations, we found that we needed 16 subjects to detect an AMC change in Stage 2 NEC, and 10 subjects for Stage 3 NEC. Absolute values were used for study design, as there are no prior data that have evaluated a percentage change in AMC. We hoped to find a change between stages 2 and 3 in dose-response fashion.
Statistical analysis
Statistical analysis was performed using the R version 3.5.1 software (R Core Team (2019). R: A language and environment for statistical computing. R Foundation for Statistical Computing, Vienna, Austria. https://www.R-project.org/) and GraphPad Prism version 8.0.0 for Windows, GraphPad Software, San Diego, California USA, www.graphpad.com. Our data were classified and tested as nonparametric if the data were both continuous and not normally distributed, and assessed by the Shapiro–Wilk test on normality. All continuous data were determined to be not normally distributed. Clinical characteristics and AMCs from the CBCs that were classified as nonparametric were compared by the Wilcoxon Test. Percent delta AMC data were visualized using the Tukey–Koopman box-whisker plots. The significance of a change from baseline was determined by Wilcoxon Rank–Sum Tests, with calculations performed in R statistical software. The changes in each group (rule-out NEC, Stage 2, Stage 3, and bacteremia) were compared with each other and p values were calculated. Patients with bacteremia were similarly analyzed and compared to patients with NEC.
Receiver–operator characteristics (ROC) on percent change in AMC values between NEC stages were computed by plotting sensitivity versus 1–specificity. Youden’s J statistic was calculated to maximize sensitivity and specificity. To determine whether the diagnostic accuracy of percent change in AMC could be improved by including other clinical characteristics (birthweight, sex, gestational age, and time between baseline and illness onset,) in the ROC model, stepwise logistic regression was performed and the model with the lowest Akaike information criterion was chosen. The only variable included in the chosen model was NEC stage. A 2 × 2 contingency table was used to calculate sensitivity, specificity, and likelihood ratios. All statistical tests were two-sided and considered significant at p < 0.05.
Results
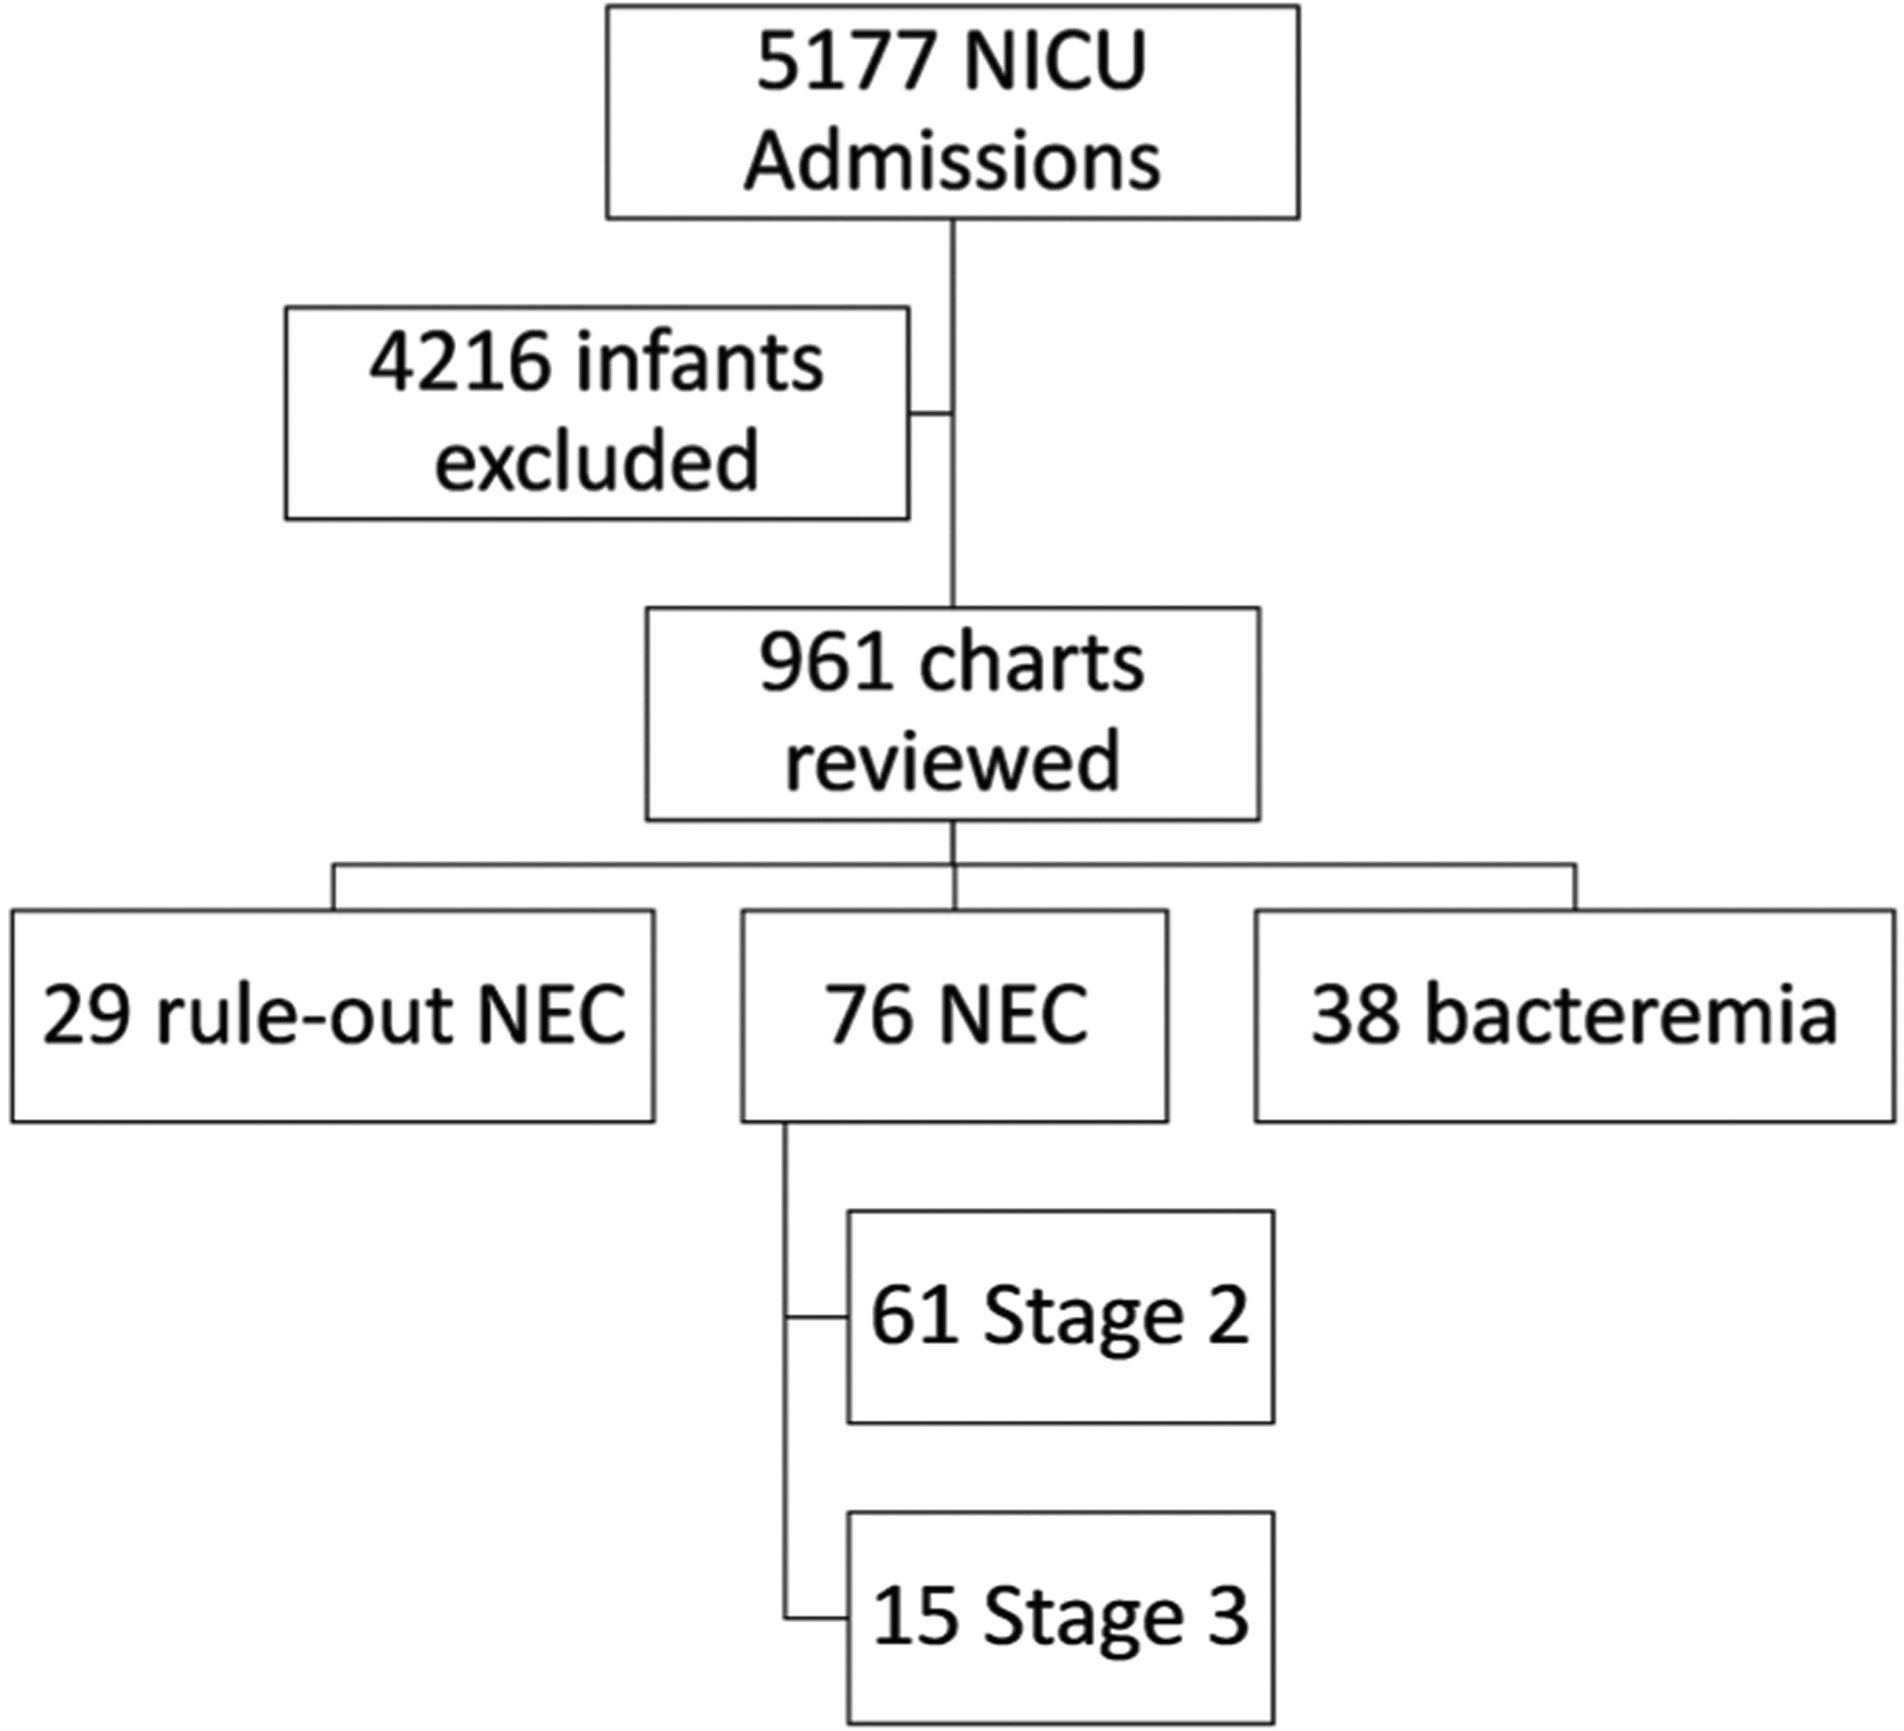
We evaluated 5177 NICU admissions for enrollment, of which 4216 were excluded from further review (see Fig. 1). The largest exclusionary criterion was gestational age, for which we excluded 3848 infants. Nine hundred and sixty-one charts underwent in-depth review, which led to the enrollment of 29 healthy NEC rule-outs, 76 infants with confirmed NEC, and 38 with bacteremia. Of the infants with NEC, 61 had Stage 2, and 15 had Stage 3. Table 1 shows no significant differences in demographics between the four groups (rule-out, Stage 2, Stage 3, bacteremia). Bacteremic infants were significantly younger at illness onset than rule-out NEC and Stage 2 NEC patients. There was no difference in the age of illness onset between Stages 2 and 3 NEC or rule-out NEC. Stage 3 infants were more likely than rule-out NEC patients to have received a packed red blood cell transfusion in the 48 h preceding illness onset, however, not more likely than the remaining two groups. Among the 38 bacteremic infants, the most commonly identified pathogen was Staphylococcus epidermidis (Table 2).
Fig. 1. CONSORT diagram.

5177 infants were admitted to the NICU, of which 4216 were excluded (3848 due to GA > 33 weeks, 139 outborns, 78 due to death prior to 1 week of life, 6 with early-onset sepsis, and 2 with congenital GI anomalies. Of the remaining 961 charts, 29 healthy NEC rule-outs were enrolled, 61 with Stage 2 NEC, 15 with Stage 3 NEC, and 38 with bacteremia.
Table 1.
Demographics.
| Rule-out NEC (n = 29) | Stage 2 NEC (n = 61) | Stage 3 NEC (n = 15) | Bacteremia (n = 38) | |
|---|---|---|---|---|
| Male sex | 34.4% (10) | 57.3% (35) | 40.0% (6) | 52.6% (20) |
| Gestational age in weeks + days, median (range) | 27 + 2 (24 + 0 − 32 + 2) | 27 + 1 (23 + 4 − 32 + 6) | 26 + 5 (24 + 3 − 32 + 1) | 26 + 3 (23 + 4 − 32 + 1) |
| Birthweight in grams, median (range) | 935 (460–1965) | 805 (400–2075) | 720 (470–2100) | 753 (430–1750) |
| Age at illness onset in days, median (range) | 29 (8–77) | 30 (10–100) | 26 (10–134) | 22 (8–65) |
| Received pRBC transfusion within preceding 48 h | 3% (1) | 16% (10) | 26% (4) | 16% (6) |
There were no significant differences in sex, gestational age (GA), or birthweight (BW) among stages, with p values ranging from 0.10 to 0.66. Bacteremic infants were significantly younger than infants with rule-out NEC and Stage 2 NEC (p = 0.05 and 0.02, respectively), but were not significantly younger than those with Stage 3 NEC (p = 0.07). Stage 3 infants were more likely to have received a recent packed red blood cell (pRBC) transfusion than rule-out NEC infants (p = 0.04); however, not more likely than Stage 2 infants or bacteremic infants (p = 0.46 and 0.44, respectively).
Table 2.
Pathogens implicated in infants with late-onset bacteremia (n = 38).
| Number of patients affected | Bacterial species |
|---|---|
| 20 | Staphylococcus epidermidis |
| 2 | Escherichia coli |
| 2 | Klebsiella pneumoniae |
| 2 | Staphylococcus aureus, methicillin-resistant |
| 2 | Staphylococcus aureus, methicillin-sensitive |
| 1 | Clostridium perfringens |
| 1 | Enterobacter aerogenes |
| 1 | Enterococcus faecalis |
| 1 | Serratia marcescens |
| 1 | Staphylococcus auricularis |
| 1 | Staphylococcus hominis |
| 1 | Staphylococcus saprophyticus |
| 1 | Staphylococcus warneri |
| 1 | Staphylococcus hemolyticus |
| 1 | Streptococcus agalactiae (Group B strep) |
Staphylococcus epidermidis was the most prevalent (20/38) pathogen found. Thirty-two of 38 cultures tested positive for gram-positive bacteria.
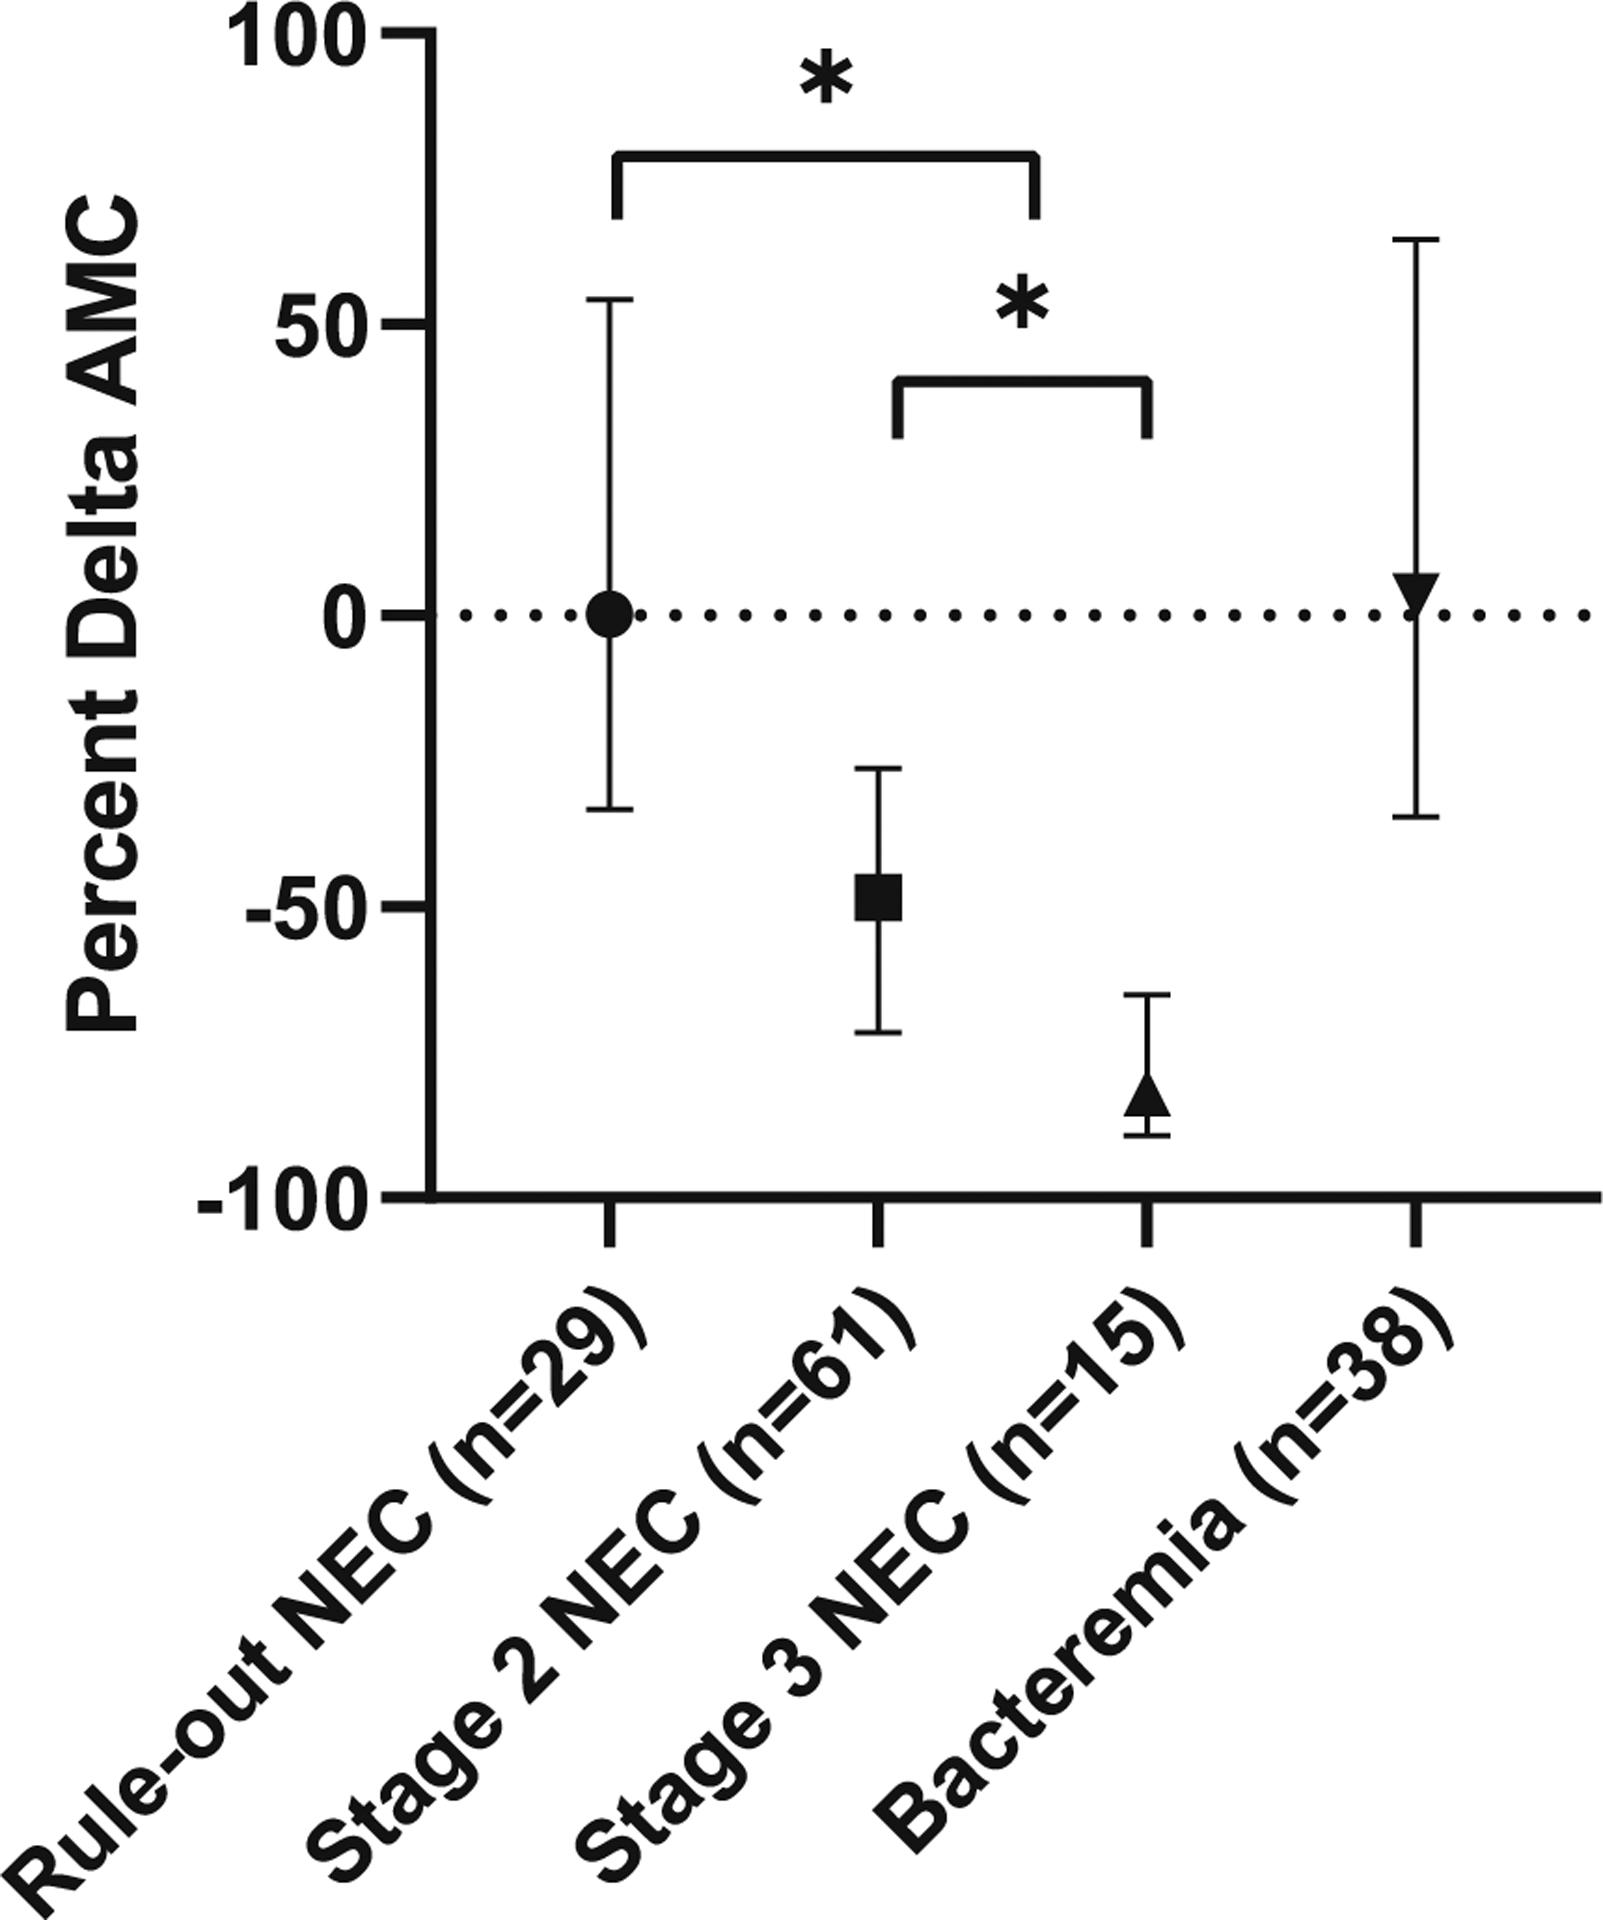
Baseline CBCs were drawn a median of 3 days prior to illness onset (range of 0–17 days). Rule-out NEC infants demonstrated a median change in AMC from baseline to illness onset of +0.5% [IQR −31.2%, +59.5%] (p = 0.56). Infants with Stage 2 NEC experienced a median percent delta AMC of −44.5% [IQR −70.4%, −25.3%] from baseline to illness onset (p < 0.001) and those with Stage 3 NEC experienced a median percent delta AMC of −81.9% [IQR −88.0%, −70.5%] (p < 0.001). Infants with bacteremia experienced a median percent delta AMC of +4.9% [IQR −29.5%, +93.0%] (p = 0.1). See Fig. 2 for details.
Fig. 2. Change in AMC from baseline to illness onset, expressed as a percentage, grouped by final diagnosis (*p < 0.001).

No significant AMC change from baseline is seen in infants with rule-out NEC or bacteremia without NEC. Infants with Stages 2 and 3 NEC show significant changes in AMC at the time of illness onset, relative to baseline (p < 0.001). Infants with Stage 3 NEC demonstrate a change in monocyte count that is significantly greater than the change seen in Stage 2 NEC, p < 0.001. There is a significant difference between the AMC change in rule-out NEC versus true NEC (Stages 2 or 3), p < 0.001.
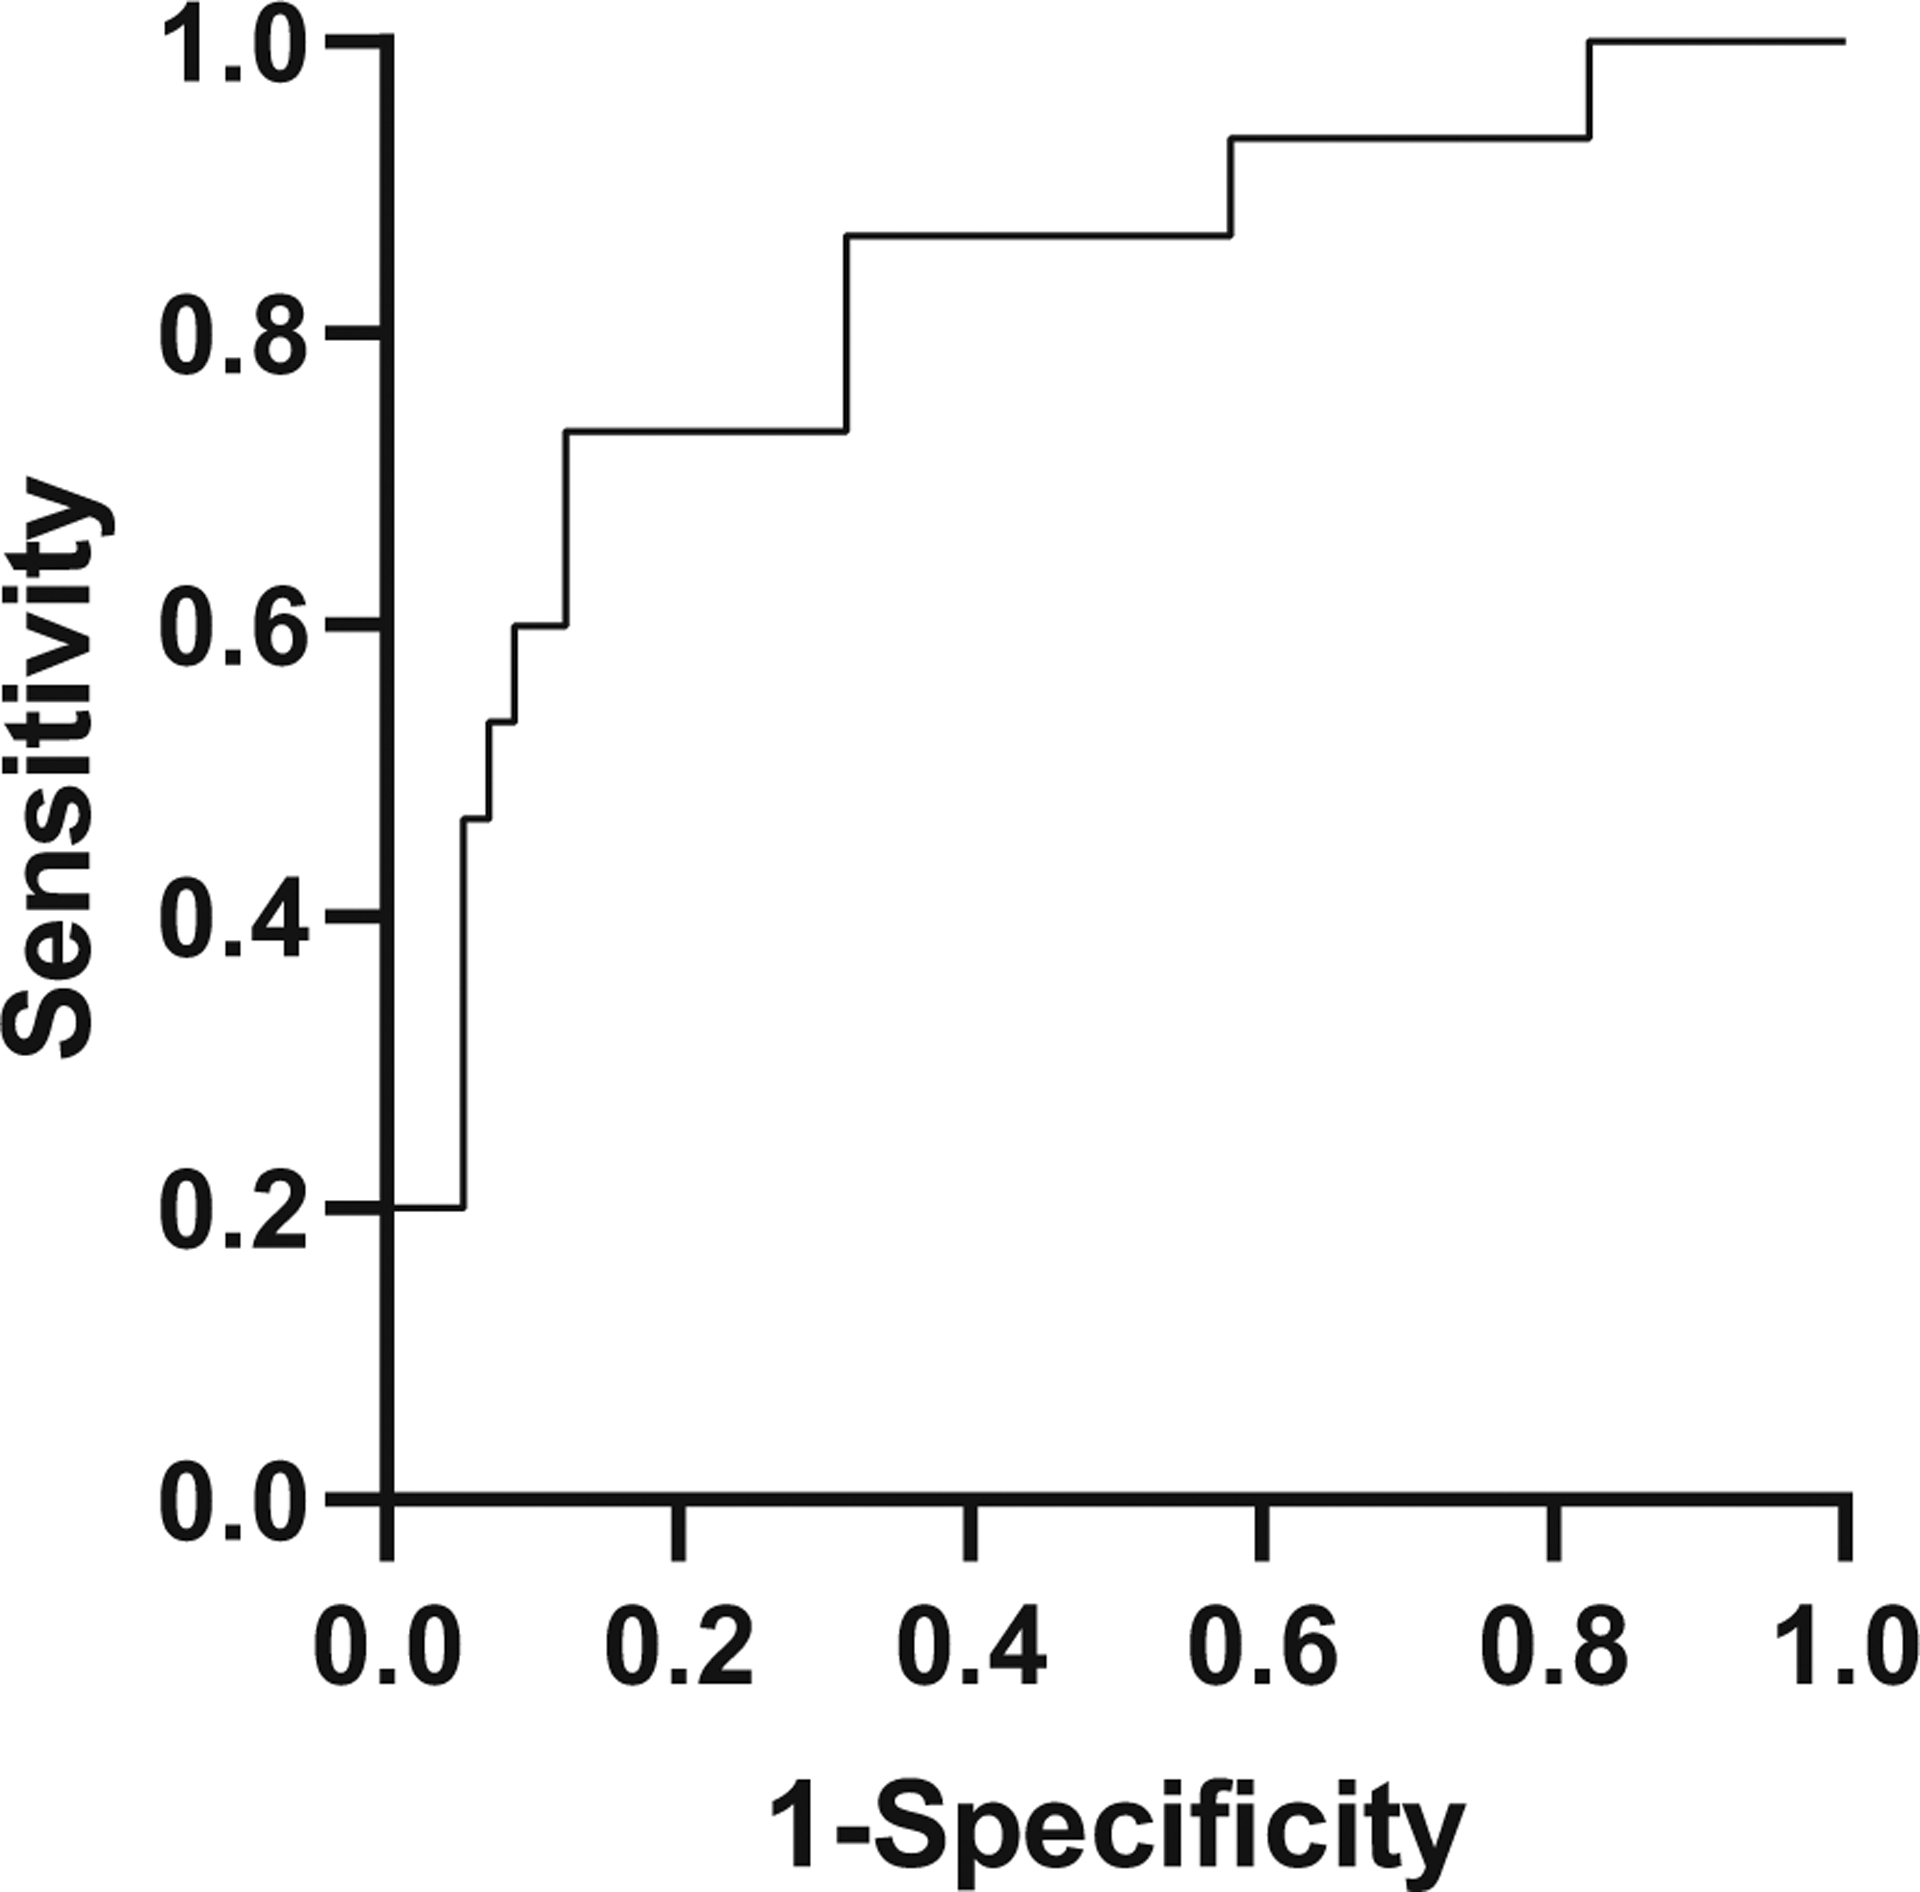
Our primary outcome was the ability to distinguish eventual Stages 2 and 3 from the percent delta AMC calculated at illness onset. We have demonstrated that infants with Stage 3 NEC had a significantly greater drop in AMC than those with Stage 2 NEC (p < 0.001). A receiver–operator curve was constructed, with Stage 3 denoted as “positive,” and Stage 2 as “negative” (see Fig. 3), with an area under the curve of 0.83. To distinguish Stages 2 and 3, the optimal change in AMC was found to be −75%, or an AMC drop of 75% from baseline, with 73% sensitivity and 87% specificity in the diagnosis of Stage 3 NEC. The positive likelihood ratio for this relationship was 5.62.
Fig. 3. Receiver–operator curve, to distinguish Stages 2 and 3 NEC.

With Stage 3 denoted as “positive” and Stage 2 as “negative,” sensitivity is plotted on the Y-axis and 1-specificity or false positive rate on the X-axis. These parameters are optimized at an AMC change of −75% from baseline, which is 73% sensitive and 87% specific in the diagnosis of Stage 3 NEC, with a positive likelihood ratio of 5.62.
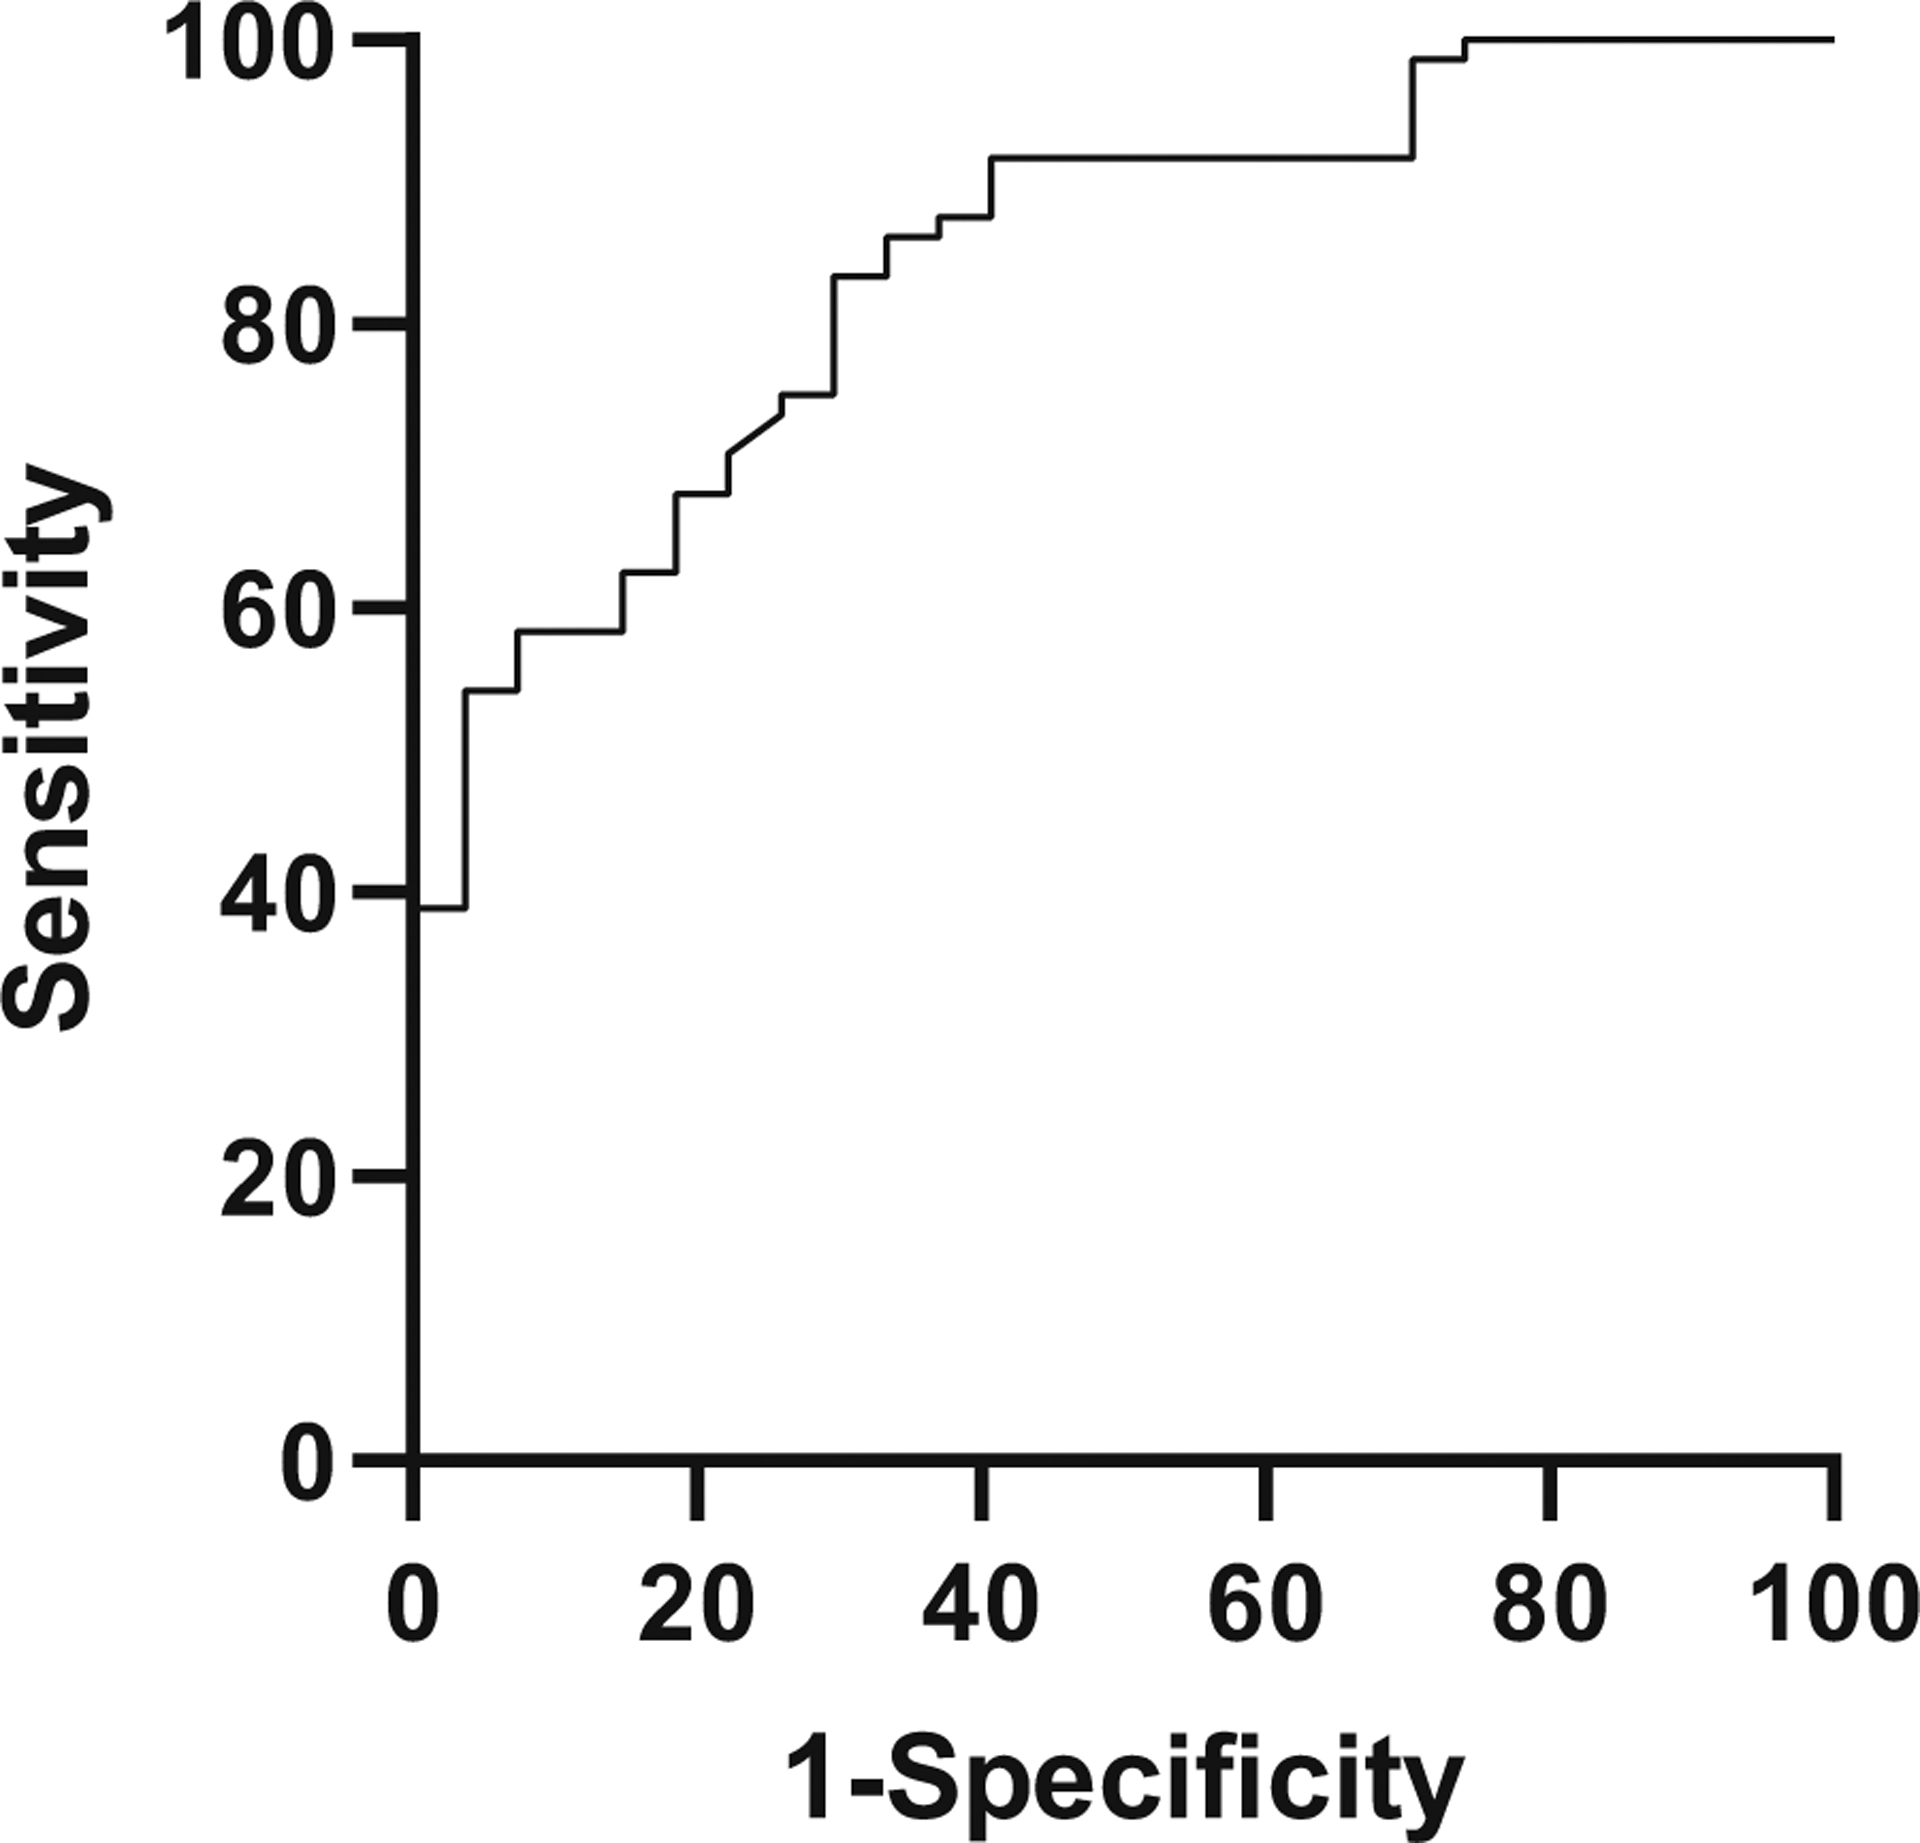
The ability to distinguish true NEC from benign symptoms carries a great deal of clinical importance. Figure 2 demonstrates that healthy rule-out infants and those with true NEC (Stages 2 or 3) experienced significantly different percent delta AMCs at illness onset. In Fig. 4, the ability to distinguish suspected NEC and true NEC using percent delta AMC is plotted on a ROC curve. The area under the curve is 0.81, and with a cutoff of −50%, sensitivity and specificity are maximized at 51% and 93%, respectively. The positive likelihood ratio for this relationship is 7.28.
Fig. 4. Receiver–operator curve, to distinguish rule-out NEC from confirmed NEC.

With Stages 2 and 3 denoted as “positive” and rule-out NEC as “negative,” sensitivity is plotted on the Y-axis and 1-specificity or false positive rate on the X-axis. These parameters are optimized at an AMC change of −50% from baseline, which is 51% sensitive and 93% specific in the diagnosis of true NEC, with a positive likelihood ratio of 7.28.
Discussion
Our data are the first to pilot the drop in AMC at disease onset as a potential biomarker for NEC severity, and to demonstrate a dose-response relationship between disease burden and AMC drop. To date, no other biomarker has been offered at illness onset for prediction of disease severity. AMCs are available on CBCs without additional phlebotomy or cost, and are closely tied with the histopathology of NEC. Our data corroborate prior findings that healthy infants who transiently mimic the symptoms of NEC show no change in AMC; as well as the fact that true NEC is characterized by a drop in AMC, likely owing to infiltration into the intestinal wall [6, 8]. We build on these findings by showing the absence of a significant AMC change in infants with late-onset bacteremia, distinguishing bacteremia from confirmed NEC.
Early identification of Stage 3 NEC has implications for management. Smaller community hospital NICUs may not have pediatric surgical consultation readily available, and would benefit from identifying cases that should be transferred to large university centers. Transportation between hospitals is safer when undertaken with hemodynamic stability [9], and therefore should be attempted early in the disease process before potential decompensation. In addition, a prognostic biomarker could guide appropriate family counseling.
The absence of a significant AMC change in bacteremic infants implies that the change seen in NEC should not be attributed to bacterial translocation from the gut to the bloodstream, which is thought to contribute to the systemic inflammatory response seen in NEC [2, 5]. The drop in peripheral monocyte count is more likely a secondary effect of macrophage infiltration of the gut wall, leading to the need for intestinal monocyte pool repletion [6]. The ability to tie histopathology to a clinically available marker offers a sense of precision that is inherently unavailable with non-specific markers such as C-reactive protein or procalcitonin. In addition, infants who experience bacteremia without NEC are less likely to need prolonged bowel rest [10], and a biomarker suggesting against NEC may lead to greater clinician confidence in restarting feeds in symptomatic infants. For instance, a benign entity that may mimic NEC in its early stages is functional dysmotility, which is commonly seen in preterm infants and does not necessarily warrant an NPO diet [11].
We were surprised to enroll more patients with Stage 2 NEC than healthy rule-outs; we attribute this to our requirement for the strict documentation of concern for NEC, which may have excluded several patients that would otherwise have been enrolled. In addition, the consequences of leaving NEC untreated are often considered greater than the consequences of overtreating, perhaps leading many clinicians to err on the side of caution in ambiguous cases. Finally, we excluded infants born at gestational ages 33 weeks and older. The likelihood of NEC in late preterm infants is low but not zero, and including these infants may have contributed additional patients to our groups. However, it was important to exclude these infants as the phenotypic profile of circulating monocytes changes throughout gestation [12]. Monocyte relationships have not been previously studied in late preterms who develop NEC.
Recent murine data has modeled NEC using packed red blood cell transfusions in the setting of anemia [8]. We were unable to find this effect in our cohort, presumably due to low numbers. Though infants with Stage 3 NEC were more likely to have received a recent packed red blood cell transfusion than rule-out NEC infants, they were not more likely than bacteremic infants, making it difficult to draw associations between NEC and recent transfusion.
Potential confounders that affect monocyte levels have been proposed. Inflammation is a classic source of monocyte production and use, as they are part of the innate immune system and participate in antigen presentation. Additionally, in the setting of red blood cell transfusions, monocyte levels rise in an effort to clear nontransferrin bound iron from circulation, which is particularly important when using older units of blood [13]. Monocytes also participate in the removal of senescent red blood cells [13, 14].
To our knowledge, this is the first study to propose a dose-response relationship of NEC stages based on AMC as a biomarker. Our data show that the median changes in AMC are −44.5% in Stage 2 NEC and −81.9% in Stage 3 NEC, which carry statistical significance. We also show that an AMC drop of at least 75% from baseline suggests Stage 3 NEC, and we believe that this can help guide earlier management. At this point, the use of this biomarker should be limited to the infants who have already raised clinician suspicion for NEC, as no data has been gathered on asymptomatic patients. We hope that future studies can be aimed at evaluating infants with strict prospective diagnostic criteria including physical exam findings, in order to fully validate AMC as a predictive biomarker.
Footnotes
Conflict of interest The authors declare that they have no conflict of interest.
References
- 1.Patel RM, Kandefer S, Walsh MC, Bell EF, Carlo WA, Laptook AR, et al. Causes and timing of death in extremely premature infants from 2000 through 2011. N. Engl J Med 2015;372: 331–40. [DOI] [PMC free article] [PubMed] [Google Scholar]
- 2.Niño DF, Sodhi CP, Hackam DJ. Necrotizing enterocolitis: new insights into pathogenesis and mechanisms. Nat Rev Gastroenterol Hepatol. 2016;13:590–600. [DOI] [PMC free article] [PubMed] [Google Scholar]
- 3.Hackam D, Caplan M. Necrotizing enterocolitis: pathophysiology from a historical context. Semin Pediatr Surg. 2018;27:11–8. [DOI] [PMC free article] [PubMed] [Google Scholar]
- 4.Mara MA, Good M, Weitkamp J-H. Innate and adaptive immunity in necrotizing enterocolitis. Semin Fetal Neonatal Med. 2018;23: 394–9. [DOI] [PMC free article] [PubMed] [Google Scholar]
- 5.Neu J, Walker WA. Necrotizing enterocolitis. N Engl J Med. 2011;364:255–64 [DOI] [PMC free article] [PubMed] [Google Scholar]
- 6.Remon J, Kampanatkosol R, Kaul RR, Muraskas JK, Christensen RD, Maheshwari A. Acute drop in blood monocyte count differentiates NEC from other causes of feeding intolerance. J Perinatol. 2014;34:549–54. [DOI] [PMC free article] [PubMed] [Google Scholar]
- 7.Condino AA, Barleycorn AA, Lu W, Maheshwari A, Christensen RD, Calhoun DA. Abnormal intestinal histology in neonates with congenital anomalies of the gastrointestinal tract. Neonatology. 2004;85:145–50. [DOI] [PubMed] [Google Scholar]
- 8.MohanKumar K, Namachivayam K, Song T, Jake Cha B, Slate A, Hendrickson JE, et al. A murine neonatal model of necrotizing enterocolitis caused by anemia and red blood cell transfusions. Nat Commun. 2019;10. http://www.nature.com/articles/s41467-019-11199-5. Accessed 26 Aug 2019. [DOI] [PMC free article] [PubMed] [Google Scholar]
- 9.Lupton BA, Pendray MR. Regionalized neonatal emergency transport. Semin Neonatol. 2004;9:125–33. [DOI] [PubMed] [Google Scholar]
- 10.Cantey JB, Milstone AM. Bloodstream Infections. Clin Perinatol. 2015;42:1–16. [DOI] [PubMed] [Google Scholar]
- 11.Lam HS, Ng PC. Use of prokinetics in the preterm infant. Curr Opin Pediatr. 2011;23:156–60. [DOI] [PubMed] [Google Scholar]
- 12.de Jong E, Strunk T, Burgner D, Lavoie PM, Currie A. The phenotype and function of preterm infant monocytes: implications for susceptibility to infection. J Leukoc Biol. 2017;102:645–56. [DOI] [PubMed] [Google Scholar]
- 13.Kalhan TG, Bateman DA, Bowker RM, Hod EA, Kashyap S. Effect of red blood cell storage time on markers of hemolysis and inflammation in transfused very low birth weight infants. Pediatr Res. 2017;82:964–9. [DOI] [PMC free article] [PubMed] [Google Scholar]
- 14.Ellefson AM, Locke RG, Zhao Y, Mackley AB, Paul DA. Increased monocytes and bands following a red blood cell transfusion. J Perinatol. 2016;36:57–60. [DOI] [PubMed] [Google Scholar]


