

Abstract
Background:
Exposure to black carbon indoors may be associated with blood pressure; however, evidence is limited to vulnerable subpopulations and highly exposed individuals. Our objective was to explore the relationship between indoor black carbon at various exposure windows on resting blood pressure in a general population sample.
Methods:
Black carbon was measured in the home of 76 individuals aged 10–71 in New Orleans, Louisiana. Exposure was measured every 1 minute for up to 120 hours using an AE51 microaethalometer. Systolic blood pressure and diastolic blood pressure were measured at the conclusion of exposure monitoring.
Results:
In adjusted models, at all exposure windows, increasing black carbon was associated with increased systolic blood pressure. The period 0–72 hours prior to blood pressure measurement showed the strongest effect; a 1 μg/m3 increase in black carbon was associated with a 7.55 mm Hg (P = .02) increase in systolic blood pressure. The relationship was stronger in participants reporting doctor-diagnosed hypertension (β = 6.47 vs β = 3.27). Black carbon was not associated with diastolic blood pressure.
Conclusion:
Increasing black carbon concentration indoors is positively associated with increasing systolic blood pressure with the most relevant exposure window being 0–72 hours prior to blood pressure measurement. Individuals with hypertension may be a more susceptible population.
Keywords: air pollution, black carbon, blood pressure, cardiovascular disease, indoor air, particulate matter, PM2.5
1 |. INTRODUCTION
Exposure to ambient air pollution, in particular to particulate less than 2.5 μm in diameter (PM2.5), is a leading cause of morbidity and mortality worldwide. The detrimental effects of exposure are in large part due to its impact on cardiovascular disease (CVD).1 Cardiovascular mortality and morbidity have been found to be associated with short-term and chronic exposure to PM2.5 in studies conducted throughout the world.2–4 The World Health Organization (WHO) estimates that in 2016, 4.2 million premature deaths resulted from exposure to air pollution with a large portion of those deaths being due to CVD.5,6 Exposure to PM2.5 may also contribute to elevated blood pressure, a precursor to CVD, and the leading risk factor for morbidity and mortality worldwide.7,8 However, data are inconsistent.
There are numerous pathways by which exposure to particulate matter (PM) may increase blood pressure including increased markers of systemic inflammation, platelet aggregation, DNA methylation disruption, and endothelial dysfunction.9–11 In a recent meta-analysis from 16 countries, Yang et al found significant associations between long- and short-term exposure to air pollution (PM2.5, PM10, NO2, and SO2) and hypertension, systolic blood pressure, and diastolic blood pressure. However, effect estimates varied in magnitude, individual study results were mixed, and a high degree of study heterogeneity limits interpretation of the relationship.12 The discrepancy in results may be a result of limitations associated with using PM mass concentration as the marker of exposure to air pollutants. Particulate matter is a heterogeneous mixture of solid and liquid compounds that vary in particle size, pollutant composition, source, and toxicity.13 Inconsistencies in the effect of exposure may be due to variations in the source and composition of the contaminant mixture that comprises PM.12,14 The specific component(s) of PM responsible for adverse health is not well understood although some studies have identified black carbon as a key component.15
Black carbon, a pollutant closely associated with traffic-related air pollution, cooking, and other combustion activities, comprises a large portion of PM air pollution. It is produced both naturally and by human activity as a result of incomplete combustion of fossil fuels, biofuels, and biomass. Exposure to black carbon particles has been found to be associated with adverse cardiovascular events in previous studies.15,16 A 2017 systematic review reported that outdoor black carbon level is positively associated with serious cardiovascular outcomes (emergency department visits, hospitalizations, and CVD mortality).17 A 2018 systematic review specifically on blood pressure concluded that exposure is associated with increased systolic and diastolic blood pressure.18 However, effect sizes varied substantially between studies depending on the exposure assessment methodology utilized, the geographic location, and the characteristics of the study population.
There were several important data gaps identified in these reviews. They include the lack of data on indoor exposure to black carbon, the lack of data on the impact of exposure on health in a general population sample, and limited data on cumulative and lagged exposures beyond the 24-hour period prior to outcome assessment. Of 22 studies of black (or elemental) carbon included in the 2018 systematic review, only three examined indoor air and these were conducted in select populations. Two included populations with high exposure- women during cooking sessions using biomass fuel. The third included residents of a nursing home with an average age of 78 years. Seniors have been identified as being more susceptible to the effects of PM.19–21 The maximum exposure period observed was 0–24 hours prior to blood pressure measurement, and a recently published cooking study in rural China extended the exposure window to 48 hours.22 All four studies found a positive association with blood pressure highlighting the potential importance of indoor exposure. The level of black carbon indoors is heavily influenced by infiltration of particles from outdoors but also by particles whose origins are indoors. The limited amount of research on indoor exposure in the general population is an important knowledge gap given that indoor concentrations may exceed outdoor concentrations, while people typically spend a greater portion of their time indoors than outdoors.23,24
The objective of this study was to address these data gaps. We quantified short-term (1–120 hours) level of black carbon in the home and examined the relationship between various exposure periods and resting blood pressure in a general population sample of adults and children in New Orleans, Louisiana. We hypothesize that increasing black carbon concentration, at levels found in typical indoor residential settings, is associated with increased systolic and diastolic blood pressure.
2 |. MATERIALS AND METHODS
2.1 |. Study design and study population
We employed convenience sampling of adults and children recruited from health fairs and general outreach activities in New Orleans, Louisiana from January to October 2016. Inclusion criteria were language proficiency in English or Spanish and residing in the home at least 4 nights per week. We did not exclude participants based on comorbid status. Both adults and children were included because numerous studies show that precursors to cardiovascular disease in adulthood begin in childhood.25,26 Black carbon in the home was monitored for up to 120 hours. At the end of the monitoring period, blood pressure was assessed in all participants. The study was approved by the Tulane University Biomedical Institutional Review Board, and informed consent and the child’s assent were obtained from each participant prior to any data collection.
2.2 |. Exposure measurement
Black carbon was measured continuously with a portable microaethalometer (microAeth Model AE51; AethLabs) in the home of each participant. One monitor was placed either in the living room/kitchen area or in the bedroom depending upon the location the participant reported spending the greatest amount of time.14 Black carbon was measured every minute at a flow rate of 50 mL/min during the sampling period. Monitors were placed in homes and retrieved 5 days later for a maximum of 120 hours of exposure monitoring. Black carbon concentration was quantified as pollutant mass per volume of air (microgram per cubic meter of air).
MicroAeth data from the first 10 minutes and the last 2 minutes of each session were removed. Data were truncated (if microAeth started early or ran long) or filled with NA values (if microAeth started late, ended early, or stopped in the middle of deployment) using the starting and ending date and time in the field deployment activity sheet. Extremely high or negative values during short-duration events (typically 1–2 points/event) were replaced by NA values, which impacted up to 0.74% of data for each session except in two sessions which had 2–4 hours of negative readings. Hourly and daily averaged black carbon concentrations prior to blood pressure measurement were calculated for each session. For statistical analysis purposes, hourly and daily averaged black carbon concentrations lower than 0.05 μg/m3 were replaced by 0.05 μg/m3, half of the estimated microaethalometer quantitation limit of 0.1 μg/m3. This impacted 317 out of 7734 hourly averages (4%) and 3 out of 353 daily averages (0.8%). To explore, the most relevant exposure window black carbon exposure was assessed in two ways: the cumulative average exposure over time periods varying from 1 hour up to 120 hours prior to blood pressure measurement (0–1, 0–2, 0–4,0–8, 0–24, 0–48, 0–72, 0–96, and 0–120 hours) and lagged exposures up to 5 days prior to blood pressure measurement (0–24, 24–48, 48–72, 72–96, and 96–120 hours).
2.3 |. Outcome measurement
Systolic blood pressure and diastolic blood pressure were the primary outcomes. Blood pressure was measured in the home by field staff trained in blood pressure assessment on the fourth day following placement of the monitor using the Omron HEM 907XL automatic device (Omron Healthcare Inc). Following the National Health and Examination Survey (NHANES) protocol, the upper right arm circumference was measured to determine the appropriate cuff size which was placed on the participant’s dominant arm.27 After resting quietly in a sitting position for 5 minutes, three consecutive blood pressures were obtained. The average of the three measurements was used as the outcome variable. Systolic blood pressure and diastolic blood pressure were modeled as continuous variables in separate models.
2.4 |. Covariates
Covariates were chosen based on previous research that identified them as being associated with blood pressure. Information on sociodemographic characteristics, age, race, income, sex, height, weight, comorbidities (doctor diagnosed), smoking status (self-report current smoker), smoking in the home (defined as responding yes to self or other household members smoking cigarettes, cigarillos, cigars, pipes or other tobacco products in the home), medication history, physical activity (number of days reporting physical activity in the previous week, for children or typical week for adults), and alcohol use history (average number of drinks per week over the previous year), were obtained via survey questionnaire at the baseline home visit by trained study personnel. Temperature, specifically cold temperature, is associated with increased blood pressure and was assessed as a potential confounder.28 The daily average outdoor temperature on the day blood pressure was measured was determined using publicly available data from the National Centers for Environmental Information (https://www.ncdc.noaa.gov/). For a subset of participants, indoor temperature was assessed with a HOBO® continuous data logger (Onset Computer Corporation). The device was placed on the living room floor for one week, and continuous measurements (every 5 minutes) of temperature and relative humidity were recorded. Average daily indoor temperature was calculated as the mean of all data points from midnight on the day of blood pressure measurement until time blood pressure was taken. At the baseline interview, any participant reporting being told by a physician or healthcare provider that they have hypertension was categorized as having hypertension.
2.5 |. Statistical analysis
To describe the study population, means and standard deviations are presented for continuous variables and the number and proportion of participants presented for categorical variables. Bivariate linear regression analyses were conducted to assess the relationship between level of black carbon and blood pressure and to identify potential confounding effects of each covariate. Black carbon was treated as a continuous variable in all models with systolic and diastolic blood pressure modeled separately. Any covariate significantly (P < .10) associated with blood pressure in bivariate analysis was included in multivariable models to control for potential confounding. Results were expressed as the mmHg change in blood pressure associated with a 1 μg/m3 increase in black carbon concentration.
In order to assess the distribution of black carbon’s cumulative effect over time, beta coefficients of the relationship between black carbon and systolic blood pressure were assessed via linear regression for cumulative average black carbon concentration each hour (0–120) prior to blood pressure measurement. To explore whether the effect of black carbon on blood pressure is different in participants with hypertension at baseline compared to those without hypertension, an a priori stratified analysis by hypertension status (yes vs no) was performed. Effect estimates (β coefficients) with corresponding 95% confidence intervals (CI) and calculated P-values are reported. All analyses were performed using SAS statistical software version 9.4 (SAS Institute, Inc).
3 |. RESULTS
Seventy-six individuals participated in the study with the majority (68%) being between 18 and 44 years of age. Most participants were female (60%), reported their race/ethnicity as black (89%), and had household income less than $25 000 per year (57%). Approximately one-third (29%) reported doctor-diagnosed hypertension, and the majority were overweight (33%) or obese (47%). Eight percent of participants reported being a current smoker with approximately one-third (31%) reporting being exposed to smoking in the home. Most participants (82%) were light-to-moderate drinkers and reported participating in physical activity approximately four days per week. The outdoor temperature on the day blood pressure was measured was, on average, 72°F ranging from 43°F to 88°F. The average systolic blood pressure was 125.39 mm Hg (SD 12.03), average diastolic blood pressure was 78.96 mm Hg (SD 9.37), and 72% of participants had elevated blood pressure (SBP > 120 mm Hg and DBP > 80 mm Hg) (Table 1A).
TABLE 1A.
Demographic characteristics of the study population, N = 76
| Characteristic | N | n (%) or Mean (SD) |
|---|---|---|
| Age (years) | 76 | |
| 10–17 | 5 (6.58) | |
| 18–44 | 52 (68.42) | |
| 45–64 | 16 (21.05) | |
| ≥65 | 3 (3.95) | |
| Sex | 76 | |
| Male | 30 (39.47) | |
| Female | 46 (60.53) | |
| Race | 76 | |
| Black | 68 (89.47) | |
| Other | 8 (10.53) | |
| Body mass index (categorical) | 76 | |
| <25 (normal) | 15 (19.74) | |
| 25–29.9 (overweight) | 25 (32.89) | |
| ≥30 (obese) | 36 (47.37) | |
| Income | 75 | |
| <$25 000 | 43 (57.33) | |
| $25 000–$50 000 | 18 (24.00) | |
| ≥$50000 | 14 (18.67) | |
| Exposed to smoking in the home | 76 | 24 (31.58) |
| Current Smoker | 62 | 5 (8.06) |
| Alcohol consumption (drinks/week)a | 75 | |
| Non-drinker (0) | 12 (16.00) | |
| Light (<1) | 37 (49.33) | |
| Moderate (F: 1–8, M 1–15) | 25 (33.33) | |
| Heavy (F:>8, M:>15) | 1 (1.33) | |
| Physical activity (days/week)b | 3.71 (1.72) | |
| Comorbidities | ||
| Diabetes (doctor diagnosed) | 74 | 3 (4.05) |
| Hypertension (doctor diagnosed) | 75 | 22 (29.33) |
| Taking hypertension Medication | 75 | 17(22.66) |
| Outdoor temperature (daily average F°)c | 76 | 71.72 (12.89) |
| Blood pressure, mm Hg | 76 | |
| Systolic (SBP) | 125.39 (12.03) | |
| Diastolic (DBP) | 78.96 (9.37) | |
| Elevated (SBP > 120 and DBP > 80) | 55 (72.37) |
Average drinks per week in the previous 12 mo.
For children, the number of days in the previous 7 d spent doing 60 min of physical activity; for adults, the number of days reporting moderate-intensity sports in a typical week.
Day of blood pressure measurement.
Air monitors were placed and picked up at the convenience of the study participant. Often the drop-off and pickup time varied which resulted in less than 120 hours of exposure monitoring. As indicated in Table 1B, most participants (n = 73) had exposure monitoring data up to 96 hours and 33 had complete (96–120 hours) monitoring data. When this convenience forced schedule resulted in a pickup before 120 hours, the black carbon monitor was typically still running allowing the blood pressure measurement to be obtained. The sampling design resulted in exposure averages being calculated and described relative to the time period before the blood pressure measurement (rather than relative to the start of the air monitor).
TABLE 1B.
Black carbon concentration (μg/m3) at various exposure windows
| Black Carbon Concentration | N | Mean (SD) | Range |
|---|---|---|---|
| Cumulative daily average (μg/m3) | |||
| 0–24 h | 72 | 0.51 (0.43) | 0.12–2.53 |
| 0–48 h | 72 | 0.52 (0.47) | 0.05–3.57 |
| 0–72 h | 72 | 0.55 (0.39) | 0.16–2.27 |
| 0–96 h | 70 | 0.62 (0.55) | 0.18–3.15 |
| 0–120 h | 32 | 0.66 (0.69) | 0.20–3.10 |
| Cumulative hourly average (μg/m3) | |||
| 0–1 h | 58 | 0.56 (0.61) | 0.05–3.08 |
| 0–2 h | 58 | 0.54 (0.54) | 0.05–2.64 |
| 0–4 h | 58 | 0.50 (0.48) | 0.05–2.30 |
| 0–8 h | 58 | 0.49 (0.37) | 0.11–1.63 |
| Lag time, average (μg/m3) | |||
| 0–24 h | 72 | 0.51 (0.43) | 0.12–2.53 |
| 24–48 h | 74 | 0.53 (0.52) | 0.05–3.87 |
| 48–72 h | 75 | 0.63 (0.67) | 0.12–3.67 |
| 72–96 h | 73 | 0.78 (1.38) | 0.14–8.09 |
| 96–120 h | 33 | 0.48 (0.37) | 0.05–1.68 |
In one home, the monitor failed, and in three homes, the monitor stopped running before the end of the monitoring period. One of these units stopped collecting data between 24–48 hours before the blood pressure measurement, and two units stopped between 0 and 24 hours before blood pressure measurement.
The concentration of black carbon over the 120-hour sampling period ranged from 0.05 to 8.09 μg/m3, and the mean concentration was 0.60 (±0.08) μg/m3 (data not shown). Overall, average black carbon concentration was relatively constant. Measured in daily 24-hour lag times, average black carbon ranged from 0.48 to 0.78 μg/m3, the cumulative daily average ranged from 0.51 to 0.66 μg/m3, and cumulative hourly averages ranged from 0.49 to 0.56 μg/m3 (Table 1B).
Due to the high degree of missing data for 96- to 120-hour measurements, regression models were not constructed for exposure periods 0 to 120 hours and 96–120. In unadjusted models (Table 2), black carbon measured as a cumulative average was associated with increased systolic blood pressure at each time point although the relationship did not reach statistical significance. Black carbon in the 48 hours prior to blood pressure measurement was associated with the greatest increase (β = 5.19; 95% CI −0.26, 10.64; P = .06). When measured in average lag times, the period 0–24 and 24–48 hours prior to blood pressure measurement was associated with increased systolic blood pressure although the relationship did not reach statistical significance. Black carbon 24–48 hours prior to blood pressure was associated with the greatest increase (β = 4.51; 95% CI −0.43, 9.56; P = .07). Of the covariates assessed, race (β = 8.96; 95% CI 0.44–17.48; P = .03), BMI (overweight β = 6.8; 95% CI 0.4–14.1; obese β = 10.5; 95% CI 3.7–17.3; P = .01), age (β = 0.2; 95% CI 0.1–0.4; P = .03), and outdoor temperature (β = 0.22; 95% CI 0.02–0.43; P = .03) were also significantly associated with systolic blood pressure.
TABLE 2.
Unadjusted association of 1 μg/m3 increase in black carbon with change in systolic blood pressure (mm Hg)
| Black carbon concentration | N | β | 95% CI | P-value |
|---|---|---|---|---|
| Cumulative daily average (μg/m3) | ||||
| 0–24 h | 72 | 3.48 | −2.58, 9.55 | .26 |
| 0–48 h | 72 | 5.19 | −0.26, 10.64 | .06 |
| 0–72 h | 72 | 4.37 | −2.38, 11.12 | .20 |
| 0–96 h | 70 | 1.62 | −3.22, 6.45 | .51 |
| Cumulative hourly average (μg/m3) | ||||
| 0–1 h | 58 | 3.19 | −1.40, 7.78 | .17 |
| 0–2 h | 58 | 1.11 | −3.58, 5.81 | .64 |
| 0–4 h | 58 | 2.09 | −3.67, 7.86 | .47 |
| 0–8 h | 58 | 0.64 | −7.15, 8.43 | .87 |
| Lag time, average (μg/m3) | ||||
| 0–24 h | 72 | 3.48 | −2.58, 9.55 | .26 |
| 24–48 h | 74 | 4.51 | −0.43, 9.56 | .07 |
| 48–72 h | 75 | −0.09 | −3.99, 3.81 | .96 |
| 72–96 h | 73 | 0.12 | −1.79, 2.04 | .90 |
In models adjusted for race, BMI, age, and temperature, increasing black carbon concentration remained associated with increased systolic blood pressure for all exposure windows assessed (Table 3). The cumulative period average 0–48 hours (β = 5.91; 95% CI 0.92, 10.90; P = .02) and 0–72 hours (β = 7.55; 95% CI 1.14, 13.96; P = .02) prior to blood pressure measurement were most strongly associated. When black carbon was measured at various lag times, the period 24–48 hours prior to blood pressure measurement was most strongly associated (β = 5.46; 95% CI 0.96, 9.97; P = .02) with systolic blood pressure.
TABLE 3.
Adjusted association of 1 μg/m3 increase in black carbon and systolic blood pressure (mm Hg)a
| Black carbon concentration | N | β | 95% CI | P-value |
|---|---|---|---|---|
| Cumulative daily average (μg/m3) | ||||
| 0–24 h | 72 | 4.26 | −1.38, 9.90 | .14 |
| 0–48 h | 72 | 5.91 | 0.92, 10.90 | .02 |
| 0–72 h | 72 | 7.55 | 1.14, 13.96 | .02 |
| 0–96 h | 70 | 4.83 | −0.11, 9.79 | .06 |
| Cumulative hourly average (μg/m3) | ||||
| 0–1 h | 58 | 3.61 | −0.52, 7.76 | .09 |
| 0–2 h | 65 | 4.56 | −0.25, 9.37 | .06 |
| 0–4 h | 65 | 4.11 | −1.22, 9.45 | .13 |
| 0–8 h | 67 | 3.61 | −3.47, 10.70 | .32 |
| Lag time, average (μg/m3) | ||||
| 0–24 h | 72 | 4.25 | −1.39, 9.90 | .14 |
| 24–48 h | 73 | 5.46 | 0.96, 9.97 | .02 |
| 48–72 h | 73 | 1.94 | −1.89, 5.78 | .31 |
| 72–96 h | 73 | 1.17 | −0.76, 3.10 | .23 |
All models adjusted for race, body mass index, age, and outdoor temperature.
The results of stratified analysis indicate that the relationship is stronger in those reporting doctor-diagnosed hypertension (Figure 1). In the period 0–48 hours, a 1 μg/m3 increase in black carbon was associated with a 4.69 mm Hg (95% CI −0.82, 10.20; P = .10) increase in systolic blood pressure among those with hypertension versus a 0.49 mm Hg (95% CI −8.50, 8.93; P = .96) increase in individuals without hypertension. Black carbon was not associated with diastolic blood pressure in any of the models assessed (data not shown).
FIGURE 1.
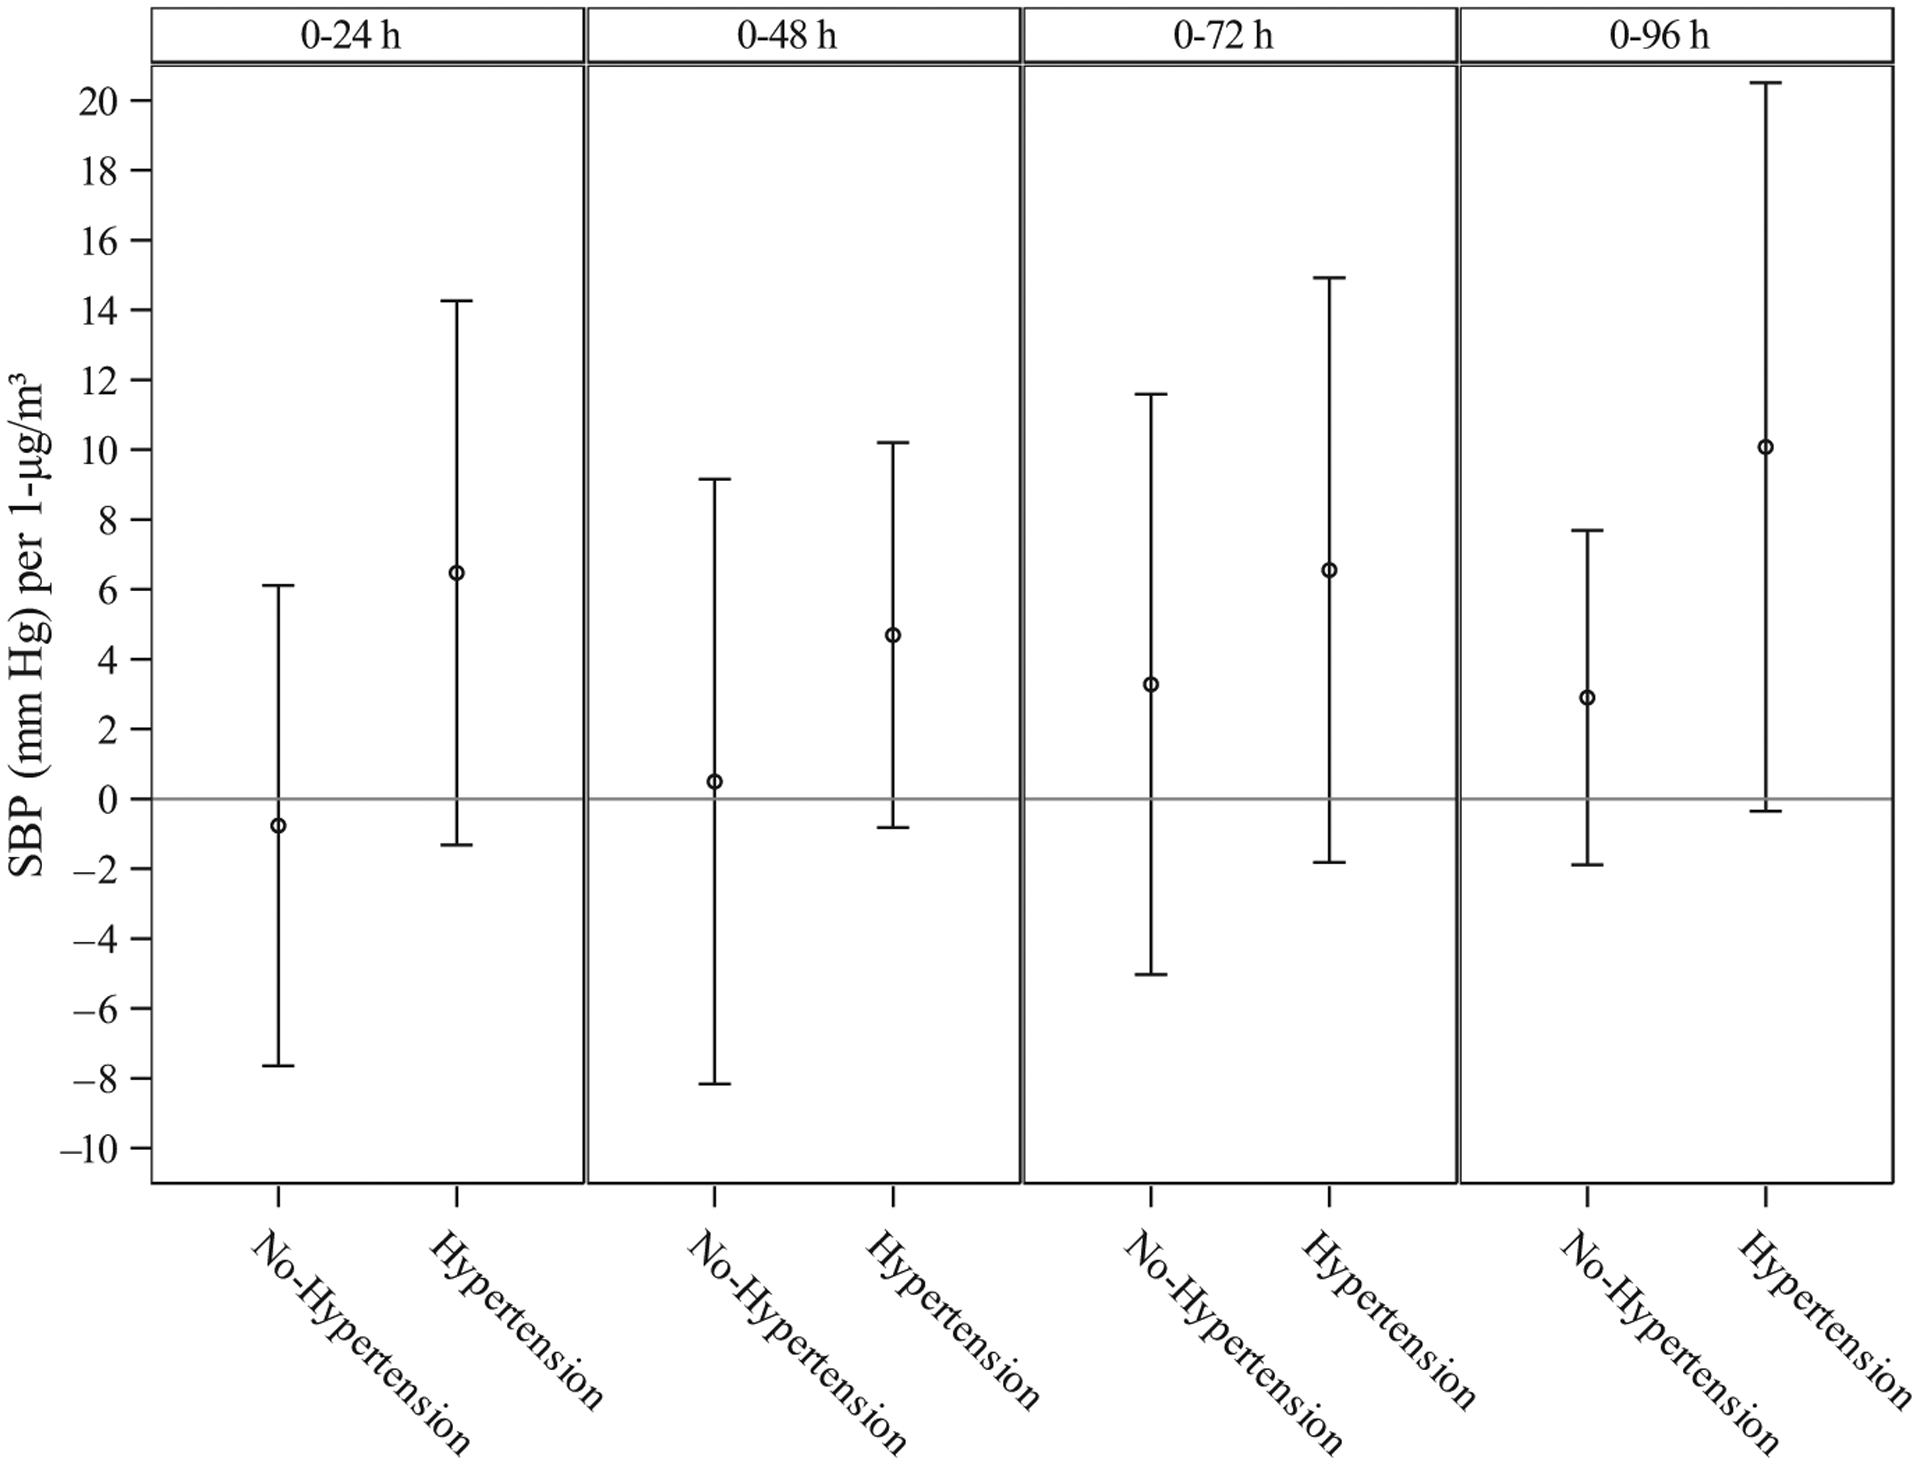
Adjusted association between a 1 μg/m3 increase in black carbon and systolic blood pressure (mm Hg), stratified by hypertension status†)
To investigate the shape of the distribution of black carbon’s effects, we modeled cumulative average hourly black carbon concentration from 0 to 96 hours prior to blood pressure measurement. As shown in Figure 2, there is an initial acute response (0–1 hour), a 3.19 mm Hg increase in systolic blood pressure, followed by a decline in blood pressure response until approximately 20 hours when blood pressure gradually increases and stabilizes at 36 hours. From 36 hours to approximately 90 hours, the association is constant at approximately 5 mm Hg increase in systolic blood pressure per 1 unit increase in black carbon. An interesting observation is that cumulative black carbon concentration fluctuates very little; the cumulative average concentration ranged from 0.42 to 0.62 μg/m3 (data not shown) across the 96 time periods.
FIGURE 2.
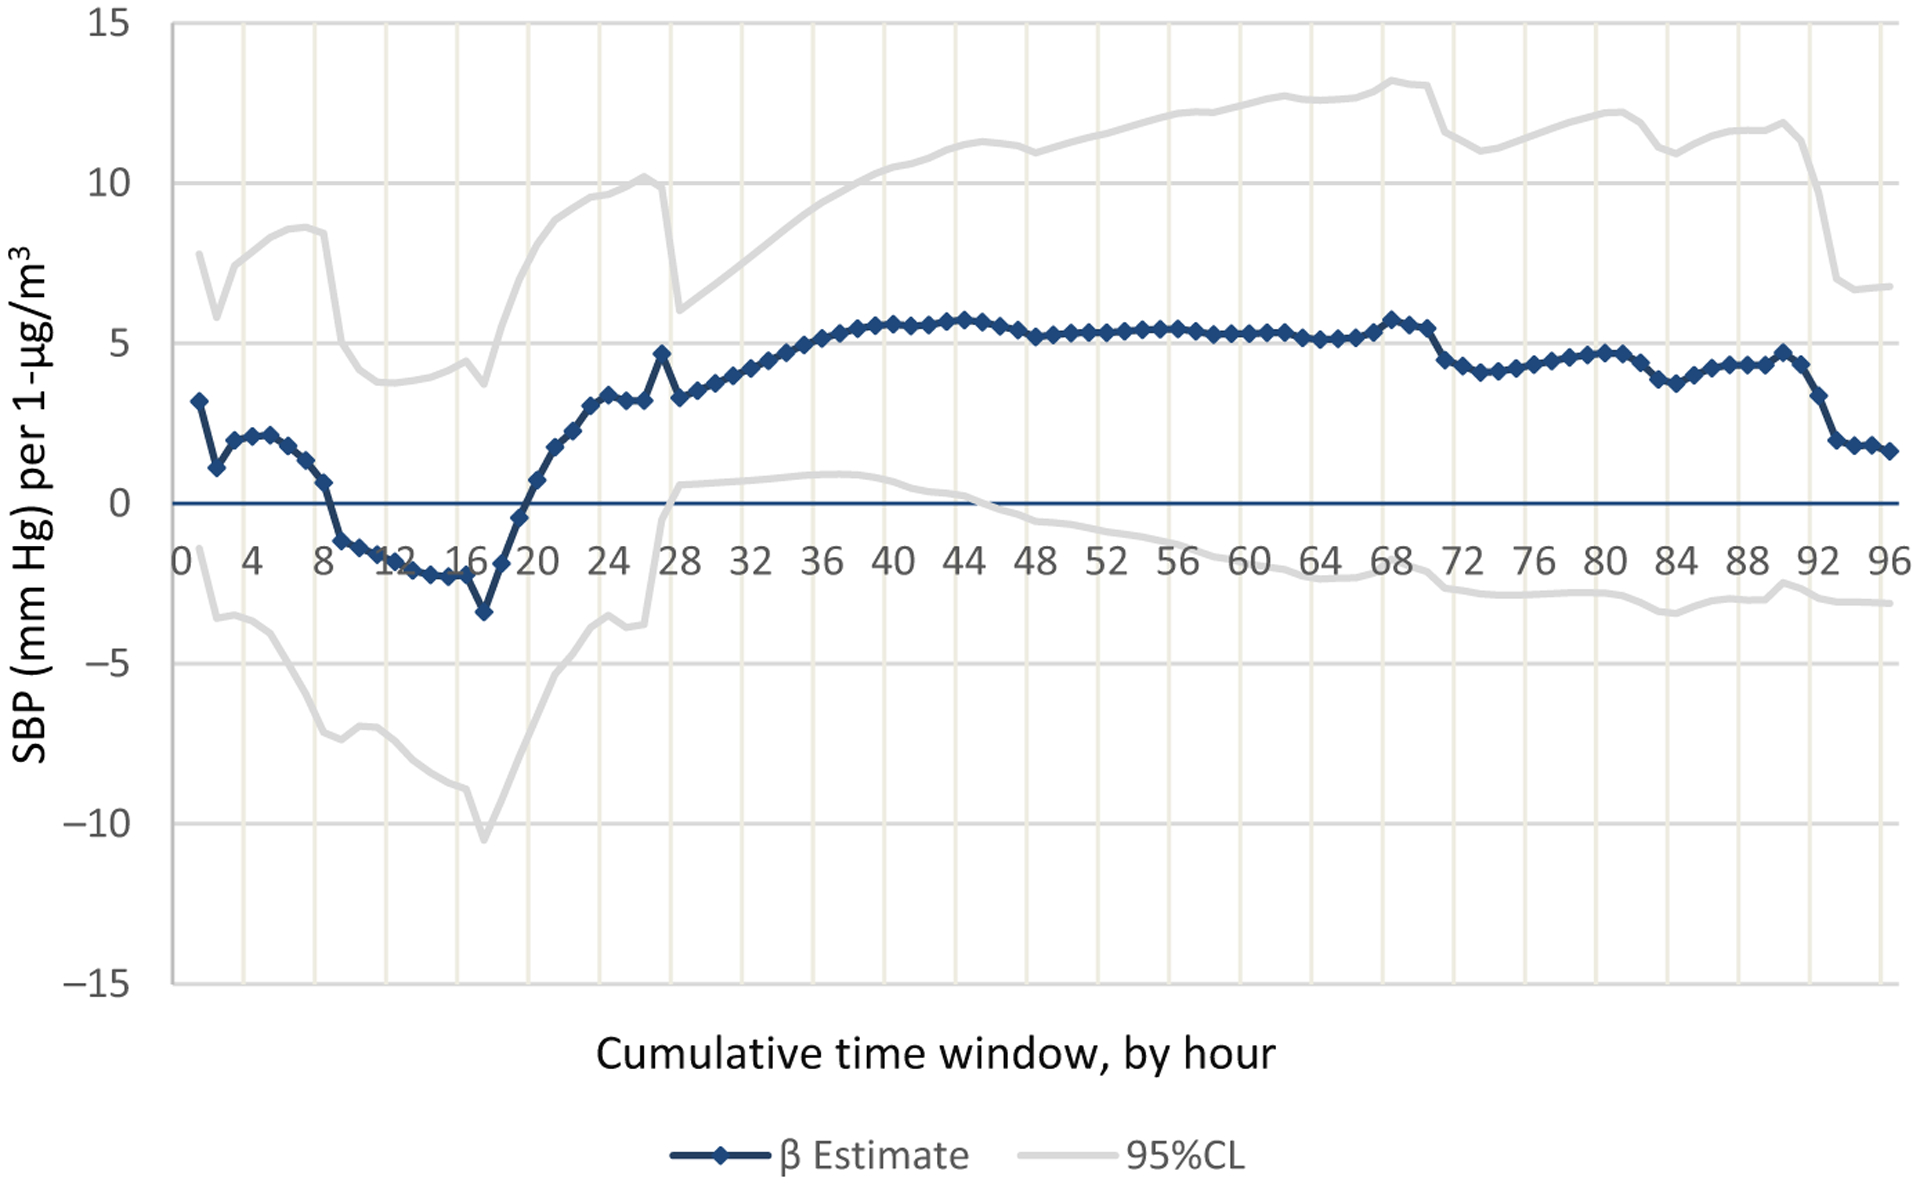
Distribution of black carbon’s effects (β estimate) on systolic blood pressure with 1-h increases in cumulative black carbon concentration
4 |. DISCUSSION
When both black carbon and particulate mass concentration are measured, the health effects associated with exposure to black carbon have often been found to be more robust than those associated with exposure to PM2.5 or PM10; therefore, there is increasing interest in its role in promoting cardiovascular disease.15,20,21 Indoor and outdoor sources of air pollution differ. Outdoor sources include anthropogenic activities, biomass, forest fires, and vehicular emissions, while indoor sources include infiltration from outdoors, combustion (stoves, candles, and kerosene lamps), and smoking. In one study, it has been estimated that outdoor infiltration explains between 33% and 42% of the variability in indoor black carbon concentration suggesting that outdoor levels are not likely to be a good representation of indoor levels.29 While there is a growing body of literature on ambient black carbon, there are limited studies on indoor air with the majority of those being conducted in populations where the use of biomass fuels is common resulting in very high exposure levels. To our knowledge, this is the first report of real-time black carbon exposure and blood pressure in an unselected study population.
Our results show that increasing exposure to black carbon in the home is associated with increased systolic blood pressure. The data also show that exposure 0–72 hours prior to blood pressure measurement (and in particular 24–48 hours prior) is associated with the greatest increase. The association was found in unadjusted models, in models adjusted for important covariates, and when black carbon was measured either as a cumulative average or as a lagged exposure. Of note is that the black carbon concentration was relatively constant over the monitoring period; therefore, we attribute the association with blood pressure to the impact of black carbon at a particular time point rather than being in response to a peak exposure period.
Black carbon levels ranged from 0.05 to 8.09 μg/m3 with an average of 0.60 μg/m3. Daily averages ranged from 0.48 to 0.78 μg/m3 over the sampling period (Table 1B). These levels are well below those measured in studies assessing the use of biomass fuel during cooking sessions where levels averaged as much as 56 μg/m3.19,20,22
Adjusting for factors associated with increased blood pressure resulted in a stronger association between black carbon and systolic blood pressure for all exposure windows. In adjusted models, we found that cumulative exposure 0–48 hours prior to blood pressure was associated with a 5.91 mm Hg increase in systolic blood pressure and cumulative exposure 0–72 hours with a 7.55 mm Hg increase in systolic blood pressure. These results are consistent with the only other non-cooking study of black carbon and blood pressure. In that study, average black carbon was 0.36 μg/m3 (a bit lower than our average of 0.60 μg/m3) and a 1 μg/m3 increase in black carbon was associated with a 18.0 mm Hg increase in systolic blood pressure (*rescaled).21 There are also studies of outdoor air with results consistent with ours. For example, a study conducted in Boston found that a 1 μg/m3 increase in black carbon was associated with a 8.25 mm Hg increase in systolic blood pressure (rescaled by Magalhaes).18 The average 1-year black carbon level in that study was 0.32 μg/m3.30 In another study of outdoor black carbon, Wilker et al found a 7.33 mm Hg increase in BP with a 1 μg/m3 increase in BC (average concentration, 0.98 μg/m3).31 The effect appears to be more pronounced in individuals with hypertension, although these results should be interpreted with caution given small sample size.
There are several hypothesized mechanisms for the association between air pollution and increased blood pressure. Both observational and experimental studies have shown that when particles are inhaled into the lungs, an inflammatory response is triggered within the alveolae with subsequent systemic inflammation resulting in detrimental vascular effects.32 For individuals with hypertension, inflammatory responses generate oxidative stress in the vascular wall leading to endothelial dysfunction.33 Therefore, the joint effect from air pollution and hypertension, through the vascular oxidative stress and inflammation pathway, could make hypertensive patients a more vulnerable subgroup. We did not find a relationship with diastolic blood pressure in contrast to some other studies. Despite differences in study design, exposure methodology, and target populations, the data consistently show evidence of a relationship between black carbon and systolic blood pressure—particularly in populations of older adults and in individuals with pre-existing conditions.
The shape of the distribution showing the relationship between the hourly concentration of cumulative black carbon on systolic blood pressure (Figure 2) gives the blood pressure response to black carbon at different windows of exposure. Although the estimated change appears to be erratic in the first day, the association stabilizes around 24 hours. This may explain the disparate results seen in previous studies of black carbon and blood pressure which were primarily limited to an exposure window 0–24 hours prior to blood pressure measurement. The variation of effects may be due to the time required for the biological mechanisms involved in the black carbon-blood pressure pathway to take effect. Although the relatively small sample size should be taken into consideration, these results provide insight into the most important exposure windows to consider in future studies of black carbon and blood pressure.
This study has several strengths and adds important information to the growing body of evidence on the impact of short-term exposure to black carbon on blood pressure. Strengths include the general population sample of children, adults, and individuals with and without pre-existing conditions and the focus on indoor air which has rarely been studied despite the large amount of time individuals spend indoors. Other strengths include the high temporal resolution of black carbon monitoring allowing for the examination of numerous time frames over a 5-day period, high retention rates which limits the potential for selection bias, and the inclusion of numerous important covariates. The study is limited by the measurement of blood pressure at one time point and the inability to adequately assess the role of hypertension due to small sample size. Use of a convenience sample may limit generalizability, and although numerous covariates were considered, not all risk factors (eg, lipid levels, diet, and caffeine use) were included. Another limitation is the lack of direct measurement of the amount of time study participants spent in the home. Consistent with previous studies, we rely on national estimates that conclude Americans spend the majority of their time indoors with the majority of that time in their own home. These data are widely cited as valid estimates in the absence of individual exposure data.34 Related to time spent at home, the study is also limited by lack of data on indoor temperature. However, when 30 participants with indoor temperature data were analyzed, the average indoor temperature was 71°F (range 63°–82°). For this sub-sample, indoor temperature did not show a significant effect (β = −0.66; 95% CI −1.87, 0.55) with blood pressure in bivariate analyses, although the small sample size may have reduced power to detect meaningful differences. Previous studies have shown there is a high correlation (r = 0.91) between indoor and outdoor temperature when outdoor temperatures are above 12.7°C (55°F).35 Given that 90% of blood pressure measurements were taken on days above this temperature, and given that outdoor temperature was included in our models, we do not think lack of adjustment for indoor temperature biases the results.
Both high blood pressure and exposure to air pollution are strong, independent risk factors for numerous cardiovascular diseases including stroke, heart failure, and myocardial infarction. Given the high prevalence of these risk factors in populations around the world, our main result, an association with indoor exposure at levels commonly found in the general population, is an important public health finding.
5 |. CONCLUSION
We found that increasing levels of black carbon in the home are associated with increased systolic (but not diastolic) blood pressure. Individuals with hypertension may be a more susceptible subpopulation. Further research on the impact of indoor exposure to black carbon is warranted.
Practical Implications.
Black carbon concentration over the 120-hour sampling period ranged from 0.05 to 8.09 μg/m3, and the average lag time black carbon concentration (expressed in 24-hour lag periods) was relatively constant. Average concentration ranged from 0.48–0.78 μg/m3.
For all exposure windows assessed, increasing black carbon was associated with increasing systolic blood pressureafter adjustment for important covariates
The black carbon concentration in the period 0–72 hours prior to blood pressure measurement was associated with the greatest increase in systolic blood pressure (7.55 mm Hg per 1 μg/m3 change in BC).
Black carbon was not associated with diastolic blood pressure.
Individuals with hypertension may be a susceptible subpopulation.
More research is needed on the impact of indoor air pollution at levels typically found in homes on blood pressure.
ACKNOWLEDGEMENTS
We thank Ginger Chew for review of the manuscript, Paul Whelton, for his expertise in blood pressure, Steven and Jeff Blair for the use of the AE51, and study participants for allowing us in their home.
Funding information
This work was supported by the Centers for Disease Control and Prevention, National Center for Environmental Health. Grant Number 1U01EH001130-01., NIEHS. Grant number ES00908
Footnotes
CONFLICT OF INTEREST
None to report.
The peer review history for this article is available at https://publons.com/publon/10.1111/ina.12651
REFERENCES
- 1.GBD 2017 Risk Factor Collaborators. Global, regional, and national comparative risk assessment of 84 behavioural, environmental and occupational, and metabolic risks or clusters of risks for 195 countries and territories, 1990–2017: a systematic analysis for the Global Burden of Disease Study 2017. Lancet. 2018;392(10159):1923–1994. [DOI] [PMC free article] [PubMed] [Google Scholar]
- 2.Miller KA, Siscovick DS, Sheppard L, et al. Long-term exposure to air pollution and incidence of cardiovascular events in women. N Engl J Med. 2007;356(5):447–458. [DOI] [PubMed] [Google Scholar]
- 3.Pope CA III, Burnett RT, Thun MJ, et al. Lung cancer, cardiopulmonary mortality, and long-term exposure to fine particulate air pollution. JAMA. 2002;287(9):1132–1141. [DOI] [PMC free article] [PubMed] [Google Scholar]
- 4.Du Y, Xu X, Chu M, Guo Y, Wang J. Air particulate matter and cardiovascular disease: the epidemiological, biomedical and clinical evidence. J Thoracic Dis. 2016;8(1):E8. [DOI] [PMC free article] [PubMed] [Google Scholar]
- 5.Kelly FJ, Fussell JC. Air pollution and public health: emerging hazards and improved understanding of risk. Environ Geochem Health. 2015;37(4):631–649. [DOI] [PMC free article] [PubMed] [Google Scholar]
- 6.Organization WH. Burden of Disease from air pollution. 2014.
- 7.Brook RD, Rajagopalan S. Particulate matter, air pollution, and blood pressure. J Am Soc Hypertens. 2009;3(5):332–350. [DOI] [PubMed] [Google Scholar]
- 8.Giorgini P, Di Giosia P, Grassi D, Rubenfire M, Brook RD, Ferri C. Air pollution exposure and blood pressure: an updated review of the literature. Curr Pharm Des. 2016;22(1):28–51. [DOI] [PubMed] [Google Scholar]
- 9.Delfino Ralph J, Staimer N, Tjoa T, et al. Air pollution exposures and circulating biomarkers of effect in a susceptible population: clues to potential causal component mixtures and mechanisms. Environ Health Perspect. 2009;117(8):1232–1238. [DOI] [PMC free article] [PubMed] [Google Scholar]
- 10.Thurston GD, Kipen H, Annesi-Maesano I, et al. A joint ERS/ATS policy statement: what constitutes an adverse health effect of air pollution? An analytical framework. Eur Respirat J. 2017;49(1):1600419. [DOI] [PMC free article] [PubMed] [Google Scholar]
- 11.Bellavia A DNA Hypomethylation, Ambient Particulate Matter, and Increased Blood Pressure: Findings From Controlled Human Exposure Experiments (vol 2, e000212, 2013). J Am Heart Assoc. 2013;2(3):1–10. [DOI] [PMC free article] [PubMed] [Google Scholar]
- 12.Yang B-Y, Qian Z, Howard SW, et al. Global association between ambient air pollution and blood pressure: a systematic review and meta-analysis. Environ Pollut. 2018;235:576–588. [DOI] [PubMed] [Google Scholar]
- 13.Kelly FJ, Fussell JC. Size, source and chemical composition as determinants of toxicity attributable to ambient particulate matter. Atmos Environ. 2012;60:504–526. [Google Scholar]
- 14.Northcross AL, Hwang N, Balakrishnan K, Mehta S. Assessing exposures to household air pollution in public health research and program evaluation. EcoHealth. 2015;12(1):57–67. [DOI] [PMC free article] [PubMed] [Google Scholar]
- 15.Janssen MEG-N NAH,Lanki T, Salonen RO, Cassee FR, Hoek G, Fischer P, van Bree Brunekreef B, Krzyzanowski M. Health Effects of Black Carbon: Joint World Health Organization (WHO)/Convention Task Force on Health Aspects of Air Pollution, World Health Organization, Regional Office for Europe, Copenhagen, Denmark; 2012.
- 16.Janssen NAH, Hoek G, Simic-Lawson M, et al. Black carbon as an additional indicator of the adverse health effects of airborne particles compared with PM. Environ Health Perspect. 2011;119(12):1691–1699. [DOI] [PMC free article] [PubMed] [Google Scholar]
- 17.Luben TJ, Nichols JL, Dutton SJ, et al. A systematic review of cardiovascular emergency department visits, hospital admissions and mortality associated with ambient black carbon. Environ Int. 2017;107:154–162. [DOI] [PMC free article] [PubMed] [Google Scholar]
- 18.Magalhaes S, Baumgartner J, Weichenthal S. Impacts of exposure to black carbon, elemental carbon, and ultrafine particles from indoor and outdoor sources on blood pressure in adults: A review of epidemiological evidence. Environ Res. 2018;161:345–353. [DOI] [PubMed] [Google Scholar]
- 19.Norris C, Goldberg MS, Marshall JD, et al. A panel study of the acute effects of personal exposure to household air pollution on ambulatory blood pressure in rural Indian women. Environ Res. 2016;147:331–342. [DOI] [PubMed] [Google Scholar]
- 20.Baumgartner J, Zhang Y, Schauer JJ, Huang W, Wang Y, Ezzati M. Highway proximity and black carbon from cookstoves as a risk factor for higher blood pressure in rural China. Proc Natl Acad Sci. 2014;111(36):13229. [DOI] [PMC free article] [PubMed] [Google Scholar]
- 21.Liu L, Ruddy T, Dalipaj M, et al. Effects of indoor, outdoor, and personal exposure to particulate air pollution on cardiovascular physiology and systemic mediators in seniors. J Occup Environ Med. 2009;51(9):1088–1098. [DOI] [PubMed] [Google Scholar]
- 22.Baumgartner J, Carter E, Schauer JJ, et al. Household air pollution and measures of blood pressure, arterial stiffness and central hae-modynamics. Heart. 2018;104(18):1515–1521. [DOI] [PubMed] [Google Scholar]
- 23.Morawska L, He C, Hitchins J, Gilbert D, Parappukkaran S. The relationship between indoor and outdoor airborne particles in the residential environment. Atmos Environ. 2001;35(20):3463–3473. [Google Scholar]
- 24.Adgate JL, Ramachandran G, Pratt GC, Waller LA, Sexton K. Spatial and temporal variability in outdoor, indoor, and personal PM2.5 exposure. Atmos Environ. 2002;36(20):3255–3265. [Google Scholar]
- 25.McGill HC, McMahan CA, Gidding SS. Preventing heart disease in the 21st century. Circulation. 2008;117(9):1216–1227. [DOI] [PubMed] [Google Scholar]
- 26.Chen X, Wang Y. Tracking of blood pressure from childhood to adulthood. Circulation. 2008;117(25):3171–3180. [DOI] [PMC free article] [PubMed] [Google Scholar]
- 27.Centers for Disease Control and Prevention. National Health and Examination Survey (NHANES) Health Tech/Blood Pressure Procedures Manual. May 2009.
- 28.Wang Q, Li C, Guo Y, et al. Environmental ambient temperature and blood pressure in adults: A systematic review and meta-analysis. Sci Total Environ. 2017;575:276–286. [DOI] [PubMed] [Google Scholar]
- 29.Tunno BJ, Shields KN, Cambal L, et al. Indoor air sampling for fine particulate matter and black carbon in industrial communities in Pittsburgh. Sci Total Environ. 2015;536:108–115. [DOI] [PubMed] [Google Scholar]
- 30.Schwartz J, Alexeeff SE, Mordukhovich I, et al. Association between long-term exposure to traffic particles and blood pressure in the Veterans Administration Normative Aging Study. Occup Environ Med. 2012;69(6):422–427. [DOI] [PMC free article] [PubMed] [Google Scholar]
- 31.Wilker EH, Baccarelli A, Suh H, Vokonas P, Wright RO, Schwartz J. Black carbon exposures, blood pressure, and interactions with single nucleotide polymorphisms in MicroRNA processing genes. Environ Health Perspect. 2010;118(7):943–948. [DOI] [PMC free article] [PubMed] [Google Scholar]
- 32.Brook RD, Rajagopalan S, Pope CA, et al. Particulate matter air pollution and cardiovascular disease. Circulation. 2010;121(21):2331–2378. [DOI] [PubMed] [Google Scholar]
- 33.Crowley SD. The cooperative roles of inflammation and oxidative stress in the pathogenesis of hypertension. Antioxid Redox Signal. 2014;20(1):102–120. [DOI] [PMC free article] [PubMed] [Google Scholar]
- 34.Klepeis NE, Nelson WC, Ott WR, et al. The National Human Activity Pattern Survey (NHAPS): a resource for assessing exposure to environmental pollutants. J Expo Anal Environ Epidemiol. 2001;11(3):231–252. [DOI] [PubMed] [Google Scholar]
- 35.Nguyen JL, Schwartz J, Dockery DW. The relationship between indoor and outdoor temperature, apparent temperature, relative humidity, and absolute humidity. Indoor Air. 2014;24(1):103–112. [DOI] [PMC free article] [PubMed] [Google Scholar]