

Abstract
Purpose
To compare carbon‐13 (13C) MRSI of hyperpolarized [1‐13C]pyruvate metabolism in a murine tumor model with mass spectrometric (MS) imaging of the corresponding tumor sections in order to cross validate these metabolic imaging techniques and to investigate the effects of pyruvate delivery and tumor lactate concentration on lactate labeling.
Methods
[1‐13C]lactate images were obtained from tumor‐bearing mice, following injection of hyperpolarized [1‐13C]pyruvate, using a single‐shot 3D 13C spectroscopic imaging sequence in vivo and using desorption electrospray ionization MS imaging of the corresponding rapidly frozen tumor sections ex vivo. The images were coregistered, and levels of association were determined by means of Spearman rank correlation and Cohen kappa coefficients as well as linear mixed models. The correlation between [1‐13C]pyruvate and [1‐13C]lactate in the MRS images and between [12C] and [1‐13C]lactate in the MS images were determined by means of Pearson correlation coefficients.
Results
[1‐13C]lactate images generated by MS imaging were significantly correlated with the corresponding MRS images. The correlation coefficient between [1‐13C]lactate and [1‐13C]pyruvate in the MRS images was higher than between [1‐13C]lactate and [12C]lactate in the MS images.
Conclusion
The inhomogeneous distribution of labeled lactate observed in the MRS images was confirmed by MS imaging of the corresponding tumor sections. The images acquired using both techniques show that the rate of 13C label exchange between the injected pyruvate and endogenous tumor lactate pool is more correlated with the rate of pyruvate delivery to the tumor cells and is less affected by the endogenous lactate concentration.
Keywords: hyperpolarized 13C MRI, lactate, mass spectrometry imaging, pyruvate, tumor
1. INTRODUCTION
Carbon‐13 (13C) MRSI of hyperpolarized 13C‐labeled cell substrates enables rapid noninvasive imaging of tissue metabolism in vivo, 1 , 2 with lactate dehydrogenase‐catalyzed 13C label exchange between injected [1‐13C]pyruvate and the endogenous lactate pool being the most studied metabolic reaction. Hyperpolarized [1‐13C]pyruvate has been used clinically with promising applications, such as disease staging in prostate cancer, 3 , 4 and for detecting tumor treatment response. 5 , 6 However, the transient nature of the hyperpolarization means that only relatively rapid metabolic reactions can be studied, and it is difficult to relate signal intensity to concentration, which means that typically only apparent first‐order rate constants describing isotope flux are quoted rather than metabolically relevant fluxes. 7
Mass spectrometry imaging (MSI) of excised tissue sections acquires a mass spectrum for each pixel of the image. The ability to perform chemical imaging in a nontargeted and label‐free way 8 makes it a good discovery tool in the field of biology and biomedicine. 9 The distribution of particular ions can be visualized, or a more explorative approach can be employed, leveraging clustering analysis to delineate regions of similar metabolic phenotype. In contrast to MRI, the higher spatial resolution enables direct comparison between the MS image and histological images of the same or adjacent tissue sections. MSI has been used to search for novel tumor biomarkers and to better visualize tumor margins. 10 , 11 The limitations of MSI include a strong dependence of the signals on sample collection and processing and the difficulty of acquiring quantitative data due to the dependence of signal intensity on the chemical and morphological environment of the location of interest. 12 , 13 , 14
Combining 13C MRSI of hyperpolarized 13C‐labeled substrates with MSI offers new opportunities for investigating tumor metabolic phenotypes. Correlating the high spatial resolution MS images with the dynamic 3D MRS images acquired following injection of hyperpolarized [1‐13C]pyruvate can provide a better understanding of the underlying biology affecting lactate labeling kinetics while at the same time providing an opportunity to cross validate the 2 techniques.
2. METHODS
2.1. Animal experiments
Experiments were performed in compliance with a project license issued under the Animals (Scientific Procedures) Act of 1986. For validation of a rapid freezing method, kidneys of female C57BL/6 mice were excised and either freeze‐clamped using liquid nitrogen‐cooled tongs or immersed in liquid nitrogen‐cooled isopentane. For the tumor model, female C57BL/6 mice were injected subcutaneously with 5 × 10⁶ EL4 murine lymphoma cells in 200 μL fetal bovine serum and the tumors grown for 8 to 11 days.
2.2. Phosphorus‐31 NMR of tissue extracts
Kidney samples were homogenized in a Precellys homogenizer (Bertin Instruments, Montigny‐le‐Bretonneux, France) with 10 µL/mg 2M perchloric acid, centrifuged at 13 thousand g for 2 minutes at 4°C and the supernatant neutralized using 2M potassium hydroxide. The supernatants were lyophilized and dissolved in 550 µL deuterium oxide containing methylenediphosphonic acid at 100 nmol/g tissue. Proton decoupled phosphorus‐31 NMR spectra were acquired into 32,768 data points with a 90° pulse, 7.2 s TR, and spectral width of 57 ppm (14,006 Hz) and were the sum of 8 thousand transients.
2.3. Hyperpolarized [1‐13C]pyruvate imaging
44 mg [1‐13C]pyruvic acid (Cambridge Isotope Laboratories, Tewksbury, MA) were mixed with 15 mM OX063 radical (GE Healthcare, Amersham, UK) and 1.4 mM gadoterate meglumine (Dotarem, Guerbet, Villepinte, France) and polarized for ~ 1 h in a HyperSense polarizer (Oxford Instruments, Abingdon, UK) before being dissolved in 6 mL superheated buffer (40 mM Hepes, 94 mM NaOH, 30 mM NaCl, 100 mg/L ethylenediaminetetraacetic acid) at 10 bar, and 400 μL were injected immediately into the mouse tail vein.
T2‐weighted axial hydrogen‐1 (1H) 1H MR images (16 × 40 × 40 mm2, 1.25 mm thick slices) were acquired with a fast spin echo sequence. Images were reconstructed from 8 echoes with a 256 × 256 data matrix, TR 2 s, TE 48 ms. Following intravenous injection of hyperpolarized [1‐13C]pyruvate, 13C images were acquired with a single‐shot 3D volume imaging sequence. 15 Spectral spatial pulses excited alternately the [1‐13C]pyruvate and [1‐13C]lactate resonances, with flip angles of 7° and 45°, respectively. Signal was acquired from a 40 × 40 × 20 mm3 volume with a matrix size of 32 × 32 × 16 data points using a stack of spiral acquisitions. The TR was 1 s so that each metabolite was imaged every 2 s over a period of 90 s. The eighth pair of acquisitions were performed without phase encoding in the third dimension and were used as a reference scan for image reconstruction.
2.4. Mass spectrometry imaging
Mice were snap‐frozen in liquid nitrogen‐cooled isopentane immediately following the MRI acquisition. Ten‐μm thick sections of animals injected with [1‐13C]pyruvate and noninjected controls were cut on a Leica cryostat (Leica Biosystems, Nussloch, Germany) and thaw‐mounted onto superfrost slides (Thermo Scientific, Bremen, Germany). The sections were air‐dried and vacuum‐packed for storage at −80°C prior to MSI. 16 For MSI, the slides were warmed to room temperature and immersed in chloroform for 1 min 45 s. MSI was performed using a Q‐Exactive plus mass spectrometer (Thermo Scientific) with an automated desorption electrospray ionization (DESI) ion source (Prosolia Inc., Zionsville, IN). Data were acquired in negative ion mode between m/z 80 and 500. The nominal mass resolution was set to 70 thousand. The injection time was 150 ms, resulting in a scan rate of 3.8 pixel/s. A home‐built DESI sprayer 17 was operated with a mixture of 95% methanol/5 % water at 1.5 µL/min and nebulized with nitrogen at a back pressure of 6 bar. The spatial resolution was 100 µm. Sections were then stained with hematoxylin and eosin and imaged on an Aperio scanner (Leica Biosystems, Wetzlar, Germany).
2.5. Data analysis
MRI data were processed using an in‐house MatLab (version R2019b, MathWorks, Natick, MA) script. 15 The MSI .raw data files were converted into .mzML files using ProteoWizard msConvert version 3 (open source) 18 and compiled into an .imzML file. 19 Subsequent data processing was performed in SCiLS Lab (version 2019c, Bruker Daltonik, Bremen, Germany). Data were analyzed following RMS normalization to compensate for pixel‐to‐pixel variability and data variation between experiments. 20 The relative distributions of [12C] and [1‐13C]lactate were visualized following hotspot removal and weak denoising.
The [1‐13C]lactate MS images were coregistered with the 1H MRI anatomical images using a custom MatLab script (version R2019b, MathWorks). The tumor in the MS image and the corresponding anatomical MR image were contoured manually to yield binary masks, which were first coregistered by affine transformation using the imregister() function. The registration was then fine‐tuned with the imregdemons() function. Nonspatial and spatial statistical techniques were used to quantify the level of association between the coregistered images. For each section, the level of association between the tumor [1‐13C]lactate MS and MRS images was defined by means of the Spearman rank correlation on the raw pixel intensities (estimated by means of the cor function in R) and the Cohen kappa coefficient 21 , 22 on standardized intensities (obtained by categorizing the raw intensities in 20 quantile based levels, estimated by means of the function cohen.kappa of the R package “psych”). One‐sided t tests were used to assess if the mouse mean association levels were greater than 0 (by means of the t.test R function). Linear mixed models (fitted using the lme function of R package nlme) were then used to predict the standardized MSI intensities by means of the MRI intensities, with mice and tumors as hierarchical random effects to take the within‐mouse and within‐tumor dependence into account and assuming a spherical correlation structure for the residuals. 23 , 24 Sensitivity analyses considering other spatial dependence structures led to similar conclusions. Significance of the relationship between MRI and MSI was assessed by means of a Wald t test on the MRI fixed effect parameter estimate.
Pearson and Spearman correlation coefficients were used to assess the correlation between the [1‐13C]lactate and [1‐13C]pyruvate MR images and Pearson correlation coefficients between the [12C] and [1‐13C]lactate MS images. 25 Voxel signal intensities in the dynamic 13C MRSI data were summed for all those time points where the signal was greater than 10% of the maximum signal. For each slice, a region of interest was drawn around the tumor, and the corr2 MatLab function (version R2019b, MathWorks) was used to calculate the Pearson and Spearman correlation coefficients between the summed lactate and pyruvate signal intensities for that individual slice.
3. RESULTS
A comparison of the freezing efficiency of immersion in liquid isopentane versus freeze‐clamping was performed by freezing mouse kidneys using the 2 techniques and measuring the adenosine triphosphate:adenosine diphosphate ratio in the resulting extracts using phosphorus‐31 NMR. Both techniques preserved a relatively high adenosine triphosphate:adenosine diphosphate ratio, demonstrating fast arrest of kidney metabolism (Figure 1). Immersion in precooled liquid isopentane was preferred as it preserved tissue architecture. Therefore, for subsequent experiments, mice with subcutaneous EL4 tumors were snap‐frozen by direct immersion in liquid nitrogen‐cooled isopentane (Figure 2).
FIGURE 1.

Assessment of the efficiency of freezing protocols for rapid arrest of tissue metabolism. Representative 31P NMR spectra of kidney extracts where paired kidneys had been freeze‐clamped using liquid nitrogen‐cooled tongs (A) or immersed in liquid nitrogen‐cooled liquid isopentane (B). The concentrations of ATP and ADP and the ATP:ADP ratio in kidneys frozen by clamping or immersion are shown in (C) and (D), respectively. 31P, phosphorus‐31; ADP, adenosine diphosphate; AMP, adenosine monophosphate; ATP, adenosine triphosphate
FIGURE 2.

Anatomical imaging was performed while [1‐13C]pyruvate was being hyperpolarized. Following dissolution, the hyperpolarized [1‐13C]pyruvate was injected into the tail vein of the mouse and spectroscopic imaging performed. Immediately after image acquisition, the mouse was snap‐frozen, followed by whole mouse sectioning, MS, and histological imaging. Abbreviations: 13C, carbon‐13; DESI MSI, desorption electrospray ionization mass spectrometric imaging; H&E, hematoxylin and eosin; IHC, immunohistochemistry
Following injection of hyperpolarized [1‐13C]pyruvate into an EL4 tumor‐bearing mouse, 16 axial images of [1‐13C]lactate and [1‐13C]pyruvate were acquired using a single‐shot, 3D volume imaging sequence.15 The subcutaneous tumors showed pyruvate uptake and conversion to lactate, with consistently a region of high 13C lactate signal intensity at the tumor base (Figures 3 and 4) (Supporting Information Figure S1). [1‐13C]lactate and [12C]lactate were detected in excised tumor sections by DESI MSI and metabolic maps generated from their peak intensities (Figure 3 and Supporting Information Figure S1). Animals not injected with [1‐13C]pyruvate served as controls for the natural isotopic abundance of [13C]lactate and to confirm assignment of the [1‐13C]lactate peak. Similarly to the MR images, the [1‐13C]lactate distribution measured by MSI showed higher signal intensity at the base of the tumors (Figures 3 and 4). We were unable to detect [1‐13C]pyruvate or unlabeled pyruvate. In previous studies in this tumor model, we were also unable to detect 13C‐labeled or unlabeled pyruvate using 1H and 13C NMR measurements on tumor extracts. 7
FIGURE 3.

A single‐shot 3D 13C MRSI sequence was used to acquire [1‐13C]lactate (A) and [1‐13C]pyruvate images (B) following injection of hyperpolarized [1‐13C]pyruvate (images from a single slice are shown). 13C image intensities were normalized to the maximum intensity across the whole tumor volume, and images of the summed signal over time for each of the 16 individual slices were overlaid on the corresponding anatomical T2‐weighted axial 1H images (D). (E) Maps of [12C] and [1‐13C]lactate generated by MSI of a frozen section taken from the same slice from which the 13C MRS images shown in (A, B, and D) were acquired. A slice from a noninjected control mouse is also shown for comparison. The MS images were coregistered with those generated by 13C MRSI by manual registration in the z‐direction of the histological (C) and T2‐weighted MR images (D) using anatomical landmarks and the tumor outline. 1H, hydrogen‐1. 12C, carbon‐12
FIGURE 4.

Correlation of metabolic images generated by MSI with images of hyperpolarized [1‐13C]lactate generated by 13C MRSI. A, Paired [1‐13C]lactate MRSI slices and corresponding MSI sections from 3 of the mice used in the study (the lowest pair of images are the same as those in Figure 3). B, Correlation of [1‐13C]lactate signal intensities in the tumor region in the MS and MRS images, as quantified by pixelwise Spearman rank correlation (ρ) and Cohen kappa coefficient (κ) analysis. Each point corresponds to the correlation coefficient calculated from all tumor‐containing pixels of each section/slice comparison and the line represents the mean value. The points in blue, red, and green correspond to the coefficients calculated from the top, middle, and bottom image pairs, respectively, in (A). One‐sided 1‐sample t test on the mean values from different mice on both Spearman and Cohen kappa coefficients showed a statistically significant correlation (P = .02)
The 13C MR images of hyperpolarized [1‐13C]lactate were compared with the [1‐13C]lactate MS images of the corresponding excised tissue sections. For each mouse, at least 3 sections were used. The 1H MRI slice corresponding to each MSI section was manually selected using anatomical landmarks within the tumor (Figure 3). The selected slices from the T2‐weighted 1H images, which served as reference images for the 13C MRS images, were then coregistered with the MS images. The positive correlation between the 13C lactate MS and MR images, as measured by means of Spearman rank correlation and Cohen weighted kappa estimates, was statistically significant (Figure 4). Based on the Landis and Koch interpretation of Cohen weighted kappa coefficients, 26 the association in this case is “fair” on average. This is expected given that the data were generated by different modalities with different spatial resolutions, and more importantly, the comparison was made between intact tissue in vivo and frozen tissue sections ex vivo. To further validate the significance of the association level between the images generated by the 2 modalities, a linear mixed model—a more powerful parametric analysis able to model the within‐mouse and within‐tumor, and spatial dependence of the MR and MS pixel intensities—was fitted. This showed a highly significant relationship between the MR and MS pixel intensities (P value of 1.75*10−9) but a marginal R‐squared—fraction of variance of MS intensities explained by the MR ones—of 0.11.
The [12C]lactate distribution, as determined by MSI, was consistently different from the [1‐13C]lactate distribution determined by 13C MRSI (Figure 3), indicating that lactate labeling does not simply reflect the endogenous lactate pool size. This was confirmed by comparing the [12C] and [1‐13C]lactate distributions in the MS images, where the low Pearson correlation coefficients confirmed that lactate labeling was not strongly dependent on the endogenous lactate concentration (Figure 5A). A positive control was provided by a noninjected animal, which showed a good correlation between the natural abundance 13C signal and unlabeled lactate ([12C]lactate). The measured lactate isotopic enrichment in control tumors matched the expected theoretical enrichment, and the additional enrichment following injection of hyperpolarized [1‐13C]pyruvate matches what we have measured previously in this tumor model 7 (Figure 5B). Further confirmation came from comparing MS images of several axial sections corresponding to a single MRI slice, where there was no correlation between the distribution of [12C]lactate and [1‐13C]lactate, with the former being more homogeneously distributed than the latter (Figures 5D and S3). Conversely, the 13C MRS images of hyperpolarized [1‐13C]pyruvate and [1‐13C]lactate showed a significantly stronger positive correlation (Figure 5C), suggesting that 13C lactate labeling is limited principally by the availability of labeled pyruvate in this tumor model. Lactate labeling could also be affected by the levels of the coenzyme, nicotinamide adenine dinucleotide (NAD+) and its reduced form (NADH); however, matrix‐assisted laser desorption mass spectrometric imaging showed that nicotinamide adenine dinucleotide (NAD+) and its reduced form (NADH) were homogeneously distributed in these tumors (Supporting Information Figure S2), consistent with the relatively uniform distribution of unlabeled lactate (Figures 3 and 5).
FIGURE 5.
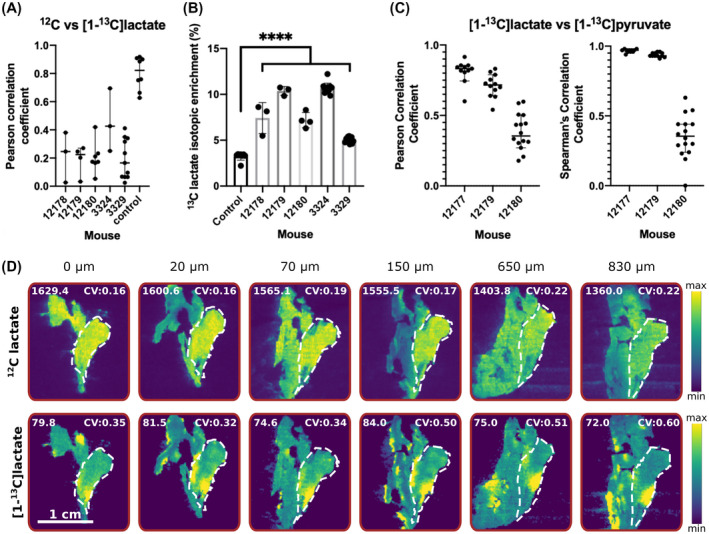
A, Pearson correlation coefficients between endogenous unlabeled lactate ([12C]lactate) and [1‐13C]lactate across all tumor‐containing pixels from all scanned MSI sections for 5 mice injected with hyperpolarized [1‐13C]pyruvate and a control noninjected mouse. The line and bars represent the median correlation coefficient and 95% CI, respectively. B, The percentage [13C]lactate isotopic enrichment for control, noninjected animals, and animals injected with hyperpolarized [1‐13C]pyruvate. Each point represents quantitation of a different section, and the error bars represent the SD on the mean. Dunnet multiple comparisons test was used to compare the isotopic enrichment of experimental animals with the control animal. ****P < .0001. C, Pearson and Spearman correlation coefficients between [1‐13C]lactate and [1‐13C]pyruvate signal intensities in tumor‐containing voxels in the 13C MRS images. Each point corresponds to the correlation coefficient for an individual MRI slice. The line and bars represent the median correlation coefficient and 95% CI, respectively. D, [12C] and [1‐13C]lactate signal intensities in MS images of 6 sections from a 1 mm slice. The intensities are expressed relative to the maximum signal intensity of the individual species. Tumor regions are indicated by a dashed white line. The mean signal intensity of each lactate species across the tumor is indicated for each section as well as the CV. CI, confidence interval; CV, coefficient of variance
4. DISCUSSION
Dynamic 13C MRSI was used to measure the rate of interconversion of pyruvate and lactate in vivo, with a time resolution of 2 s, a nominal spatial resolution of 1.25 × 1.25 × 1.25 mm3, and an effective resolution of 1.25 × 1.25 × 4.5 mm3 when taking into account the z‐direction point spread function. 15 The EL4 tumors showed rapid [1‐13C]pyruvate uptake and very fast conversion to [1‐13C]lactate, as has been observed previously in this tumor model. 27 , 28 Sixteen axial 13C MRSI slices were acquired from each of 3 EL4 tumors and spatial maps of [1‐13C]lactate and [1‐13C]pyruvate were overlaid on the anatomical T2‐weighted 1H MR images. The [1‐13C]lactate signal was largely localized to the tumor and showed a heterogeneous distribution. The mice were snap‐frozen immediately after the MRI acquisition using a freezing technique that rapidly arrested metabolism. The [1‐13C]lactate MS images were thus expected to show a good correlation with the summed [1‐13C]lactate images produced by 13C MRSI; indeed, there was agreement between the 2 (Figure 4).
The significant association between the 13C lactate maps generated by DESI and 13C MRSI suggest that the ionization efficiency was consistent across the whole tumor section. The observed positive correlation between the datasets validates annotation of the metabolites in the MSI data in which isobaric species with the same chemical formula cannot be distinguished from one another. The assignments for the [1‐13C]lactate peak were further validated using negative control tissues, which contained only naturally abundant [13C]lactate.
Coregistration of the MRS and MS images was assisted by taking whole mouse axial sections for MSI. However, changes in morphology due to rapid freezing, the difficulty of taking intact sections through the whole frozen mouse body, and the differences in the thickness of the MSI (10 μm) and MRSI (1.25 mm) slices meant that the excised sections did not match perfectly the MR images. Anatomical landmarks in the tumor, which appeared in both the 1H images and in the hematoxylin and eosin‐stained sections, were used to facilitate manual assignment of MS images to their corresponding MRI slice. The coregistration MatLab (version R2019b, MathWorks) routines were successful in registering the tumor masks, defined by drawing a region of interest around the tumor, by applying rigid and nonrigid transformations. However, in most cases, the tumor outline was distorted, thus limiting the accuracy of the registration. Therefore, the magnitude of the correlation between MS and MR images is an underestimate of the agreement between the 2 imaging modalities. The statistical significance for the correlation between the 2 modalities was confirmed using spatial and nonspatial statistical tools, enabling cross‐validation of the hyperpolarized 13C MRI and MSI techniques.
The exchange of 13C label between pyruvate and lactate in a tumor is dependent on [1‐13C]pyruvate delivery, cell uptake via the monocarboxylate transporters 1 and 4 (MCT1 and MCT4), the concentrations of lactate dehydrogenase and its coenzymes, and the size of the endogenous tumor lactate pool. 30 The relative importance of these factors will likely vary according to tumor type. Previous studies on EL4 cells showed that the activities of the MCTs and lactate dehydrogenase are nearly equally important in determining the exchange velocity. 29 Using MSI, we have shown that in EL4 tumors, the distribution of endogenous tumor lactate and NAD(H) were poorly correlated with lactate labeling but that there was a stronger correlation between the [1‐13C]pyruvate and [1‐13C]lactate signals in the 13C MRS images, suggesting that delivery of labeled pyruvate has the greatest effect on the exchange velocity under these conditions. This does not mean that the activities of the MCTs and lactate dehydrogenase are unimportant; however, it suggests that under these conditions and in this tumor model, pyruvate delivery is more important. A recent clinical study in prostate cancer patients showed positive correlation between MCT1 expression and lactate labeling, 3 and we have shown previously in the EL4 tumor model that the MCT inhibitor, α‐Cyano‐4‐hydroxycinnamic acid (injected at 150 mg kg1), produced a 40% decrease in label exchange. 30
5. CONCLUSION
Hyperpolarized [1‐13C]pyruvate imaging and MSI generated positively correlated tumor images of [1‐13C]lactate following injection of hyperpolarized [1‐13C]pyruvate, thus cross‐validating the 2 techniques. The [1‐13C]lactate maps in the tumor were poorly correlated with the endogenous tumor lactate levels but highly correlated with maps of [1‐13C]pyruvate, suggesting that in this tumor pyruvate delivery has the greatest effect on the rate of lactate labeling.
CONFLICT OF INTEREST
K.M.B. holds patents and has research agreements with GE Healthcare that are relevant to this paper.
Supporting information
FIGURE S1 A single shot three‐dimensional 13C MRSI sequence was used to acquire interleaved [1‐13C]pyruvate (A) and [1‐13C]lactate images (B). Each image is from a nominal 1.25 mm thick axial slice. 13C image intensities were normalized to the maximum intensity of the respective metabolite across the whole volume. These images and the time course of metabolite labeling (C) are from a representative tumor. In (C) absolute signal intensities are shown after summing signal in the tumor region from all the slices. The signal intensity for lactate is much higher than that for pyruvate reflecting the larger flip angle pulse used to excite the lactate resonance. (D) [12C] and [1‐13C]lactate were detected using negative ion mode DESI MSI. The average spectrum from a single section is shown, with the endogenous lactate peak and a smaller 13C lactate peak appearing at 89 and 90 m/z ratios, respectively
FIGURE S2 Representative images of NAD+ (664.1 ppm) and NADH [M+H+] adduct (666.1 ppm) 2 are shown for three different animals. The middle two columns are from the same animal. False color images represent the relative intensity of the indicated ion. The bottom panel shows an overlay of the relative intensities of NAD+ and NADH, where the colocalization of the molecules leads to a yellow color. The tumor region is indicated by the dashed white line
FIGURE S3 Representative MS images of [12C] and [1‐13C]lactate signal intensities in six sections from a 1 mm slice. The intensities are expressed relative to the maximum signal intensity of the individual species. Tumor regions are indicated by a dashed white line. The mean signal intensity of each metabolite across the tumor is indicated for each section as well as the Coefficient of Variance (CV)
ACKNOWLEDGMENT
This is a contribution from the CRUK Grand Challenge Rosetta Consortium.
Fala M, Somai V, Dannhorn A, et al. Comparison of 13C MRI of hyperpolarized [1‐13C]pyruvate and lactate with the corresponding mass spectrometry images in a murine lymphoma model. Magn Reson Med. 2021;85:3027–3035. 10.1002/mrm.28652
Funding information
Supported by Cancer Research UK grants [A25040, A28289, A29580, A25177, A28397]. m.f. was in receipt of a Rosetrees Trust studentship (A1698)
REFERENCES
- 1. Wang ZJ, Ohliger MA, Larson PEZ, et al. Hyperpolarized 13C MRI: state of the art and future directions. Radiology. 2019;291:273‐284. [DOI] [PMC free article] [PubMed] [Google Scholar]
- 2. Hesketh RL, Brindle KM. Magnetic resonance imaging of cancer metabolism with hyperpolarized 13C‐labeled cell metabolites. Curr Opin Chem Biol. 2018;45:187‐194. [DOI] [PubMed] [Google Scholar]
- 3. Granlund KL, Tee SS, Vargas HA, et al. Hyperpolarized MRI of human prostate cancer reveals increased lactate with tumor grade driven by monocarboxylate transporter 1. Cell Metab. 2020;31:105‐114.e103. [DOI] [PMC free article] [PubMed] [Google Scholar]
- 4. Nelson SJ, Kurhanewicz J, Vigneron DB, et al. Metabolic imaging of patients with prostate cancer using hyperpolarized [1‐13C]pyruvate. Sci Transl Med. 2013;5:198ra108. [DOI] [PMC free article] [PubMed] [Google Scholar]
- 5. Aggarwal R, Vigneron DB, Kurhanewicz J. Hyperpolarized [1‐13C]‐pyruvate magnetic resonance imaging detects an early metabolic response to androgen ablation therapy in prostate cancer. Eur Urol. 2017;72:1028‐1029. [DOI] [PMC free article] [PubMed] [Google Scholar]
- 6. Woitek R, McLean MA, Gill AB, et al. Hyperpolarized 13C MRI of tumor metabolism demonstrates early metabolic response to neoadjuvant chemotherapy in breast cancer. Radiol Imaging Cancer. 2020;2:e200017. [DOI] [PMC free article] [PubMed] [Google Scholar]
- 7. Serrao EM, Kettunen MI, Rodrigues TB, et al. Analysis of 13C and 14C labeling in pyruvate and lactate in tumor and blood of lymphoma‐bearing mice injected with 13C‐ and 14C‐labeled pyruvate. NMR Biomed. 2018;31:e3901. [DOI] [PMC free article] [PubMed] [Google Scholar]
- 8. Spengler B. Mass spectrometry imaging of biomolecular information. Anal Chem. 2015;87:64‐82. [DOI] [PubMed] [Google Scholar]
- 9. McDonnell LA, Angel PM, Lou S, Drake RR. Mass spectrometry imaging in cancer research: future perspectives. Adv Cancer Res. 2017;134:283‐290. [DOI] [PubMed] [Google Scholar]
- 10. Calligaris D, Caragacianu D, Liu X, et al. Application of desorption electrospray ionization mass spectrometry imaging in breast cancer margin analysis. Proc Natl Acad Sci USA. 2014;111:15184‐15189. [DOI] [PMC free article] [PubMed] [Google Scholar]
- 11. Santagata S, Eberlin LS, Norton I, et al. Intraoperative mass spectrometry mapping of an onco‐metabolite to guide brain tumor surgery. Proc Natl Acad Sci USA. 2014;111:11121‐11126. [DOI] [PMC free article] [PubMed] [Google Scholar]
- 12. Vaysse P‐M, Heeren RMA, Porta T, Balluff B. Mass spectrometry imaging for clinical research—latest developments, applications, and current limitations. Analyst. 2017;142:2690‐2712. [DOI] [PubMed] [Google Scholar]
- 13. Ellis SR, Bruinen AL, Heeren RM. A critical evaluation of the current state‐of‐the‐art in quantitative imaging mass spectrometry. Anal Bioanal Chem. 2014;406:1275‐1289. [DOI] [PubMed] [Google Scholar]
- 14. Lanekoff I, Stevens SL, Stenzel‐Poore MP, Laskin J. Matrix effects in biological mass spectrometry imaging: identification and compensation. Analyst. 2014;139:3528‐3532. [DOI] [PMC free article] [PubMed] [Google Scholar]
- 15. Wang J, Hesketh RL, Wright AJ, Brindle KM. Hyperpolarized 13C spectroscopic imaging using single‐shot 3D sequences with unpaired adiabatic refocusing pulses. NMR Biomed. 2018;31:e4004. [DOI] [PMC free article] [PubMed] [Google Scholar]
- 16. Swales JG, Dexter A, Hamm G, et al. Quantitation of endogenous metabolites in mouse tumors using mass‐spectrometry imaging. Anal Chem. 2018;90:6051‐6058. [DOI] [PubMed] [Google Scholar]
- 17. Takáts Z, Wiseman JM, Gologan B, Cooks RG. Mass spectrometry sampling under ambient conditions with desorption electrospray ionization. Science. 2004;306:471‐473. [DOI] [PubMed] [Google Scholar]
- 18. Adusumilli R, Mallick P. Data conversion with ProteoWizard msConvert. Methods Mol Biol. 2017;1550:339‐368. [DOI] [PubMed] [Google Scholar]
- 19. Race AM, Styles IB, Bunch J. Inclusive sharing of mass spectrometry imaging data requires a converter for all. J Proteomics. 2012;75:5111‐5112. [DOI] [PubMed] [Google Scholar]
- 20. Buck A, Heijs B, Beine B, et al. Round robin study of formalin‐fixed paraffin‐embedded tissues in mass spectrometry imaging. Anal Bioanal Chem. 2018;410:5969‐5980. [DOI] [PMC free article] [PubMed] [Google Scholar]
- 21. Watson PF, Petrie A. Method agreement analysis: a review of correct methodology. Theriogenology. 2010;73:1167‐1179. [DOI] [PubMed] [Google Scholar]
- 22. Cohen J. A coefficient of agreement for nominal scales. Educ Psychol Measur. 1960;20:37‐46. [Google Scholar]
- 23. Ver Hoef JM. Applied spatial data analysis with R by Bivand RS, Pebesma EJ, and Gomez‐Rubio V. Biometrics. 2009;65:660‐661. [Google Scholar]
- 24. Pinheiro JC, Bates DM. Mixed‐effects models in S and S‐PLUS. New York, NY: Springer; 2000. [Google Scholar]
- 25. McDonnell LA, van Remoortere A, van Zeijl RJM, Deelder AM. Mass spectrometry image correlation: quantifying colocalization. J Proteome Res. 2008;7:3619‐3627. [DOI] [PubMed] [Google Scholar]
- 26. Landis JR, Koch GG. The measurement of observer agreement for categorical data. Biometrics. 1977;33:159‐174. [PubMed] [Google Scholar]
- 27. Day SE, Kettunen MI, Gallagher FA, et al. Detecting tumor response to treatment using hyperpolarized 13C magnetic resonance imaging and spectroscopy. Nat Med. 2007;13:1382‐1387. [DOI] [PubMed] [Google Scholar]
- 28. Kettunen MI, Hu D‐E, Witney TH, et al. Magnetization transfer measurements of exchange between hyperpolarized [1‐13C]pyruvate and [1‐13C]lactate in a murine lymphoma. Magn Reson Med. 2010;63:872‐880. [DOI] [PubMed] [Google Scholar]
- 29. Witney TH, Kettunen MI, Brindle KM. Kinetic modeling of hyperpolarized 13C label exchange between pyruvate and lactate in tumor cells. J Biol Chem. 2011;286:24572‐24580. [DOI] [PMC free article] [PubMed] [Google Scholar]
- 30. Kettunen MI, Kennedy BWC, Hu D‐E, Brindle KM. Spin echo measurements of the extravasation and tumor cell uptake of hyperpolarized [1‐13C]lactate and [1‐13C]pyruvate. Magn Reson Med. 2013;70:1200‐1209. [DOI] [PubMed] [Google Scholar]
Associated Data
This section collects any data citations, data availability statements, or supplementary materials included in this article.
Supplementary Materials
FIGURE S1 A single shot three‐dimensional 13C MRSI sequence was used to acquire interleaved [1‐13C]pyruvate (A) and [1‐13C]lactate images (B). Each image is from a nominal 1.25 mm thick axial slice. 13C image intensities were normalized to the maximum intensity of the respective metabolite across the whole volume. These images and the time course of metabolite labeling (C) are from a representative tumor. In (C) absolute signal intensities are shown after summing signal in the tumor region from all the slices. The signal intensity for lactate is much higher than that for pyruvate reflecting the larger flip angle pulse used to excite the lactate resonance. (D) [12C] and [1‐13C]lactate were detected using negative ion mode DESI MSI. The average spectrum from a single section is shown, with the endogenous lactate peak and a smaller 13C lactate peak appearing at 89 and 90 m/z ratios, respectively
FIGURE S2 Representative images of NAD+ (664.1 ppm) and NADH [M+H+] adduct (666.1 ppm) 2 are shown for three different animals. The middle two columns are from the same animal. False color images represent the relative intensity of the indicated ion. The bottom panel shows an overlay of the relative intensities of NAD+ and NADH, where the colocalization of the molecules leads to a yellow color. The tumor region is indicated by the dashed white line
FIGURE S3 Representative MS images of [12C] and [1‐13C]lactate signal intensities in six sections from a 1 mm slice. The intensities are expressed relative to the maximum signal intensity of the individual species. Tumor regions are indicated by a dashed white line. The mean signal intensity of each metabolite across the tumor is indicated for each section as well as the Coefficient of Variance (CV)