

Abstract
The aim of this study was to validate prostate cancer‐associated genes on transcript level and to assess the prognostic value of the most promising markers by immunohistochemistry. Based on differentially expressed genes found in a previous study, 84 genes were further validated using mRNA expression data and follow‐up information from the Cancer Genome Atlas (TCGA) prostate cancer cohort (n = 497). Immunohistochemistry was used for validation of three genes in an independent, clinically annotated prostatectomy patient cohort (n = 175) with biochemical relapse as endpoint. Also, associations with clinicopathological variables were evaluated. Eleven protein‐coding genes from the list of 84 genes were associated with biochemical recurrence‐free survival on mRNA expression level in multivariate Cox‐analyses. Three of these genes (TSPAN1, ESRP1 and KIAA1324) were immunohistochemically validated using an independent cohort of prostatectomy patients. Both ESRP1 and KIAA1324 were independently associated with biochemical recurrence‐free survival. TSPAN1 was univariately prognostic but failed significance on multivariate analysis, probably due to its strong correlation with high Gleason scores. Multistep filtering using the publicly available TCGA cohort, data of an earlier expression profiling study which profiled 3023 cancer‐associated transcripts in 42 primary prostate cancer cases, identified two novel candidate prognostic markers (ESRP1 and KIAA1324) of primary prostate cancer for further study.
Keywords: Prostate cancer, prognosis, KIAA1324, ESRP1, TSPAN1
Prostate cancer is the most common non‐cutaneous malignant tumour of men in the western world, with estimated 191.930 new cases for 2020 in the United States alone [1]. In the era of personalized medicine, potent prognostic and predictive biomarkers are needed to inform clinicians and patients about the disease course and therapeutic efficacy of the medications [2]. Prognostic biomarkers identify commonly more or less aggressive forms of the cancer with regard to patient survival or other important clinical events, such as recurrence, metastasis or progression. For primary prostate cancer, the most commonly used conventional parameters for clinical risk stratification are digital rectal examination findings, serum prostate‐specific antigen (PSA) levels, tumour extent and most important, Gleason scores. As prostate cancer may show a long and protracted course, and both surgical and radio‐oncological therapies have significant morbidity, identifying patients that may be safely spared immediate active therapy is particularly warranted. This relatively novel strategy of active surveillance makes a reliable risk assessment of the individual patient necessary, as it is only feasible for patients with a very low risk of disease progression. As histological tumour grading alone is insufficient for this risk estimation and suffers from interobserver variability with kappa scores ranging in the inferior to upper‐middle area at best, additional markers are needed to establish a more robust risk estimation. Therefore, identifying prognostic biomarkers for primary prostate cancer still is an important task.
Research on prognostic biomarkers has developed rapidly recently with the appearance of new methods such as next‐generation sequencing, which provides comprehensive data on cancer molecular biology in a few days [3]. In 2005, our group was among the pioneers to publish a study employing sophisticated bioinformatics analysis of custom made array‐based mRNA expression profiles of microdissected prostate cancer and adjacent benign tissues. This study allowed the identification of 98 differentially expressed genes with a possible role in prostate cancer using three different bioinformatic algorithms [4]. This list of genes proved a rich source of research targets in the following years, and several of them have been demonstrated to be diagnostic or prognostic markers (e.g. CD24, ALCAM, AGR2, ADAM9, FASN, GOLM1, CANT1, FOXA1, TARP, TRPM4) in prostate cancer and other tumours [4, 5, 6, 7, 8, 9, 10, 11, 12, 13].
In the current study, we have performed an extensive validation of previously identified prostate cancer‐associated genes using the Cancer Genome Atlas (TCGA) data. We have also carried out further immunohistochemical validation of the prognostic value of the three most promising genes on protein level, using an independent contemporary prostatectomy patient cohort.
Materials and Methods
Extraction and preparation of TCGA data
TCGA normalized mRNA expression data (Illumina HiSeq 2000 RNA Sequencing platform, version 2, data version 28.01.2016) and clinical data were extracted for 497 patients in a prostatectomy cohort with the full spectrum of stages and grades. After exclusion of patients with incomplete clinical information, 408 patients remained with a mean follow‐up time of 24 months (range 2–115 months, median 16.3 months; potential median follow‐up 19 months). Among them, 71 patients experienced biochemical recurrence during follow‐up after a median of 12 months. Fifty‐three benign tissue samples were available from this cohort.
Patient characteristics (Immunohistochemistry cohort)
An independent well‐characterized radical prostatectomy cohort from the University Hospital of Bonn was used for immunohistochemistry studies, as previously described [14]. All patients were treated for primary prostate cancer by radical prostatectomy in the Urology Clinic of University Hospital Bonn in 2000–2008. One hundred seventy‐five patients were included in the current analysis with mean follow‐up of 62 months (range 1–142 months, median 63 months; potential median follow‐up 72.5 months). Fifty patients experienced biochemical recurrence after a median of 26 months (Table 1).
Table 1.
Clinicopathological characteristics of the immunohistochemistry cohort (n = 175)
| Parameters | Absolute | Proportion |
|---|---|---|
| Age, years mean (range) | 64.2 (45–83) | – |
| pT‐category: | ||
| pT2 | 102 | 58.3% |
| pT3 | 69 | 39.4% |
| pT4 | 4 | 2.3% |
| WHO/ISUP grade group | ||
| 1 | 81 | 46.3% |
| 2 | 41 | 23.4% |
| 3 | 15 | 8.6% |
| 4 | 26 | 14.9% |
| 5 | 12 | 6.9% |
| pN‐category 1 | ||
| N0 | 163 | 93.1% |
| N+ | 11 | 6.3% |
| Nx | 1 | 0.6% |
| R‐status | ||
| R0 | 106 | 60.6% |
| R1 | 67 | 38.2% |
| Missing | 2 | 1.2% |
| Availability of data | ||
| TSPAN1 immunohistochemistry | 157 | 89.7% |
| ESRP1 immunohistochemistry | 175 | 100% |
| KIAA1324 immunohistochemistry | 175 | 100% |
| Survival data | 159 | 90.9% |
ISUP, International Society of Uropathology; WHO, World Health Organization.
Often limited or minimal lymph node dissection.
Tissue microarray (TMA) construction
TMA for immunohistochemistry cohort was constructed using 1–5 tumour cores per patient, each 1 mm in diameter, arranged in 5 paraffin blocks. An experienced genitourinary pathologist verified the tissue morphology.
Immunohistochemistry protocol
TMA blocks were cut at 3 µm and mounted on superfrost slides (Menzel Gläser, Brunswick, Germany). After deparaffinization with xylene and gradual rehydration, antigen retrieval was achieved by pressure cooking in 0.01 mol/L citrate buffer for 5 min. Slides were incubated with primary antibody, counterstained with haematoxylin and aqueously mounted. Antibodies used were TSPAN1 (Sigma‐Aldrich, St. Louis, Missouri, United States; HPA011909, polyclonal, rabbit, dilution 1:100; previously validated in [15]), ESRP1 (Sigma‐Aldrich, HPA023720, polyclonal, rabbit, dilution 1:100; previously validated in [16]) and KIAA1324 (Sigma‐Aldrich, HPA029869, polyclonal, rabbit, dilution 1:50; independent validation data are available at the Human Protein Atlas, www.proteinatlas.org). Optimization of antibody dilution for the tissue of interest (prostate cancer) was performed using the test series of prostate cancer cases with controlling for achievement of full staining spectrum from negative to strongly positive cases.
Immunohistochemistry evaluation
Three persons evaluated the immunohistochemistry (IHC) stains (MS, AK and YT), with at least two observers per biomarker. During evaluation, consensus was reached in every single case after initially independent evaluation. Semiquantitative evaluation was used for TSPAN1 (cytoplasm), KIAA1324 (separately Golgi‐type pattern and cytoplasm) and ESRP1 (cytoplasm) with 0 indicating a negative stain and 1–3 designating a weak, moderate and strong expression, respectively. Semiquantitative staining assessment was selected for above‐mentioned patterns due to the intrafocal homogeneity of these stainings. Further, nuclear expression of ESRP1 due to relative inhomogeneity of the staining was determined using the H‐score according to the formula = 0 × % of cells with staining ‘0’ + 1 × % staining ‘1’ + 2 × % staining ‘2’ + 3 × % staining ‘3’.
Ethical issues
The study was approved by the ethics committee at the University Hospital Bonn (071/2014) and carried out in compliance with the Helsinki declaration. The necessity of the informed consent was waived by ethics committee.
Bioinformatics, statistics
All analyses were carried out using R (R Foundation for Statistical Computing; version 3.4.1). For automatized processing of TCGA data, following pipeline was developed in R: (1) differential gene expression analysis for normal versus tumour samples (R‐packages: TCGAbiolinks, edgeR; false discovery rate (FDR) correction); (2) best cut‐off selection for mRNA expression data dichotomization for selected genes (Principle: systematic test of every available cut‐off for every gene in univariate Cox regression model with biochemical recurrence as endpoint; R‐package: survMisc); (3) automatized processing in univariate Cox regression models of selected genes using best cut‐offs for mRNA expression, rendering of Kaplan–Meier curves with log‐rank test; (4) automatized processing in multivariate Cox regression models of selected genes with predefined set of clinicopathological variables.
Survival analyses (Kaplan–Meier estimates, log‐rank test, uni‐ und multivariate Cox regression) in immunohistochemistry cohort were carried out in manual mode. Analysis of associations between expression of proteins and clinicopathological variables was performed using appropriate correlations and statistical tests for comparisons of means and medians.
The REMARK guidelines were followed in this study to ensure a high scientific standard [17].
Results
Analysis of TCGA data (gene selection)
Fourteen of the 98 genes identified as differentially expressed in tumour and benign tissue in our initial study were poorly characterized at that time (such as DKFZp564 and flj21425) and are still not recognized and systematized as typical genes. These genes were excluded from further TCGA analysis leaving 84 target genes (Table S1), including 42 that were upregulated and 42 downregulated [4].
Validation of differential gene expression (TCGA cohort)
To define differential gene expression, we applied a slightly relaxed criterium of approximately 1.9‐fold change (FC) for expression differences between normal and tumour tissue (i.e. logFC > 0.9 or <−0.9). Using this definition, 15 genes from the target list were upregulated at mRNA level, and 38 genes downregulated, while 31 genes showed no significant differences in expression (Table S2).
Analysis of univariate prognostic values (TCGA cohort)
Using the algorithm for best cut‐off selection (see Methods) for mRNA expression, 27 of 84 genes showed significant associations with biochemical recurrence (BCR)‐free survival of the patients in univariate Cox regression analysis with hazard ratios ranging from 0.37 to 1.87 (Table S3). Of these 27 genes, 20 were included in multivariate analysis; several genes (including several well‐known genes: C7 coding complement component 7, KLK3 coding PSA and KRT15 coding keratin 15) were excluded due to borderline significance or minimal divergence of groups in Kaplan–Meier analysis.
Analysis of multivariate prognostic values (TCGA cohort)
Multivariate analysis (including ISUP (International Society of Uropathology) grade of the tumour, final pT‐category and R‐status) confirmed 11 of these 20 genes (PCA3 was excluded as non‐protein‐coding gene) as significantly associated with BCR (Table 2; Kaplan–Meier curves for all 20 genes in Data S1).
Table 2.
Evaluation of the prognostic role of 11 selected genes (mRNA expression, TCGA cohort) in univariate and multivariate Cox regression analyses with inclusion of clinicopathological variables (endpoint: biochemical recurrence) for further validation
| Nr. | Gene mRNA expression: high vs low | Univariate Cox regression 1 (mRNA / gene‐of‐interest dichotomized) | Multivariate Cox regression# (Parameters: mRNA/gene‐of‐interest dichotomized, WHO histological grade group, pT‐stage and R‐Status) | Number of publications identified in PubMed | |||||
|---|---|---|---|---|---|---|---|---|---|
| HR | 95% CI | p‐level | HR | 95% CI | p‐level | Prostate and prostate cancer | Cancer | ||
| 1 | CMPK1 | 0.45 | 0.28–0.75 | 0.002 | 0.58 | 0.35–0.98 | 0.042 | 0 | 5 |
| 2 | ESRP1 2 | 2.49 | 1.54–4.03 | 0.0002 | 1.87 | 1.13–3.11 | 0.015 | 1 | 44 |
| 3 | KIAA1324 2 | 0.33 | 0.17–0.67 | 0.002 | 0.52 | 0.25–1.08 | 0.078 | 0 | 6 |
| 4 | OR51E2 | 0.43 | 0.27–0.70 | 0.0006 | 0.74 | 0.45–1.23 | 0.250 | 18 | 0 |
| 5 | TSPAN1 2 | 0.32 | 0.20–0.52 | 2.7e‐06 | 0.58 | 0.34–0.99 | 0.046 | 2 | 24 |
| 6 | UAP1 | 0.37 | 0.20–0.67 | 0.001 | 0.37 | 0.20–0.69 | 0.002 | 5 | 6 |
| 7 | FAM107A | 0.44 | 0.27–0.72 | 0.001 | 0.62 | 0.37–1.03 | 0.065 | 1 | 5 |
| 8 | SERPINB5 | 0.51 | 0.31–0.83 | 0.007 | 0.60 | 0.36–1.00 | 0.050 | 3 | 56 |
| 9 | SYNM | 0.46 | 0.29–0.73 | 0.001 | 0.58 | 0.36–0.93 | 0.023 | 0 | 1 |
| 10 | THSD4 | 0.53 | 0.33–0.85 | 0.008 | 0.58 | 0.35–0.94 | 0.028 | 0 | 4 |
| 11 | FGFR2 | 0.52 | 0.32–0.82 | 0.005 | 0.61 | 0.38–0.99 | 0.046 | 94 | 932 |
Kaplan–Meier curves are available in Data S1.
Genes selected for further validation at protein level.
To identify novel and relevant prognostic marker candidates for further validation using immunohistochemistry, literature was screened for information on protein location in the cell, on best known functional role, on antibody availability and current state of validation including previous PubMed‐listed studies. Using these filtering criteria, three genes were rendered as the most promising (TSPAN1, ESRP1 and KIAA1324) for further validation on protein level. Kaplan–Meier estimates of BCR‐free survival for mRNA expression of these three genes are shown in Fig. 1.
Fig. 1.
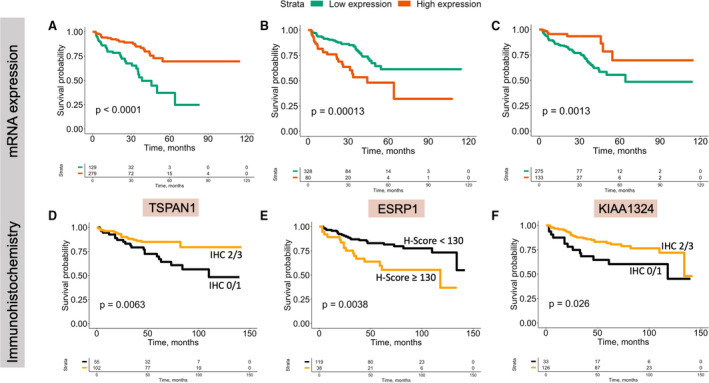
Kaplan–Meier estimates and log‐rank tests for biochemical recurrence‐free survival. (A) TCGA prostate cancer cohort: TSPAN1 mRNA expression dichotomized using cut‐off to high and low expression; (B) TCGA prostate cancer cohort: ESRP1 mRNA expression dichotomized using cut‐off to high and low expression; (C) TCGA prostate cancer cohort: KIAA1324 mRNA expression dichotomized using cut‐off to high and low expression; (D) immunohistochemistry cohort: TSPAN1 cytoplasmic expression, dichotomized as low (staining intensity 0 and 1) and high (staining intensity 2 and 3) protein expression; (E) immunohistochemistry cohort: ESRP1 nuclear expression, dichotomized as low (H‐score < 130 points) and high (H‐score > 130 points) protein expression; (F) immunohistochemistry cohort: KIAA1324 Golgi pattern protein expression, dichotomized as low (staining intensity 0 and 1) and high (staining intensity 2 and 3) pro.tein expression.
Immunohistochemical validation of TSPAN1, ESRP1 and KIAA1324 in prostatectomy cohort
Immunohistochemical evaluation of TSPAN1
Tetraspanin 1 (TSPAN1) showed a cytoplasmic staining pattern in tumour tissue, sometimes with a prominent luminal rim and intraluminal secretion of protein (Fig. 2). When benign tissue was available in tumour cores, it showed a similar staining pattern with low levels of positivity (intensity ‘1’) in most cases. The TMA core with the weakest staining was used for statistical evaluation as mRNA expression data indicated that a lower expression was associated with shorter survival. Cytoplasmic staining was negative in only 5 of 157 evaluable patients, and 70.0% showed a moderate or strong expression (intensity 2 or 3; Table S4).
Fig. 2.
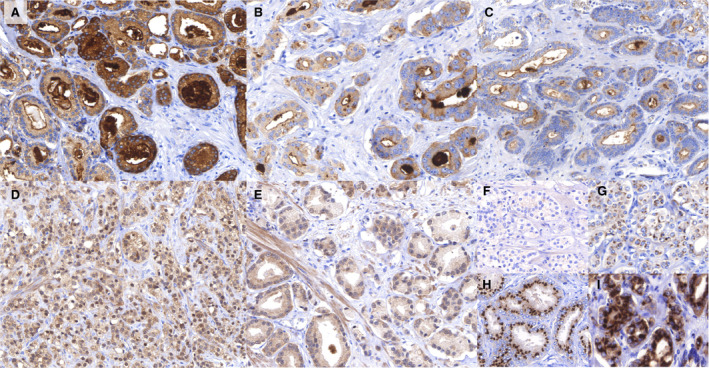
Examples of immunohistochemical stainings and their evaluation. (A) TSPAN1 staining (magnification 1:200) of prostate cancer. Expression is mainly located in the cytoplasm of tumour cells, often with a prominent luminal rim and secretion in the gland lumen. This image shows strong expression in the central and right parts, and moderate expression in the left and upper parts. (B) TSPAN1 staining (magnification 1:400) of prostate cancer. Weak cytoplasmic staining with typical prominent intraluminal secretions. A granular pattern is often seen in the cytoplasm. (C) TSPAN1 staining (magnification 1:200) of prostate cancer. In general, negative cytoplasm with intraluminal secretions. (D) ESRP1 staining (magnification 1:200) of prostate cancer. Strong nuclear expression of ESRP1 in the tumour cells, but also some cytoplasmic expression. (E) ESRP1 staining (magnification 1:400) of prostate cancer. Almost negative nuclear ESRP1 expression. (F–I) KIAA1324 staining of prostate cancer. KIAA1324 is mainly expressed in a Golgi‐type pattern with some cytoplasmic expression. F—negative (‘0’), G—weak (‘1’), H—moderate (‘2’) and strong (‘3’) staining.
TSPAN1 expression was significantly and inversely associated with histological tumour grade (p = 0.003). It was also associated with biochemical recurrence in Kaplan–Meier analysis (Fig. 1) and univariate Cox regression (HR 2.42, 95%CI 1.27–4.63, for pooled low levels of expression (IHC 0 and 1) versus moderate and strong expression (IHC 2 and 3; p = 0.007). However, in multivariate analysis already with inclusion of only histological tumour grade, the prognostic significance of TSPAN1 was lost (HR 1.32, 95%CI 0.66–2.62, p = 0.427).
Immunohistochemical evaluation of ESRP1
Both nuclear expression and cytoplasmic ESRP1 expression were present to some extent in all evaluated tumour samples and did not correlate with each other (p > 0.1). Non‐neoplastic prostatic glands, occasionally present in tumour cores, showed in general weaker nuclear and cytoplasmic expression than tumour tissue. High cytoplasmic expression in cancer was evident in 13% of cases. Only nuclear ESRP1 expression correlated with clinicopathological variables and survival. The TMA core with the highest H‐score was used for the analysis of nuclear ESRP1 expression, as higher expression was negatively associated with survival on mRNA level. Median H‐score in 175 evaluable patients was 80 points (range 5–240 points). H‐score correlated with pT‐stage (Pearson’s r = 0.23; p = 0.002), and there was a trend towards correlation with pN‐stage (Pearson’s r = 0.15; p = 0.055), but not with tumour grade (Pearson’s r = 0.07; p = 0.336).
ESRP1 nuclear expression (optimized cut‐off for H‐score = 130) was significantly associated with BCR‐free survival in Kaplan–Meier analysis (Fig. 1), univariate (for high (2/3) vs. low (0/1) IHC protein expression HR 2.5, 95%CI 1.3–4.7, p = 0.005) and multivariate (HR 2.4, 95%CI 1.2–4.9, p = 0.014) Cox regression with inclusion of tumour grade, pT‐stage, pN‐stage and status of surgical margin (R‐Status; Table S5).
Immunohistochemical evaluation of KIAA1324
The KIAA1324 stains showed both a Golgi‐type and cytoplasmic pattern in cancer and occasionally in benign tissue. In general, expression in benign tissue was similar to tumour tissue, with almost all foci of benign tissue showing at least intensity ‘2’ of staining. The cytoplasmic expression in cancer was low, with only 12% of patients showing staining intensity 2 or 3.
Only the Golgi pattern of KIAA1324 expression correlated with survival. The TMA core with the lowest expression was used for analysis as lower expression was negatively associated with survival on mRNA level. Roughly 22% of evaluable patients (39/175) showed strong expression, 57.1% (100/175)—moderate, 15.4% (27/175) —low and 5.1% (9/175) of patients were negative. No significant associations were found between KIAA1324 expression and any of the clinicopathological variables.
KIAA1324 expression was associated with biochemical recurrence in Kaplan–Meier analysis (Fig. 1) and in univariate Cox regression (HR 0.48, 95%CI 0.24–0.93, for high expression (IHC 2 and 3) versus low expression (IHC 0 and 1); p = 0.029). In a multivariate analysis with inclusion of tumour grade, pT‐stage, pN‐stage and surgical margin status, the independent prognostic value was retained (HR 0.42, 95%CI 0.21‐0.84, p = 0.014), see Table S6.
Discussion
Array‐based expression profiling of solid tumours is an invaluable research tool for identification of tumour relevant genes. Since its introduction about two decades ago we have identified several differentially expressed genes in prostate cancer. One of the aims of this study was validation of our previous findings [4] employing the publicly available TCGA expression data, consisting of 497 patient cases (radical prostatectomy due to prostate cancer) and 53 benign samples (50 of 53 paired).
The analysis of the TCGA data confirms differential expression of the majority of transcripts identified earlier. The re‐analysis revealed that 53 genes of 84 genes are significantly (with correction for false discovery rates) altered in the TCGA cohort at fold change of more than 1.9. Although a fold change of more than 2.0 is commonly considered to be meaningful, we have slightly relaxed this arbitrarily selected cut‐off to also include borderline target genes in the analysis. Therefore, a very high concordance was achieved between the rather old method of chip hybridization and the more modern approach using next‐generation sequencing (RNA‐seq), confirming the reliability of the methods.
As the next step, we have developed the automatized bioinformatical / statistical pipeline in R, which allowed us to test all 84 genes from the initial study [4] with regard to their association with BCR‐free survival of patients. This pipeline may also be used in any other tumour type and with inclusion of the complete set available from TCGA database of approximately 20,000 genes to carry out a screening for an independent prognostic role of genes in a very short time in any easily designed multivariate models. Filtering the 84 initial genes with clinically annotated expression data from the TCGA dataset allowed identification of 20 genes that were associated with BCR‐free survival. Eleven of them were protein‐coding genes proven to be independently prognostic in a multivariate model (Table 2). Interestingly, in 10 of 11 genes downregulation of mRNA was associated with biochemical recurrence. Some of these genes were already extensively studied in prostate cancer (FGFR2, UAP1, OR51E2), one has extracellular location (THSD4), and for other genes, convincingly validated antibodies for protein detection are not currently available. These factors guided in the selection of the three most promising targets (TSPAN1, ESRP1 and KIAA1324), which had not been studied in the prostate cancer at the time of this study, with exception of one patient with prostate cancer reported to have a gene fusion involving ESRP1 and RAF1 [18].
TSPAN1 is a gene coding a protein called tetraspanin 1 from the tetraspanin family of proteins which are involved in many aspects of cell biology and physiology [19]. One recent study showed that TSPAN1 is associated with cell migration and is under control of androgens [15]. One further study tried to evaluate the prognostic role of TSPAN1 for biochemical recurrence and found it to be an independent prognostic parameter, but the statistical power was insufficient [20]. TSPAN1 is highly overexpressed in tumour tissue compared with benign tissue (and almost 3 times at mRNA level). However, by immunohistochemistry 35% of cancers showed a low expression comparable to benign tissue, precluding its use as a diagnostic marker. Loss of expression/lower expression was associated with higher Gleason scores and shorter BCR‐free survival. Similar tendency with lower expression in aggressive and especially metastatic tumours was showed in the study of Munkley et al. [15]. Yet, due to a relatively strong inverse association with Gleason scores TSPAN1 was not independent prognostic for BCR‐free survival in multivariate analysis in our study, which corresponds to findings of Munkley et al. [15], but is discordant with findings of other TSPAN1 study of Xu et al [20] However, the study of Xu et al. was performed on a very small cohort of patients with associated significant statistical biases and should be interpreted cautiously.
Both ESRP1 and KIAA1324 were demonstrated to be independently prognostic for BCR‐free survival after prostatectomy, particularly in multivariate models with inclusion of common clinicopathological variables. ESRP1, or epithelial splicing regulatory protein 1, has already been shown to be relevant for the progression of ovarian, colorectal, breast and pancreatic cancer and also emerged as a novel oncogenic target, being overexpressed during progression [21, 22, 23, 24, 25, 26]. A similar trend was observed in our study with higher expression in locally advanced tumours and in recurrent cases. This protein was shown to be involved into alternative splicing and translation regulation, and also itself being affected from epigenetic regulators and alternative splicing leading to different subcellular locations [21, 22, 23, 27]. Given the important function of alternative splicing and translational regulation, it is of no wonder that effects of ESRP1 could be multidirectional in different cancer types, as it was showed that both up‐ and downregulation of ESRP1 could be linked to cancer progression [22, 25, 26]. Prostate cancer is well‐known for alternative splicing processes (e.g. splice variants of androgen receptors) which could change the tumour biology and have clinical implications [28]. Therefore, ESRP1 could be an important target for further studies in the prostate cancer. To our knowledge, this is the first study showing a prognostic role of ESRP1 at mRNA and protein expression levels for BCR‐free survival. This warrants further investigations of its biological functions and independent validation of the prognostic role in larger cohorts.
KIAA1324, or earlier oestrogen‐induced gene 121 (EIG 121), is in general poorly characterized and was recently reported to be a tumour suppressor in gastric cancer and associated with survival in serous carcinomas of the ovary and peritoneum [29, 30]. It was shown to be a diagnostic marker distinguishing type I and II endometrial carcinomas due to strong dependence on estrogens[31]. Scarce functional evidence is present for KIAA1324 regulating autophagy and promoting cell survival under stress [32]. Evidence of a biological or functional role in prostate cancer is lacking. Here, we for the first time show that lower expression of KIAA1324 mRNA and protein indicates at more aggressive disease and has independent negative prognostic significance for disease recurrence after prostatectomy. This warrants further studies to elucidate the details of prognostic role and biological functions of this gene in prostate cancer.
Our study has some limitations. The analysis of TCGA data was restricted to the change fold method, as this is the most commonly used approach in the literature. Additional analyses, for example using the differences of median expression in tumour and benign tissues or using the criteria defined by Golub et al. [33], were not applied. TCGA prostate cancer cohort is limited by short follow‐up data. Also, the cohort used for immunohistochemical validation consisted of only 160 patients with clinical follow‐up data. Although novel prognostic markers were found with this cohort, markers with weaker prognostic values may have been missed due to the small number of cases. We realize that biochemical relapse is not the ideal endpoint to analyse prognostic values in prostate cancer and is best considered a surrogate marker of disease progression. Other studies with clinically more meaningful endpoints are needed to verify the novel prognostic markers proposed by this study.
Drawing a conclusion, using a novel automatized screening methodology for the evaluation of the prognostic role of genes we validated our data from a previous array‐based expression study with publicly available gene expression data from the TCGA prostate cancer cohort. This filtering process allowed to simmer down a big list of genes with putative roles in prostate cancer to three novel prognostic marker candidates (TSPAN1, ESRP1 and KIAA1324), of which ESRP1 and KIAA1324 were eventually confirmed by immunohistochemistry as prognosticators for biochemical recurrence of prostate cancer following radical prostatectomy. Further prospective study of these genes is warranted in different settings (active surveillance, radical prostatectomy with or without lymphadenectomy) to identify patients at risk of therapy failure or with unfavourable prognosis. Also, mechanistic studies are necessary for further investigation of the biological role of the genes.
Conflict of interests
The authors have no conflicts of interest to declare.
Authors’ contribution
GK and YT involved in conception and design. MS, AK, YT, GK, JE and SH contributed to data acquisition. YT, MS, AK, GK, JE, SH and LE analysed and interpreted the data. YT, GK, MS and AK drafted the manuscript. All authors involved in critical revision for important intellectual content and final approval.
Supporting information
Data S1. Kaplan‐Meier curves / log‐rank test results for 20 selected genes from the initial study list included into multivariate analysis.
Figure S1. Expression of TSPAN1, KIAA1324 and ESRP1 in benign prostate tissue (exemplary microscopic images). Comparisons refer to mRNA expression data (TCGA cohort).
Table S1. Selected genes from a study of Kristiansen et al., Journal of Pathology 2005 (PMID: 15532095), included into analysis using TCGA data.
Table S2. Fifty‐two genes showing significant differential expression of RNA (normal vs tumor tissue) with logFC > 0.9 from initial list of 82 genes.
Table S3. Univariate Cox regression p‐values for selected optimised cut‐offs of mRNA expression (Panel of 84 genes). Endpoint: biochemical recurrence (BCR)‐free survival.
Table S4. Cytoplasmic protein expression of TSPAN1 using semiquantitative immunohistochemistry in prostatectomy cohort of patients.
Table S5. Univariate and multivariate Cox regression analysis of nuclear ESRP1 expression (immunohistochemistry) with regard to biochemical recurrence‐free survival in prostatectomy cohort (n = 157, number of events = 40).
Table S6. Univariate and multivariate Cox regression analysis of KIAA1324 expression (immunohistochemistry) with regard to biochemical recurrence‐free survival in prostatectomy cohort (n = 159, number of events = 39).
Stinnesbeck M, Kristiansen A, Ellinger J, Hauser S, Egevad L, Tolkach Y, Kristiansen G. Prognostic role of TSPAN1, KIAA1324 and ESRP1 in prostate cancer. APMIS. 2021; 129: 204–212.
Melissa Stinnesbeck and Anna Kristiansen equally contributed as first authors.
Yuri Tolkach and Glen Kristiansen shared senior authors.
References
- 1. Siegel RL, Miller KD, Jemal A. Cancer statistics, 2020. CA Cancer J Clin. 2020;70:7–30. [DOI] [PubMed] [Google Scholar]
- 2. Huber F, Montani M, Sulser T, Jaggi R, Wild P, Moch H, et al. Comprehensive validation of published immunohistochemical prognostic biomarkers of prostate cancer—what has gone wrong? A blueprint for the way forward in biomarker studies. Br J Cancer. 2015;112:140–8. [DOI] [PMC free article] [PubMed] [Google Scholar]
- 3. TCGA . The molecular taxonomy of primary prostate cancer. Cell. 2015;163:1011–25. [DOI] [PMC free article] [PubMed] [Google Scholar]
- 4. Kristiansen G, Pilarsky C, Wissmann C, Kaiser S, Bruemmendorf T, Roepcke S, et al. Expression profiling of microdissected matched prostate cancer samples reveals CD166/MEMD and CD24 as new prognostic markers for patient survival. J Pathol. 2005;205:359–76. [DOI] [PubMed] [Google Scholar]
- 5. Berg KD, Soldini D, Jung M, Dietrich D, Stephan C, Jung K, et al. TRPM4 protein expression in prostate cancer: a novel tissue biomarker associated with risk of biochemical recurrence following radical prostatectomy. Virchows Arch. 2016;468:345–55. [DOI] [PubMed] [Google Scholar]
- 6. Gerhardt J, Montani M, Wild P, Beer M, Huber F, Hermanns T, et al. FOXA1 promotes tumor progression in prostate cancer and represents a novel hallmark of castration‐resistant prostate cancer. Am J Pathol. 2012;180:848–61. [DOI] [PubMed] [Google Scholar]
- 7. Gerhardt J, Steinbrech C, Büchi O, Behnke S, Bohnert A, Fritzsche F, et al. The androgen‐regulated Calcium‐Activated Nucleotidase 1 (CANT1) is commonly overexpressed in prostate cancer and is tumor‐biologically relevant in vitro. Am J Pathol. 2011;178:1847–60. [DOI] [PMC free article] [PubMed] [Google Scholar]
- 8. Tischler V, Fritzsche FR, Gerhardt J, Jäger C, Stephan C, Jung K, et al. Comparison of the diagnostic value of fatty acid synthase (FASN) with alpha‐methylacyl‐CoA racemase (AMACR) as prostatic cancer tissue marker. Histopathology. 2010;56:811–5. [DOI] [PubMed] [Google Scholar]
- 9. Fritzsche FR, Stephan C, Gerhardt J, Lein M, Hofmann I, Jung K, et al. Diagnostic and prognostic value of T‐cell receptor gamma alternative reading frame protein (TARP) expression in prostate cancer. Histol Histopathol. 2010;25:733–9. [DOI] [PubMed] [Google Scholar]
- 10. Kristiansen G, Fritzsche FR, Wassermann K, Jäger C, Tölls A, Lein M, et al. GOLPH2 protein expression as a novel tissue biomarker for prostate cancer: implications for tissue‐based diagnostics. Br J Cancer. 2008;99:939–48. [DOI] [PMC free article] [PubMed] [Google Scholar]
- 11. Fritzsche FR, Jung M, Tölle A, Wild P, Hartmann A, Wassermann K, et al. ADAM9 expression is a significant and independent prognostic marker of PSA relapse in prostate cancer. Eur Urol. 2008;54:1097–106. [DOI] [PubMed] [Google Scholar]
- 12. Weichert W, Knösel T, Bellach J, Dietel M, Kristiansen G. ALCAM/CD166 is overexpressed in colorectal carcinoma and correlates with shortened patient survival. J Clin Pathol. 2004;57:1160–4. [DOI] [PMC free article] [PubMed] [Google Scholar]
- 13. Kristiansen G, Pilarsky C, Pervan J, Stürzebecher B, Stephan C, Jung K, et al. CD24 expression is a significant predictor of PSA relapse and poor prognosis in low grade or organ confined prostate cancer. Prostate. 2004;58:183–92. [DOI] [PubMed] [Google Scholar]
- 14. Uhl B, Gevensleben H, Tolkach Y, Sailer V, Majores M, Jung M, et al. PITX2 DNA methylation as biomarker for individualized risk assessment of prostate cancer in core biopsies. J Mol Diagnostics. 2017;19:107–14. [DOI] [PubMed] [Google Scholar]
- 15. Munkley J, McClurg UL, Livermore KE, Ehrmann I, Knight B, Mccullagh P, et al. The cancer‐associated cell migration protein TSPAN1 is under control of androgens and its upregulation increases prostate cancer cell migration. Sci Rep. 2017;7:5249. [DOI] [PMC free article] [PubMed] [Google Scholar]
- 16. Ishii H, Saitoh M, Sakamoto K, Kondo T, Katoh R, Tanaka S, et al. Epithelial splicing regulatory proteins 1 (ESRP1) and 2 (ESRP2) suppress cancer cell motility via different mechanisms. J Biol Chem. 2014;289:27386–99. [DOI] [PMC free article] [PubMed] [Google Scholar]
- 17. McShane LM, Altman DG, Sauerbrei W, Taube SE, Gion M, Clark GM, et al. REporting recommendations for tumour MARKer prognostic studies (REMARK). Br J Cancer. 2005;93:387–91. [DOI] [PMC free article] [PubMed] [Google Scholar]
- 18. Palanisamy N, Ateeq B, Kalyana‐Sundaram S, Pflueger D, Ramnarayanan K, Shankar S, et al. Rearrangements of the RAF kinase pathway in prostate cancer, gastric cancer and melanoma. Nat Med. 2010;16:793–8. [DOI] [PMC free article] [PubMed] [Google Scholar]
- 19. Charrin S, Jouannet S, Boucheix C, Rubinstein E. Tetraspanins at a glance. J Cell Sci. 2014;127:3641–8. [DOI] [PubMed] [Google Scholar]
- 20. Xu F, Gao Y, Wang Y, Pan J, Sha J, Shao X, et al. Decreased TSPAN1 promotes prostate cancer progression and is a marker for early biochemical recurrence after radical prostatectomy. Oncotarget. 2016;7:63294–305. [DOI] [PMC free article] [PubMed] [Google Scholar]
- 21. Fici P, Gallerani G, Morel A‐P, Mercatali L, Ibrahim T, Scarpi E, et al. Splicing factor ratio as an index of epithelial‐mesenchymal transition and tumor aggressiveness in breast cancer. Oncotarget. 2016;8:2423–36. [DOI] [PMC free article] [PubMed] [Google Scholar]
- 22. Fagoonee S, Picco G, Orso F, Arrigoni A, Longo DL, Forni M, et al. The RNA‐binding protein ESRP1 promotes human colorectal cancer progression. Oncotarget. 2016;8:10007–24. [DOI] [PMC free article] [PubMed] [Google Scholar]
- 23. Wu G, Li Z, Jiang P, Zhang X, Xu Y, Chen K, et al. MicroRNA‐23a promotes pancreatic cancer metastasis by targeting epithelial splicing regulator protein 1. Oncotarget. 2017;8:82854–71. [DOI] [PMC free article] [PubMed] [Google Scholar]
- 24. Mager LF, Koelzer VH, Stuber R, Thoo L, Keller I, Koeck I, et al. The ESRP1‐GPR137 axis contributes to intestinal pathogenesis. Elife. 2017;6:e28366. [DOI] [PMC free article] [PubMed] [Google Scholar]
- 25. Jeong HM, Han J, Lee SH, Park H‐J, Lee HJ, Choi J‐S, et al. ESRP1 is overexpressed in ovarian cancer and promotes switching from mesenchymal to epithelial phenotype in ovarian cancer cells. Oncogenesis. 2017;6:e389. [DOI] [PMC free article] [PubMed] [Google Scholar]
- 26. Chen L, Yao Y, Sun L, Zhou J, Miao M, Luo S, et al. Snail driving alternative splicing of CD44 by ESRP1 enhances invasion and migration in epithelial ovarian cancer. Cell Physiol Biochem. 2017;43:2489–504. [DOI] [PubMed] [Google Scholar]
- 27. Yang Y, Carstens RP. Alternative splicing regulates distinct subcellular localization of epithelial splicing regulatory protein 1 (Esrp1) isoforms. Sci Rep. 2017;7:3848. [DOI] [PMC free article] [PubMed] [Google Scholar]
- 28. Watson PA, Chen YF, Balbas MD, Wongvipat J, Socci ND, Viale A, et al. Constitutively active androgen receptor splice variants expressed in castration‐resistant prostate cancer require full‐length androgen receptor. Proc Natl Acad Sci. 2010;107:16759–65. [DOI] [PMC free article] [PubMed] [Google Scholar]
- 29. Schlumbrecht MP, Xie S‐S, Shipley GL, Urbauer DL, Broaddus RR. Molecular clustering based on ERα and EIG121 predicts survival in high‐grade serous carcinoma of the ovary/peritoneum. Mod Pathol. 2011;24:453–62. [DOI] [PMC free article] [PubMed] [Google Scholar]
- 30. Kang JM, Park S, Kim SJ, Kim H, Lee B, Kim J, et al. KIAA1324 suppresses gastric cancer progression by inhibiting the oncoprotein GRP78. Cancer Res. 2015;75:3087–97. [DOI] [PubMed] [Google Scholar]
- 31. Deng L, Broaddus RR, McCampbell A, Shipley GL, Loose DS, Stancel GM, et al. Identification of a novel estrogen‐regulated gene, EIG121, induced by hormone replacement therapy and differentially expressed in type I and type II endometrial cancer. Clin Cancer Res. 2005;11:8258–64. [DOI] [PubMed] [Google Scholar]
- 32. Deng L, Feng J, Broaddus RR. The novel estrogen‐induced gene EIG121 regulates autophagy and promotes cell survival under stress. Cell Death Dis. 2010;1:e32. [DOI] [PMC free article] [PubMed] [Google Scholar]
- 33. Golub TR, Slonim DK, Tamayo P, Huard C, Gaasenbeek M, Mesirov JP, et al. Molecular classification of cancer: class discovery and class prediction by gene expression monitoring. Science. 1999;286:531–7. [DOI] [PubMed] [Google Scholar]
Associated Data
This section collects any data citations, data availability statements, or supplementary materials included in this article.
Supplementary Materials
Data S1. Kaplan‐Meier curves / log‐rank test results for 20 selected genes from the initial study list included into multivariate analysis.
Figure S1. Expression of TSPAN1, KIAA1324 and ESRP1 in benign prostate tissue (exemplary microscopic images). Comparisons refer to mRNA expression data (TCGA cohort).
Table S1. Selected genes from a study of Kristiansen et al., Journal of Pathology 2005 (PMID: 15532095), included into analysis using TCGA data.
Table S2. Fifty‐two genes showing significant differential expression of RNA (normal vs tumor tissue) with logFC > 0.9 from initial list of 82 genes.
Table S3. Univariate Cox regression p‐values for selected optimised cut‐offs of mRNA expression (Panel of 84 genes). Endpoint: biochemical recurrence (BCR)‐free survival.
Table S4. Cytoplasmic protein expression of TSPAN1 using semiquantitative immunohistochemistry in prostatectomy cohort of patients.
Table S5. Univariate and multivariate Cox regression analysis of nuclear ESRP1 expression (immunohistochemistry) with regard to biochemical recurrence‐free survival in prostatectomy cohort (n = 157, number of events = 40).
Table S6. Univariate and multivariate Cox regression analysis of KIAA1324 expression (immunohistochemistry) with regard to biochemical recurrence‐free survival in prostatectomy cohort (n = 159, number of events = 39).