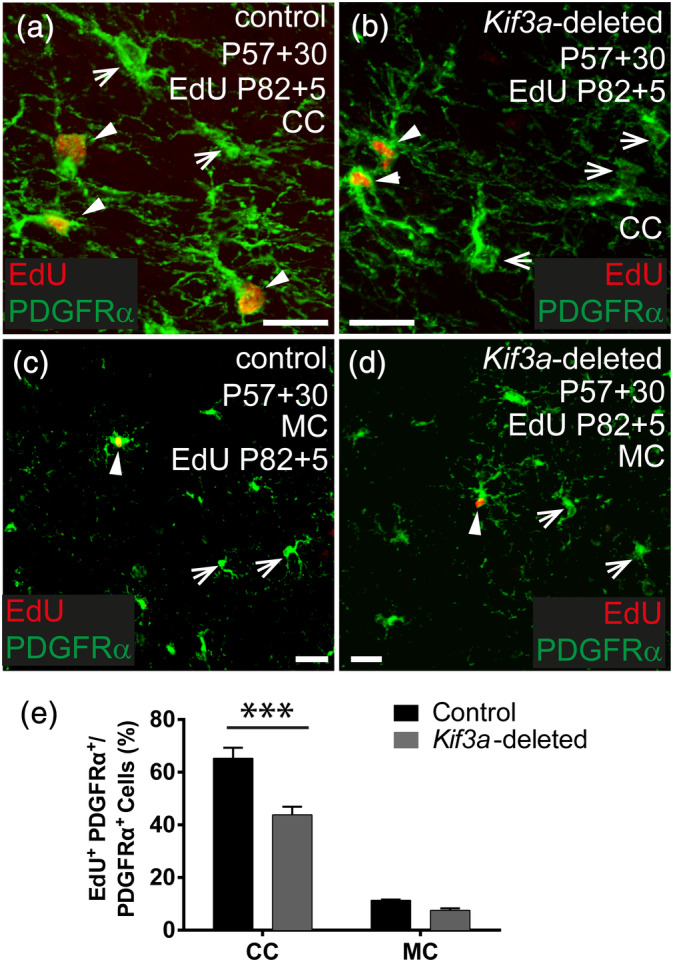
FIGURE 5.

Deleting Kif3a from OPCs reduces proliferation in vivo. (a, b) Representative confocal images from the CC of a Kif3a fl/fl (control) (a) and Pdgfrα‐CreER™:: Kif3a fl/fl (Kif3a‐deleted) (b) mouse that received EdU via the drinking water between P57+25 and P57+30. Brain cryosections were immunostained to detect PDGFRα (green) and EdU (red). (c, d) Representative confocal images from the motor cortex (MC) of a Kif3a fl/fl (control) (c) and Pdgfrα‐CreER™:: Kif3a fl/fl (Kif3a‐deleted) (d) mouse that received EdU via their drinking water from P57+25 to P5+30. Brain cryosections were immunostained to detect PDGFRα (green) and EdU (red). (e) The proportion of PDGFRα+ OPCs that divided and incorporated EdU in the CC and MC of control and Kif3a‐deleted mice. Data are presented as mean ± SD for n = 3–4 mice per genotype at each timepoint. Two‐way ANOVA: brain region F (1, 8) = 932, p < .0001; genotype F (1, 8) = 73.5, p < .0001; interaction F (1, 8) = 35.7, p = .0003. Bonferroni post‐test ***p < .0001. Solid white arrowheads show EdU+ PDGFRα+ OPCs. White arrows show PDGFRα+ OPCs that were EdU‐negative. Scale bars represent 30 μm [Color figure can be viewed at wileyonlinelibrary.com]
