FIGURE 8.

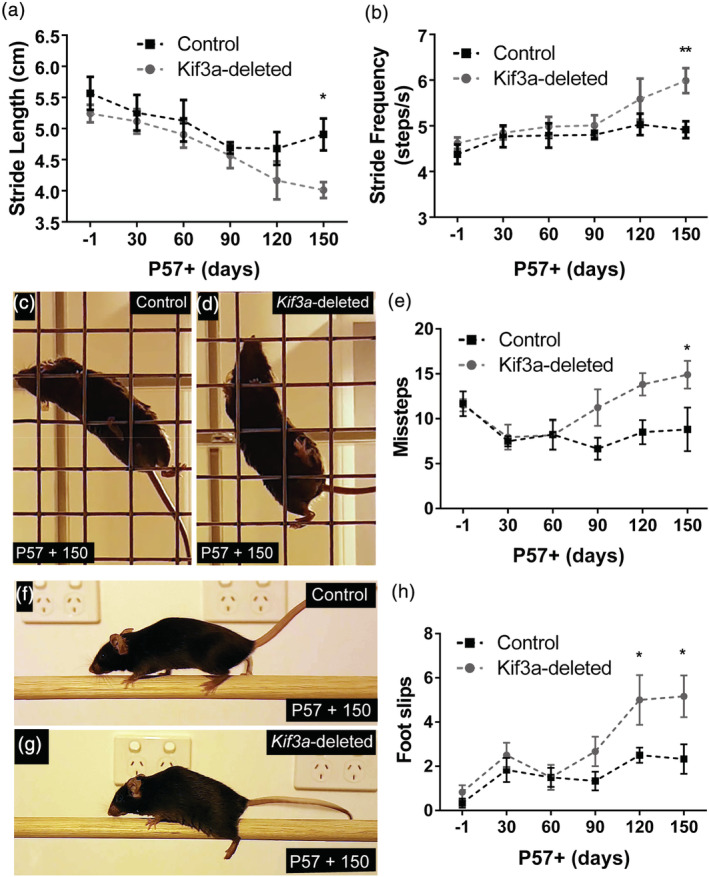
The conditional deletion of Kif3a from adult OPCs leads to a progressive decline in fine motor balance and coordination. (a) Graphical representation of forelimb stride length for control and Kif3a‐deleted mice running on the DigiGait™ treadmill at 22 cm/s. Data are expressed as mean ± SEM for n = 6–10 mice per genotype at each timepoint. Two‐way ANOVA: time F (5, 85) = 4.15, p = .002; genotype F (5, 85) = 5.57, p = .02; interaction F (5, 85) = 0.37, p = .86. Bonferroni post hoc *p < .05. (b) Graphical representation of forelimb stride frequency for control and Kif3a‐deleted mice running on the DigiGait™ treadmill at 22 cm/s. Data are expressed as mean ± SEM for n = 6–10 mice per genotype at each timepoint. Two‐way ANOVA: time F (5, 85) = 4.87, p = .0006; genotype F (5, 85) = 8.05, p = .0057; interaction F (5, 85) = 1.48, p = .21. Bonferroni post hoc **p < .01. (c, d) Representative video snapshot of a control (c) and Kif3a‐deleted (d) mouse performing the grid walk task at P57+150. (e) Graphical representation of the number of missteps made by control and Kif3a‐deleted mice during the grid walk task. Data expressed as mean ± SEM for n = 6 mice per genotype at each timepoint. Two‐way ANOVA time F (5, 60) = 2.96, p = .018; genotype F (5, 60) = 9.65, p = .0029; interaction F (5, 60) = 1.88, p = .11. Bonferroni post hoc *p < .05. (f, g) Representative video snapshot of a control (f) and Kif3a‐deleted (g) mouse performing the beam walk task P57+150. (h) Graphical representation of the number of foot slips made by control and Kif3a‐deleted mice during a single beam crossing. Data expressed as mean ± SEM for n = 6 mice per genotype at each timepoint. Two‐way ANOVA: time F (5, 60) = 8.25, p < .0001; genotype F (5, 60) = 13.36, p = .005; interaction F (5, 60) = 1.70, p = .14. Bonferroni post hoc *p < .05 [Color figure can be viewed at wileyonlinelibrary.com]
