

Abstract
Background
Treatment of patients with hemophilia has advanced over the past decades, but it is unknown whether this has resulted in a normal life expectancy in the Netherlands.
Objective
This observational cohort study aimed to assess all‐cause and cause‐specific mortality in patients with hemophilia in the Netherlands between 2001 and 2018 and to compare mortality and life expectancy with previous survival assessments from 1973 onward.
Patients/methods
All 1066 patients with hemophilia who participated in a nationwide survey in 2001 were followed until July 2018.
Results
Information on 1031 individuals (97%) was available, of whom 142 (14%) deceased during follow‐up. Compared with the general Dutch male population, mortality of patients with hemophilia was still increased (standardized mortality ratio: 1.4, 95% confidence interval: 1.2–1.7). Intracranial bleeding and malignancies were the most common causes of death. Estimated median life expectancy of patients with hemophilia was 77 years, 6 years lower than the median life expectancy of the general Dutch male population (83 years). Over the past 45 years, death rates of patients with hemophilia have consistently decreased, approaching the survival experience of the general population. Over the past decades, mortality due to human immunodeficiency virus and hepatitis C virus infections has decreased, death due to intracranial hemorrhages has increased, and death due to ischemic heart disease has remained consistently low over time.
Conclusions
Survival in patients with hemophilia in the Netherlands has improved over time but is still lower than that of the general population.
Keywords: hemophilia, hepatitis C, HIV, life expectancy, mortality
Essentials.
This study aimed to assess mortality in patients with hemophilia.
Patients with hemophilia who participated in a survey in 2001 were followed until 2018.
Despite a decrease in death rates, hemophilia is still associated with a lower life expectancy.
Intracranial hemorrhage deaths have increased and ischemic heart deaths remain low.
1. INTRODUCTION
Hemophilia is a hereditary disease caused by a deficiency of clotting factor VIII or IX. The introduction of clotting factor concentrates in the 1970s 1 , 2 , 3 and other improvements such as prophylactic treatment, home treatment, and low dose immune tolerance drastically improved life expectancy of patients. 2
Unfortunately, exposure to human immunodeficiency virus (HIV) and hepatitis C virus (HCV) through contaminated blood products in the 1980s led to a sharp increase in mortality. 4 , 5 , 6 , 7 , 8 , 9 , 10 Through the use of viral inactivation techniques, as well as the introduction of recombinant factor replacement products, the transmission of both HIV and HCV has been halted since 1992. 2 From 1999 onward, hemophilia treatment in the Netherlands was gradually centralized and quality criteria were introduced in comprehensive hemophilia treatment centers. 11 In addition, dosages for prophylactic treatment have steadily increased since the 1970s. 12 It is still insufficiently known whether these treatment advances have resulted in a completely normal life expectancy in the Netherlands.
This observational cohort study aimed to evaluate all‐cause and cause‐specific mortality in patients with hemophilia in the Netherlands from 2001 to 2018 and to compare mortality and life expectancy over the past 45 years. In addition, we investigated potential determinants of mortality of patients with hemophilia during this period.
2. METHODS
2.1. Study design
This was an observational cohort study following patients from 1973 to 2018. From 1973 to 2001, three cohort studies evaluated mortality of patients with hemophilia in the Netherlands. 9 , 10 , 13 The studies were performed from 01 January 1973 to 01 January 1986 (the 1973–1986 cohort); 02 January 1986 to 31 May 1992 (the 1986–1992 cohort); and 01 June 1992 to 30 June 2001 (the 1992–2001 cohort). The current study followed patients who participated in a nationwide survey from 01 July 2001 to 01 July 2018. An invitation to participate in the survey was sent to all 1567 known patients with hemophilia via their hemophilia physician or the Netherlands Hemophilia Patient Society. In total, 1066 patients (68%) completed the survey. 9 The present study was approved in 2018 by the Committee of Medical Ethics of Leiden University Medical Center.
2.2. Patient characteristics at inclusion
All male patients with mild, moderately severe, and severe hemophilia A and B who participated in the 2001 survey were included. The following self‐reported information, obtained from the 2001 patient survey, was collected at baseline: date of birth, hemophilia severity, HIV status, and HCV status. If the self‐reported data on HIV or HCV were missing, then it was obtained from the medical files.
Hemophilia severity was categorized as severe (<0.01 IU/mL), moderate (0.01–0.05 IU/mL), or mild (>0.05–0.40 IU/mL). Information on hemophilia severity and type were verified from the medical files. Patients born after 1985 or who reported no treatment with clotting factor between 1979 and 1985 were considered to be HIV negative. Patients born after 1992 or who reported no treatment with clotting factor before 1992 were considered to be HCV negative. If HIV/HCV status was missing, the information was obtained from the medical files. HCV status was categorized as “never infected with HCV,” “HCV infection cleared,” and “chronic hepatitis C.” As a double‐check, HCV status as reported by the patients was compared with HCV status from the medical files for a random sample of patients (N = 92).
2.3. Follow‐up and outcomes
Patients were followed from 01 July 2001 until 01 July 2018 or until their last known hospital visit. Date of death and cause of death were obtained from the medical files. The primary cause of death, as written on the death certificate, was not directly available, but the same information was also reported in the patients’ medical file at the time of death. Causes of death were then manually classified according to the 10th revision of the International Classification of Injuries, Diseases and Causes of Death‐10 (ICD‐10). 14 All‐cause mortality, cause‐specific mortality, and life expectancy of the general male population of the Netherlands for the years 1973 to 2017 were retrieved from the Dutch Central Bureau of Statistics (CBS). 15
2.4. All‐cause mortality, cause‐specific mortality, and life expectancy
The standardized mortality ratio (SMR) is a measure of the change in mortality in a given population, with respect to a reference population. SMRs were calculated for the years 2001 to 2018 to estimate the risk of all‐cause and cause‐specific death among patients compared to the general male population, while adjusting for the age distributions of the two populations. The SMR is calculated by dividing the observed number of deaths in a study population by the expected number of deaths in the study population (which is based on the age distribution of the study population and the age‐specific death rates of the general male population). When calculating cause‐specific SMRs, other causes of death were censored. To assess all‐cause and cause‐specific death rates over time, we calculated crude death rates for the current and previous cohort studies, stratified by 15‐year age categories.
The median life expectancy at birth for the 2001–2018 cohort was calculated from a lifetime survival curve using age as the time scale. To calculate median life expectancy, patients had to survive until the start of the study observation period (2001). A standard analysis of the data would have induced a type of bias, which is sometimes called length bias. 16 To correct for this problem, we adjusted for left truncation, ie, patients were included in the analysis from the start of the study observation period instead of their date of birth. Median life expectancy was defined as the age at which cumulative survival was 50%. To assess changes in median life expectancy over time, information on median life expectancy for the previous cohort studies was obtained from previously published data. 9 , 10 , 13
2.5. Potential determinants of mortality
Crude and adjusted associations between hemophilia severity/HIV status/HCV status and mortality were assessed with the Cox proportional hazards model, in the standard way, using time on study as the time scale and with patients being included in the risk set of the model from the time of study entry (2001). Participants with missing values were excluded from the analysis.
2.6. Sensitivity analysis
Severely ill patients may not have participated in the 2001 survey, which could have led to an underestimation of death rates during follow‐up. We examined a possible “healthy cohort effect” by performing a sensitivity analysis in which we excluded the first 3 years of follow‐up.
3. RESULTS
3.1. Patient characteristics
In the current cohort study, we included 1031 out of 1066 (97%) patients with available data. Thirty‐five patients with missing follow‐up data were excluded. Eighty‐seven percent of patients had hemophilia A and 13% had hemophilia B (Table 1). In total, 412 patients (40%) suffered from severe hemophilia, 175 (17%) from moderate hemophilia, and 444 (43%) from mild hemophilia. In 2001, 29 patients were known to be infected with HIV (3%) and 336 patients had chronic hepatitis C (33%).
TABLE 1.
Patient characteristics at baseline (2001)
| Baseline variable | N = 1031 |
|---|---|
| Mean age (SD, min‐max) | 33.9 (20.5, 0.1‐‐89.3) |
| Severity of disease (n, %) | |
| Severe | 412 (40) |
| Moderate | 175 (17) |
| Mild | 444 (43) |
| Type of hemophilia (n, %) | |
| Hemophilia A | 893 (87) |
| Hemophilia B | 138 (13) |
| Severity of disease, hemophilia A (n, %) | |
| Severe | 351 (39) |
| Moderate | 154 (17) |
| Mild | 388 (43) |
| Severity of disease, hemophilia B (n, %) | |
| Severe | 61 (44) |
| Moderate | 21 (15) |
| Mild | 56 (41) |
| HIV infection (n, %) | |
| No (in 2001) | 984 (95) |
| Yes (in 2001) | 29 (3) |
| Unknown | 18 (2) |
| HCV infection (n, %) | |
| Never infected with HCV (in 2001) | 581 (56) |
| HCV infection cleared (in 2001) | 96 (9) |
| Chronic hepatitis C (in 2001) | 336 (33) |
| Unknown | 18 (2) |
Abbreviations: HCV, hepatitis C virus; HIV, human immunodeficiency virus; SD, standard deviation.
In the random sample of 92 patients of whom HCV status was verified from medical records, 92% (85/92) accurately reported their hepatitis C status. Stratified by HCV status, 93%, 75%, and 100% correctly reported their HCV status in patients with chronic HCV, patients who previously cleared the virus, and patients who were never infected, respectively. Median follow‐up time was 17.0 years (min‐max: 0.3–17.4) and the mean age at baseline was 33.9 years (standard deviation [SD]: 20.5, min‐max: 0.1–89.3) in 2001. For comparison, the mean age of the Dutch male population in 2001 was 37.1 years. The age distribution of the study population and the general male population in the Netherlands in 2001 is presented in Figure S1 in supporting information. The total number of deaths per age group in the study population is presented in Figure S2 in supporting information.
3.2. All‐cause mortality
In total, 142 patients died during follow‐up (14%) at a median age of 69.8 years (min‐max: 16.4–98.0). A life‐time survival curve for the study cohort is presented in Figure 1. The overall crude death rate was 8.9 deaths per 1000 person‐years. The crude death rate in the general male population was 8.2 per 1000 person‐years in the period 2001–2017. Overall, age‐standardized mortality in patients with hemophilia was 40% higher compared with the general male population (SMR 1.4, 95% confidence interval [CI] 1.2–1.7; Table 2).
FIGURE 1.
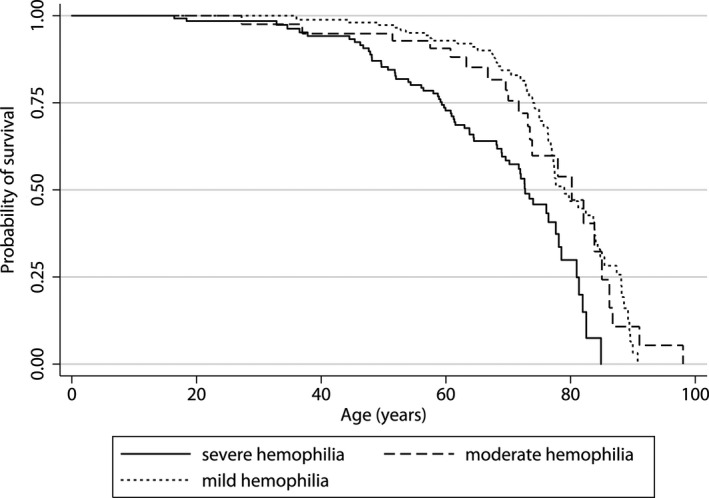
Lifetime survival curve for the 2001 to 2018 cohort. The figure shows the survival curve for patients with mild, moderate, and severe hemophilia, using age as the time scale. The cumulative probability of survival is shown on the y‐axis, the age in years is shown on the x‐axis
TABLE 2.
All‐cause and cause‐specific SMR in patients with hemophilia from the Netherlands between 2001 and 2018
| Cause of death | N a (%) | SMR (95% CI) b |
|---|---|---|
| All‐cause mortality | 142 (100) | 1.4 (1.2‐‐1.7) |
| AIDS | 3 (2) | 27.9 (5.8‐‐81.6) |
| Hepatocellular carcinoma | 10 (7) | 13.2 (6.3‐‐24.2) |
| Chronic liver disease | 10 (7) | 9.1 (4.3‐‐16.6) |
| Ischemic heart disease | 3 (2) | 0.3 (0.1‐‐0.9) |
| Ischemic stroke | 1 (1) | 1.1 (0.03‐‐6.0) |
| Intracranial bleeding | 20 (14) | 12.8 (7.8‐‐19.8) |
| Malignancies (non‐hepatic) | 37 (26) | 1.0 (0.7‐‐1.4) |
| All other causes c | 33 (23) | Not applicable |
| Unknown | 25 (18) | Not applicable |
Abbreviations: AIDS, acquired immunodeficiency virus; CI, confidence intervals; SMR, standardized mortality ratios.
Number of deaths.
Standardized mortality ratio, ratio of the observed and expected number of deaths and 95% confidence intervals.
Bacterial infections (11); gastrointestinal bleeding, intra‐abdominal bleeding, or pericardial bleeding (6); sudden cardiac death (5); trauma (3); chronic heart failure (2); suicide/substance abuse (3); or other causes (3).
Crude death rates for the period 1973–2018, stratified by age, are presented as a graph (Figure 2) and as a table (Table 3). Overall, crude death rates followed a decreasing trend for all age categories. For the period 1973–2018, crude death rates changed from 0.7 to 0 deaths per 1000 person‐years for persons aged 0 to 14 years, 2.4 to 0.8 deaths per 1000 person‐years for persons aged 15 to 29 years, 4.7 to 2.3 deaths per 1000 person‐years for persons aged 30 to 44 years, 13.8 to 19.4 and then to 8.1 deaths per 1000 person‐years for persons aged 45 to 59 years and 57.9 to 33.7 deaths per 1000 person‐years for persons aged 60 years and older.
FIGURE 2.
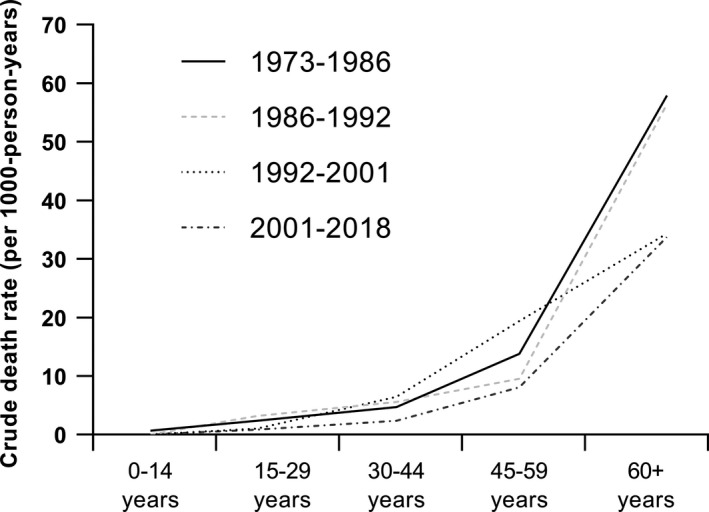
Crude death rates over time. The line chart shows the crude death rates (per 1000 person‐years) for different age categories, stratified by study cohort. The accompanying table (Table 3) shows the total number of deaths, total person‐time, and resulting death rate for different age categories, stratified by study cohort
TABLE 3.
Deaths, person‐time, and death rates for different age categories, stratified by study cohort
| Age category | 1973‐‐1986 | 1986‐‐1992 | 1992‐‐2001 | 2001‐‐2018 | ||||||||
|---|---|---|---|---|---|---|---|---|---|---|---|---|
| n a | PY b | Death rate c | n a | PY b | Death rate c | n a | PY b | Death rate c | n a | PY b | Death rate c | |
| 0‐‐14 | 1 | 1530 | 0.7 | 0 | 873 | 0 | 0 | 452 | 0 | 0 | 1920 | 0 |
| 15‐‐29 | 7 | 2978 | 2.4 | 6 | 1887 | 3.2 | 1 | 995 | 1.0 | 3 | 3630 | 0.8 |
| 30‐‐44 | 9 | 1906 | 4.7 | 10 | 1797 | 5.6 | 8 | 1246 | 6.4 | 8 | 3424 | 2.3 |
| 45‐‐59 | 11 | 799 | 13.8 | 8 | 839 | 9.5 | 18 | 929 | 19.4 | 33 | 4075 | 8.1 |
| 60+ | 15 | 259 | 57.9 | 21 | 372 | 56.5 | 16 | 466 | 34.3 | 98 | 2906 | 33.7 |
N, deaths.
PY, person‐years.
Crude death rate per 1000 person‐years.
3.3. Cause‐specific mortality
From 2001 to 2018, frequent causes of death were non‐hepatic malignancies (26%) and intracranial bleeding (14%). Acquired immunodeficiency syndrome (AIDS; 2%), chronic liver disease (7%), and hepatocellular carcinoma (7%) were less frequent causes of death (Table 2). In comparison with the general male population, mortality due to AIDS (SMR 27.9, 95% CI 5.8–81.6) and due to HCV infection (SMR 13.2, 95% CI 6.3–24.2 for hepatocellular carcinoma, SMR 9.1, 95% CI 4.3–16.6 for chronic liver disease) were increased (Table 2). In addition, mortality due to intracranial bleeding was increased (SMR 12.8, 95% CI 7.8–19.8). Mortality due to ischemic heart disease was decreased (SMR 0.3, 95% CI 0.1–0.9) while mortality due to ischemic stroke was similar (SMR 1.1, 95% CI 0.03–6.0) compared to the general male population. Last, mortality due to non‐hepatic malignancies was also similar to that of the general male population (SMR 1.0, 95% CI 0.7–1.4).
Cause‐specific crude death rates over the past 45 years are presented in Table 4. Mortality due to AIDS was first reported in the period 1986 to 1992, reaching its peak in the period 1992 to 2001, and decreased thereafter. A similar pattern is seen for chronic liver disease, although the decrease in mortality after 2001 is less pronounced. Mortality due to ischemic heart disease was low in all cohorts between 1973 and 2018.
TABLE 4.
Cause‐specific crude death rates (per 1000 person‐years) over time
| Cause of death | 1973‐1986 (N = 717, PY a = 7788) | 1986‐1992 (N = 919, PY a = 5753) | 1992‐2001 (N = 967, PY a = 8868) | 2001‐2018 (N = 1066, PY a = 15 909) | ||||
|---|---|---|---|---|---|---|---|---|
| n b | Death rate c | n b | Death rate c | n b | Death rate c | n b | Death rate c | |
| AIDS | 0 | 0 | 12 | 2.09 | 24 | 2.71 | 3 | 0.19 |
| Hepatocellular carcinoma | NR | NR | NR | NR | 5 | 0.56 | 10 | 0.63 |
| Chronic liver disease | 0 | 0 | 5 | 0.87 | 10 | 1.13 | 10 | 0.63 |
| Ischemic heart disease | 1 | 0.13 | 0 | 0 | 6 | 0.68 | 3 | 0.19 |
| Ischemic stroke | 3 | 0.39 | 0 | 0 | 0 | 0 | 1 | 0.06 |
| Intracranial bleed | 3 | 0.39 | 9 | 1.56 | 4 | 0.45 | 20 | 1.26 |
| Non‐hepatic malignancies | 13 | 1.67 | 7 | 1.22 | 12 | 1.35 | 37 | 2.33 |
PY, person‐years.
n, number of deaths.
Death rate per 1000 person‐years, NR, not reported in original publication.
3.4. Median life expectancy
Median life expectancy from 1973 to 2018 is presented in Figure 3 and additional information on the number of deaths/total person‐time is presented in Table 5. Median life expectancy of the cohort increased from 66 years in 1973–1986 to 77 years in 2001–2018, a gain of 11 years. In comparison, median life expectancy of the general male population increased from 79 years to 83 years during the same time frame (a gain of 4 years). For the 2001–2018 cohort, median life expectancy of patients with severe hemophilia was 73 years (SMR 2.4, 95% CI 1.8–3.0), whereas median life expectancy was 80 years for patients with moderate hemophilia (SMR 1.1, 95% CI; 0.7–1.7) and 79 years for patients with mild hemophilia (SMR 1.0, 95% CI 0.8–1.4). Although patients with severe hemophilia had the lowest median life expectancy, they also showed the biggest gains after 2001 (59 years in the 1992–2001 cohort versus 73 years in the 2001–2018 cohort).
FIGURE 3.
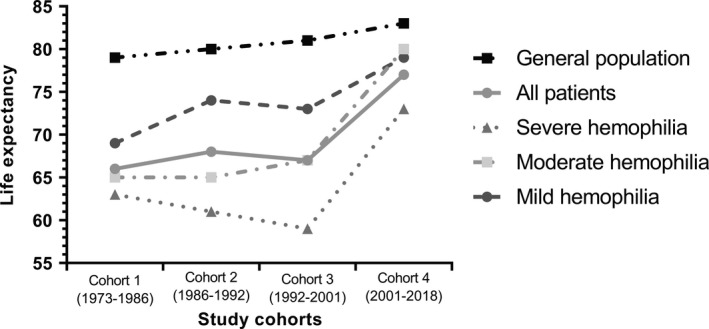
Median life expectancy in patients with hemophilia in the Netherlands between 1973 and 2018. The line chart shows the median life expectancy of several groups per study cohort. The life expectancy is shown on the y‐axis, while the four study cohorts are shown on the x‐axis. The upper line represents the median life expectancy of the Dutch general male population over time. The accompanying table (Table 5) shows the number of deaths and total person‐time of all groups for each study cohort
TABLE 5.
The number of deaths and total person‐time for each study cohort, stratified by severity
| 1973‐‐1986 | 1986‐‐1992 | 1992‐‐2001 | 2001‐‐2018 | |||||
|---|---|---|---|---|---|---|---|---|
| Deaths | PY a | Deaths | PY a | Deaths | PY a | Deaths | PY a | |
| All patients | 43 | 7776 | 45 | 5753 | 94 | 8314 | 142 | 15 909 |
| Severe hemophilia | 20 | 3649 | 19 | 2396 | 47 | 3259 | 65 | 6406 |
| Moderate hemophilia | 10 | 1861 | 11 | 1070 | 15 | 1454 | 22 | 2683 |
| Mild hemophilia | 13 | 2266 | 15 | 2287 | 32 | 3600 | 55 | 6819 |
PY, person‐years.
3.5. Potential determinants of mortality
Compared with patients with mild hemophilia, mortality in patients with severe hemophilia was 80% higher (adjusted hazard ratio [HR] 1.78, 95%CI: 1.08–2.94; Table 6). Twenty‐nine patients were HIV positive in 2001, 8 patients died during follow‐up. Three patients died due to AIDS‐related complications, two patients died due to HCV‐related complications, and three patients died due to other causes. Compared with HIV‐negative patients, mortality among HIV‐positive patients was increased (adjusted HR 2.65, 95% CI: 1.26–5.58; Table 6). In total, 336 patients were HCV positive in 2001. Compared with HCV‐negative patients, mortality among HCV‐positive patients was slightly increased (adjusted HR 1.25, 95% CI: 0.85–1.83; Table 6).
TABLE 6.
Mortality rates and hazard ratios, according to HIV status and HCV status in 2001‐‐2018
| Group | N | Deaths (%) | PY a | Crude rate (per 1000 PY a ) | Crude hazard ratios (95%CI) | Adjusted hazard ratios (95%CI) |
|---|---|---|---|---|---|---|
| Overall | 1031 | 142 (13.8) | 15 909 | 8.9 | — | — |
| Mild | 444 | 55 (12.4) | 6819 | 8.1 | ref | ref |
| Moderate | 175 | 22 (12.6) | 2683 | 8.2 | 1.00 (0.61‐1.64) | 1.24 (0.63‐2.44) b |
| Severe | 412 | 65 (15.8) | 6406 | 10.2 | 1.28 (0.89‐1.83) | 1.78 (1.08‐2.94) b |
| HIV– e | 984 | 127 (12.9) | 15 260 | 8.3 | ref | ref |
| HIV + e | 29 | 8 (27.6) | 415 | 19.3 | 2.33 (1.14‐4.76) | 2.65 (1.26‐5.58) c |
| HCV– f | 677 | 61 (9.0) | 10 652 | 5.7 | ref | ref |
| HCV + f | 336 | 74 (22.0) | 4997 | 14.8 | 2.58 (1.84‐3.62) | 1.25 (0.85‐1.83) d |
Abbreviations: HCV, hepatitis C virus; HIV, human immunodeficiency virus.
Person years.
Adjusted for age.
Adjusted for age, HCV status, and hemophilia severity.
Adjusted for age, HIV status, and hemophilia severity.
HIV status was unknown in 18 patients.
HCV status was unknown in 18 patients.
3.6. Sensitivity analysis
The sensitivity analysis excluding the first 3 years of follow‐up yielded similar results as the overall analysis (Table S1 in supporting information).
4. DISCUSSION
From 1973 to 2019, life expectancy slowly increased, except for the period 1986 to 2001 (which coincides with the HIV/HCV epidemic). This temporary dip in life expectancy was, as expected, strongest in patients with severe hemophilia (who were most exposed to clotting factor products). Overall, the life expectancy of patients with hemophilia increased by 11 years versus 4 years for the general male population. The differences in mortality rates between time periods were most pronounced in the older age groups (Figure 2). This was most likely simply due to the high baseline risk of dying in older patients. However, mortality is still increased compared to the general male population.
The cause of the decrease in mortality is most likely a combination of two main factors: the increased prophylactic dosages and the decrease in HCV‐ and HIV‐related deaths over time. Evidence from the literature shows that integrated care most likely also decreases mortality. 17 We hypothesized that this would also be the case in our study; however, it was impossible to estimate the effect of integrated care on mortality directly as there were no patients that were treated outside of this care model in our study (ie, there was no control group to compare against our care model).
Our findings are in line with a study among Italian patients with hemophilia, which showed a similar decrease over time (SMR 2.0 95% CI 1.5–2.5 from 1990–1999; SMR 1.1 95% CI 0.8–1.4 from 2000–2007). 18 A study among Brazilian patients of the period 2000–2014 reported a SMR of 1.13 (95% CI: 1.01–1.16), the same outcome as that of the 2000–2007 Italian cohort. 19 However, it should be noted that SMRs from different populations cannot be compared directly when the reference populations are not the same. 20 Compared to the Italian cohort, a similar HCV‐related death rate (1.12 deaths per 1000 person‐years) and a higher HIV‐related death rate (0.84 deaths per 1000 person‐years) than in our study was reported. 18
In our study, 20 out of 142 patients died due to intracranial bleeding (14% of total deaths), a 13‐fold increase compared to the general male population. The proportion of patients that died due to intracranial bleeding was similar for patients with severe hemophilia (2.4%, 95% CI 1.2–4.5) and mild hemophilia (2.0%, 95% CI 1.0–3.9). A European/Australian cohort study that followed 2709 non‐severe hemophilia A patients who were treated with factor VIII from 1996 to 2010 reported a 3.5‐fold increased risk (95% CI 2.0–5.8), compared to the general population. 21 As only patients with non‐severe hemophilia were included, the lower mortality risk seems plausible. A recent retrospective study from Brazil based on mortality data from the entire male population for the period 2001 to 2014 found more similar results, as 137 out of 784 deaths in this cohort (17.5%, 95% CI 14.9–20.3) were due to intracranial bleeding. 19 Intracranial hemorrhages in neonates are a known complication of hemophilia, 22 , 23 , 24 but these patients were not included in our study. In our population, median age at death from intracranial bleed was similar to other causes (67 versus 68 years). Further studies are needed to mitigate the risk for intracranial bleeding.
Hemophilia potentially complicates treatment of age‐related conditions such as malignancies and ischemic heart disease, which are becoming more common as the population ages. 25 , 26 , 27 , 28 , 29 For example, patients with a malignancy may need additional hemostatic replacement during surgical interventions or after chemotherapy‐induced thrombocytopenia. Bleeding symptoms will also develop at an earlier stage in patients with gastrointestinal malignancies. 30 In our cohort, the incidence of deaths due to non‐hepatic malignancies is now similar to that of the Dutch male population. This is most likely due to the fact that patients are living longer, and due to fewer hemophilia‐related deaths like bleeding‐related complications or HCV/HCV.
Based on the literature, it seems that patients with hemophilia have an unfavorable cardiovascular risk profile, compared to the general population. 31 , 32 In our cohort, the mortality due to ischemic heart disease was lower than in the general population, which is also in line with literature. 30 The low clotting factor levels may hinder thrombus formation at the site of plaque rupture. 33 The optimal evidence‐based anti‐platelet/anti‐coagulant therapy to reduce thrombotic risk as well as bleeding risk has not yet been identified. 30
Hemophilia severity, HIV status, and HCV status were independently associated with mortality. Compared to HCV‐negative patients, the increased risk of mortality for HCV‐positive patients was relatively minor. This is probably because the vast majority of patients were successfully treated with either (peg) interferon‐based treatment and/or the newer direct acting antivirals. Pre‐treatment severity of fibrosis is strongly associated with mortality after successful treatment. 34 As information on the extent of liver damage was not available, we were not able to assess this in our dataset.
Our study has several strengths. First, due to the availability of data from 1972 onward we could study trends in mortality during the past 45 years. Second, this study included the majority of patients with hemophilia in the Netherlands, with little loss to follow‐up (3%) during the period 2001 to 2018.
Our study also has limitations. Other important determinants of mortality such as inhibitor status, immune tolerance induction, bleeding phenotype, joint status, and prophylaxis were not assessed. Lastly, as we were not able to collect information on all possible confounding factors (such as bleeding phenotype, treatment adherence, the level of cirrhosis, inhibitor status, prophylaxis, etc.) some residual confounding may still exist. In our cohort, we only reported the combined results for hemophilia A and B. However, some retrospective studies have reported that patients with hemophilia B have a milder phenotype, but this has not been confirmed in subsequent studies. 35 Also, there were only 29 patients with HIV, with only three deaths due to AIDS. However, the incidence of AIDS in the general population was far lower, resulting in a very high SMR of 27.9 (95% CI: 5.8–81.6). Due to the small sample size, the estimate of the SMR is not very precise (hence the wide confidence intervals around the estimate). Furthermore, as some information was self‐reported, there was a risk of misclassification bias. To reduce this bias, hemophilia type, severity, and HCV status were checked from the medical files. In the case of HCV status, this was done for a random sample of patients (N = 92). Results showed that the self‐reported HCV status was correct in most cases (92%). In addition, life expectancy estimates should be interpreted with caution as these are always future projections based on current trends. It is expected that age‐specific mortality rates will further decrease over time (despite the current transient effect of the COVID‐19 epidemic on mortality) due to improvements in health care and novel treatment options. For example, direct‐acting antivirals that are used to treat HCV have an almost 100% success rate. 36 Lastly, compared to treatment with clotting factor products, novel non‐gene therapy options such as emicizumab offer better bleeding management (especially for patients with an inhibitor) and possibly a better safety profile as well. 37
In conclusion, a decrease in mortality and an increase in life expectancy in patients with hemophilia in the Netherlands over the period 1973 to 2018 was seen. However, survival is still lower than that of the general population and warrants further improvements in hemophilia care.
CONFLICTS OF INTEREST
SH, RCM, EPMB, LFDvV, EAMB, LH, PFY, LN, SEMS, CS, MHD, SLC, ECvB, FRR, and SCG have no interests to disclose. JE has received research support from CSL Behring for research outside this project. MC has received financial support for research, as well as lecturing and consultancy fees, from Bayer, CSL Behring, Pfizer, Sanquin Blood Supply, and UniQure. FWGL has received an unrestricted grant from CSL Behring and Shire/Takeda for studies on von Willebrand disease. He is a consultant for UniQure, NovoNordisk, and Shire/Takeda, of which the fees go to the university. He is member of a DSMB for a study from Roche. JGvdB Has been a teacher on educational activities of Bayer.
AUTHOR CONTRIBUTIONS
SH and RCM collected, interpreted, and analyzed the data and wrote the manuscript. EPMB, LFDvV, JE, EAMB, LH, PFY, LN, MC, SEMS, and FWGL provided data from participating hemophilia centers and reviewed the manuscript. CS, MHD, and EVB provided feedback on the project. SLC provided statistical advice. SCG, FRR, and JGvdB developed this research project and supervised interpretation and statistical analysis of the data. All authors reviewed and approved the final version.
Supporting information
Appendix S1
ACKNOWLEDGMENTS
We thank all participants and Dutch hemophilia treatment centers for their participation.
Hassan S, Monahan RC, Mauser‐Bunschoten EP, et al. Mortality, life expectancy, and causes of death of persons with hemophilia in the Netherlands 2001–2018. J Thromb Haemost.2021;19:645–653. 10.1111/jth.15182
Manuscript handled by: Jill Johnsen
Final decision: Jill Johnsen, 10 November 2020
Funding InformationThis work was made possible by an unrestricted grant from the Ministry of Health, Welfare and Sport (Dutch: Ministerie van Volksgezondheid, Welzijn en Sport; VWS).
DATA AVAILABILITY STATEMENT
For original data, please contact SCGouw@lumc.nl.
REFERENCES
- 1. Larsson SA. Life expectancy of Swedish haemophiliacs, 1831–1980. Br J Haematol. 1985;59:593‐602. [DOI] [PubMed] [Google Scholar]
- 2. Franchini M, Mannucci PM. The history of hemophilia. Semin Thromb Hemost. 2014;40:571‐576. 10.1055/s-0034-1381232 [DOI] [PubMed] [Google Scholar]
- 3. Mannucci PM. Hemophilia: treatment options in the twenty‐first century. J Thromb Haemost. 2003;1:1349‐1355. [DOI] [PubMed] [Google Scholar]
- 4. Centres for Disease Control and Prevention (CDC) . Pneumocystis carinii pneumonia among persons with hemophilia A. MMWR Morb Mortal Wkly Rep. 1982;31:365‐367. [PubMed] [Google Scholar]
- 5. Centres for Disease Control and Prevention (CDC) . Update on acquired immune deficiency syndrome (AIDS) among patients with hemophilia A. MMWR Morb Mortal Wkly Rep. 1982;31(644–6):52. [PubMed] [Google Scholar]
- 6. Biggs R. Jaundice and antibodies directed against factors 8 and 9 in patients treated for haemophilia or Christmas disease in the United Kingdom. Br J Haematol. 1974;26:313‐329. [DOI] [PubMed] [Google Scholar]
- 7. Darby SC, Ewart DW, Giangrande PL, et al. Mortality from liver cancer and liver disease in haemophilic men and boys in UK given blood products contaminated with hepatitis C UK Haemophilia Centre Directors' Organisation. Lancet. 1997;350:1425‐1431. [DOI] [PubMed] [Google Scholar]
- 8. Eyster ME, Schaefer JH, Ragni MV, et al. Changing causes of death in Pennsylvania's hemophiliacs 1976 to 1991: impact of liver disease and acquired immunodeficiency syndrome. Blood. 1992;79:2494‐2495. [PubMed] [Google Scholar]
- 9. Plug I, Van Der Bom JG, Peters M, et al. Mortality and causes of death in patients with hemophilia, 1992–2001: a prospective cohort study. J Thromb Haemost. 2006;4:510‐516. 10.1111/j.1538-7836.2006.01808.x [DOI] [PubMed] [Google Scholar]
- 10. Triemstra M, Rosendaal FR, Smit C, Van der Ploeg HM, Briet E. Mortality in patients with hemophilia: changes in a Dutch population from 1986 to 1992 and 1973 to 1986. Ann Intern Med. 1995;123(11):823. [DOI] [PubMed] [Google Scholar]
- 11. Leebeek FW, Fischer K. Quality of haemophilia care in The Netherlands: new standards for optimal care. Blood Transfus. 2014;12(Suppl 3):s501‐s504. 10.2450/2014.0041-14s [DOI] [PMC free article] [PubMed] [Google Scholar]
- 12. Fischer K, van der Bom JG, Mauser‐Bunschoten EP, et al. Changes in treatment strategies for severe haemophilia over the last 3 decades: effects on clotting factor consumption and arthropathy. Haemophilia. 2001;7:446‐452. 10.1046/j.1365-2516.2001.00545.x [DOI] [PubMed] [Google Scholar]
- 13. Rosendaal FR, Varekamp I, Smit C, et al. Mortality and causes of death in Dutch haemophiliacs, 1973–86. Br J Haematol. 1989;71:71‐76. [DOI] [PubMed] [Google Scholar]
- 14. World Health Organization (WHO) . International Statistical Classification of Diseases and Related Health Problems, 10th revision. 1994, update 2016.
- 15. STATLINE . Central Bureau of Statistics (CBS) Website. http://www.cbs.nl/nl/statline. Accessed May 23, 2018.
- 16. Wolkewitz M, Allignol A, Harbarth S, de Angelis G, Schumacher M, Beyersmann J. Time‐dependent study entries and exposures in cohort studies can easily be sources of different and avoidable types of bias. J Clin Epidemiol. 2012;65:1171‐1180. 10.1016/j.jclinepi.2012.04.008 [DOI] [PubMed] [Google Scholar]
- 17. Yeung CH, Santesso N, Pai M, et al. Care models in the management of haemophilia: a systematic review. Haemophilia. 2016;22(Suppl 3):31‐40. 10.1111/hae.13000 [DOI] [PMC free article] [PubMed] [Google Scholar]
- 18. Tagliaferri A, Rivolta GF, Iorio A, et al. Mortality and causes of death in Italian persons with haemophilia, 1990–2007. Haemophilia. 2010;16:437‐446. 10.1111/j.1365-2516.2009.02188.x [DOI] [PubMed] [Google Scholar]
- 19. Jardim LL, van der Bom JG, Caram‐Deelder C, Gouw SC, Leal Cherchiglia M, Meireles RS. Mortality of patients with haemophilia in Brazil: First report. Haemophilia. 2019;25:e146–e152. 10.1111/hae.13730 [DOI] [PubMed] [Google Scholar]
- 20. Julious SA, Nicholl J, George S. Why do we continue to use standardized mortality ratios for small area comparisons? J Public Health Med. 2001;23:40‐46. [DOI] [PubMed] [Google Scholar]
- 21. Loomans JI, Eckhardt CL, Reitter‐Pfoertner SE, et al. Mortality caused by intracranial bleeding in non‐severe hemophilia A patients. J Thromb Haemost. 2017;15:1115‐1122. 10.1111/jth.13693 [DOI] [PubMed] [Google Scholar]
- 22. Nelson MD Jr, Maeder MA, Usner D, et al. Prevalence and incidence of intracranial haemorrhage in a population of children with haemophilia. The Hemophilia Growth and Development Study. Haemophilia. 1999;5:306–312. [DOI] [PubMed] [Google Scholar]
- 23. Ljung RC. Intracranial haemorrhage in haemophilia A and B. Br J Haematol. 2008;140:378‐384. 10.1111/j.1365-2141.2007.06949.x [DOI] [PubMed] [Google Scholar]
- 24. Witmer CM. Low mortality from intracranial haemorrhage in paediatric patients with haemophilia. Haemophilia. 2015;21:e359‐e363. 10.1111/hae.12716 [DOI] [PubMed] [Google Scholar]
- 25. Dunn AL, Austin H, Soucie JM. Prevalence of malignancies among U.S. male patients with haemophilia: a review of the Haemophilia Surveillance System. Haemophilia. 2012;18:532‐539. 10.1111/j.1365-2516.2011.02731.x [DOI] [PubMed] [Google Scholar]
- 26. Fransen van de Putte DE, Fischer K, Makris M, et al. History of non‐fatal cardiovascular disease in a cohort of Dutch and British patients with haemophilia. Eur J Haematol. 2012;89:336‐339. 10.1111/j.1600-0609.2012.01835.x [DOI] [PubMed] [Google Scholar]
- 27. Huang YC, Tsan YT, Chan WC, et al. Incidence and survival of cancers among 1,054 hemophilia patients: a nationwide and 14‐year cohort study. Am J Hematol. 2015;90:E55‐E59. 10.1002/ajh.23947 [DOI] [PubMed] [Google Scholar]
- 28. Minuk L, Jackson S, Iorio A, et al. Cardiovascular disease (CVD) in Canadians with haemophilia: age‐related CVD in Haemophilia Epidemiological Research (ARCHER study). Haemophilia. 2015;21:736‐741. 10.1111/hae.12768 [DOI] [PubMed] [Google Scholar]
- 29. Tagliaferri A, Di Perna C, Santoro C, et al. Cancers in patients with hemophilia: a retrospective study from the Italian Association of Hemophilia Centers. J Thromb Haemost. 2012;10:90‐95. 10.1111/j.1538-7836.2011.04566.x [DOI] [PubMed] [Google Scholar]
- 30. Shapiro S, Makris M. Haemophilia and ageing. Br J Haematol. 2019;184:712‐720. 10.1111/bjh.15745 [DOI] [PubMed] [Google Scholar]
- 31. Fransen van de Putte DE, Fischer K, Makris M, et al. Unfavourable cardiovascular disease risk profiles in a cohort of Dutch and British haemophilia patients. Thromb Haemost. 2013;109:16‐23. 10.1160/th12-05-0332 [DOI] [PubMed] [Google Scholar]
- 32. Humphries TJ, Ma A, Kessler CM, Kamalakar R, Pocoski J. A second retrospective database analysis confirms prior findings of apparent increased cardiovascular comorbidities in hemophilia A in the United States. Am J Hematol. 2016;91:E298‐E299. 10.1002/ajh.24336 [DOI] [PMC free article] [PubMed] [Google Scholar]
- 33. Biere‐Rafi S, Zwiers M, Peters M, et al. The effect of haemophilia and von Willebrand disease on arterial thrombosis: a systematic review. Neth J Med. 2010;68:207‐214. [PubMed] [Google Scholar]
- 34. Ioannou GN, Beste LA, Green PK, et al. Increased risk for hepatocellular carcinoma persists up to 10 years after HCV eradication in patients with baseline cirrhosis or high FIB‐4 scores. Gastroenterology. 2019;157(5):1264–1278:e4. 10.1053/j.gastro.2019.07.033 [DOI] [PMC free article] [PubMed] [Google Scholar]
- 35. Castaman G, Matino D. Hemophilia A and B: molecular and clinical similarities and differences. Haematologica. 2019;104:1702‐1709. 10.3324/haematol.2019.221093 [DOI] [PMC free article] [PubMed] [Google Scholar]
- 36. Rumi MG, Di Marco V, Colombo M. Management of HCV‐related liver disease in Hemophilia and Thalassemia. Semin Liver Dis. 2018;38:112‐120. 10.1055/s-0038-1655774 [DOI] [PubMed] [Google Scholar]
- 37. Shima M. Bispecific antibodies and advances in non‐gene therapy options in Hemophilia. Res Pract Thromb Haemost. 2020;4:446‐454. 10.1002/rth2.12337 [DOI] [PMC free article] [PubMed] [Google Scholar]
Associated Data
This section collects any data citations, data availability statements, or supplementary materials included in this article.
Supplementary Materials
Appendix S1
Data Availability Statement
For original data, please contact SCGouw@lumc.nl.