Abstract
Conventional histology is a destructive technique based on the evaluation of 2D slices of a 3D biopsy. By using 3D X‐ray histology these obstacles can be overcome, but their application is still restricted due to the inherently low attenuation properties of soft tissue. In order to solve this problem, the tissue can be stained before X‐ray computed tomography imaging (CT) to enhance the soft tissue X‐ray contrast. Evaluation of brominated fluorescein salts revealed a mutual influence of the number of bromine atoms and the cations applied on the achieved contrast enhancement. The dibromo fluorescein barium salt turned out to be the ideal X‐ray contrast agent, allowing for 3D imaging and subsequent complementing counterstaining applying standard histological techniques.
Keywords: dyes, eosin Y, fluorescein, microCT, stain
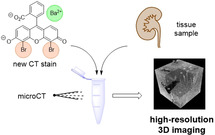
Add some color: The dibromo fluorescein barium salt proves to be a suitable staining agent enabling the diagnostic screening of tissue samples by X‐ray microscopic computed tomography without impending further diagnostics through histological methods.
Medical diagnosis providing microscopic information on (sub)‐cellular level is currently realized through conventional 2D histopathology, which is mainly based on light microscopy techniques. In combination with a large diversity of dyes and staining methods that have been developed over time various specific biological structures can be individually targeted. However, the current techniques are limited to the staining of only thin (2–20 μm) 2D microscopic slides that originate from a 3D biopsy sample. As the demand to extend biological and medical investigations to three dimensions has grown significantly over the last decade, several approaches for 3D imaging have been developed. [1] Beyond serial‐sectioning based approaches, these imaging methods include confocal and light sheet laser‐scanning microscopy [2] and block‐face imaging (episcopic microscopy).[ 3 , 4 ] Even though these methods have improved considerably over the years, they still require salt correction and registration steps, and the resulting reconstructions are often incomplete or do not represent the 3D structure of the imaged sample in a reliable way.
To overcome these limitations, X‐ray microscopic computed tomography (μCT) [5] and nanoscopic CT (nanoCT)[ 5a , 6 ] imaging have proven to provide valuable 3D information of biological samples in a fast, convenient, and non‐destructive way (Figure 1 A). Here, non‐destructive refers to the ability of X‐ray CT to investigate biological samples using a multiscale approach ranging from whole organisms over whole organs to pieces of organs of animals without the need to embed or destruct the biological material. As a result, a 3D data set is received, which allows for virtually extracting any desired slice under any arbitrary angle throughout the entire volume (as an example see the video in the Supporting Information).
Figure 1.
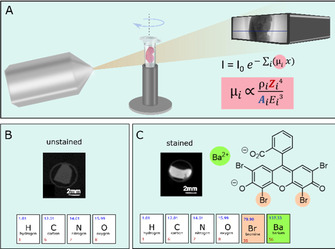
(A) Schematic representation of a μCT setup showing the X‐ray source on the left and the detector on the right. In the middle is a rotation stage holding the soft‐tissue sample. The Lambert–Beer law describes the reduction of the X‐ray intensity by passing through a material. Here the linear absorption coefficient μ i, which is unique for each material, is directly proportional to the atomic number Z to the power of 4. [12] (B) Unstained soft tissue is mainly made of hydrogen (H), carbon (C), oxygen (O), and nitrogen atoms (N), which consist of low atomic numbers resulting in an inherent low contrast for soft tissue seen on the CT slice. (C) Stained tissue on the other hand has accumulated contrast agent that holds elements of high atomic number Z (see stained CT slice). The contrast agent used here was dibromo fluorescein 9 c (see chemical structure) holding two bromine atoms (Z Br=35, highlighted in apricot) and a barium atom (Z Ba=56, highlighted in green).
X‐ray CT devices can be found at large synchrotron facilities [7] but also in a laboratory environment[ 6b , 6d , 6e , 8 ] capable of providing resolutions comparable to conventional 2D histology. Because of the intrinsically low attenuation properties of soft tissue at hard X‐ray energies, the use of stains bearing high atomic number elements is inevitable in order to reach sufficient contrast (Figure 1 B, C). Nonetheless, there is currently very limited availability of easy‐to‐handle X‐ray staining agents that are (i) speedily penetrating the tissue without creating artefacts, (ii) targeting a specific biological morphology by staining the probe homogenously and completely, and (iii) at the same time suitable for large and dense tissue samples. In addition, staining procedures need to be introduced that are fully compatible with standard histology and thus allow further investigations of the region of interest (ROI) by the histologist, if necessary. First attempts to develop such dyes as X‐ray contrast agents included modifications of elemental iodine I2 for whole organ morphology [9] and eosin Y disodium salt (2 a) to target specifically the cell cytoplasm.[ 5a , 6d ] Eosin Y is a versatile, non‐toxic compound[ 10 , 11 ] and readily available as the disodium salt 2 a (Scheme 1), but its contrast enhancement is limited despite the four covalently bound bromine atoms (Z=35). Best results for soft‐tissue visualization employing 2 a are achieved only by using very high concentrations of 2 a (30 % w/v) and cannot be further enhanced because of its limited water solubility (300 mg mL−1). [5a]
Scheme 1.
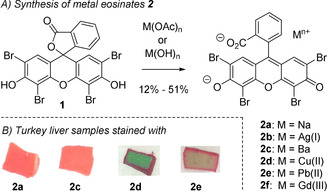
A) Synthesis of eosin Y salts 2 and B) macroscopic investigations of stained tissue. The tissue samples were pre‐treated with a 4 % formaldehyde solution and 0.5 mL glacial acetic acid. Staining was performed using a 31.9 mm aq. solution of eosin Y salt 2 a or 2 c–2 e. For each condition, an individual number of three turkey liver pieces (≈27 mm3) was stained to ensure reproducibility; one of these pieces was investigated macroscopically.
Based on recent reports on 2 a as contrast agent for μCT,[ 5a , 6d , 6e ] we investigated the possibility to further improve the contrast within the soft tissue by using heavy‐metal eosin Y salts 2 b–2 f. Because of the high Z value of heavy metals (Figure 1 C), their implementation should allow to lower the concentration of contrast agent needed to reach a suitable contrast enhancement comparable to that of 2 a. As water solubility might be impaired by the involvement of heavy metal atoms, we furthermore investigated the influence of the bromine atoms at the fluorescein core in 2 in response to solubility in aqueous media, tissue penetration, staining properties, and contrast enhancement, in order to implement a new “gold standard” for μCT of biopsy samples.
The heavy metal‐eosin Y salts 2 b–2 f were synthesized by treating the lactone form of eosin Y (1) with the corresponding metal hydroxide and metal acetate, respectively (Scheme 1 A and Supporting Information, chapter 2). The salts 2 b–2 f were obtained as homogenous solids after recrystallization in 12–51 % yield.
In a preliminary solubility study, all eosin Y salts 2 b–2 f showed a significantly lowered maximum concentration in water when compared to the disodium compound 2 a (see the Supporting Information, chapter 4). The AgI salt 2 b as well as the GdIII salt 2 f did not meet the sensitivity threshold needed for μCT measurements (<10 mg mL−1) and were thus not further investigated. The other compounds 2 c–2 e were then studied with regard to their staining properties.
The use of X‐ray contrast agents to stain ex vivo biological samples often suffers from a spatially and temporally anisotropic stain penetration into soft tissue, leading to an artificial contrast gradient between the surface and the sample core. We thus chose turkey liver samples as soft tissue test pieces for staining as liver tissue is one of the densest soft tissues present in both birds and mammalians. If the liver tissue can be completely and homogeneously stained within a reasonable time frame the dye should be capable of successfully staining other tissue types as well. Cuboidal turkey liver pieces of approximately 3 mm edge length were therefore treated in triplicates with 31.9 mm aqueous solutions of each dye 2 c–2 e, whereby the maximum water solubility of the barium‐eosin Y salt (2 c) was used as the concentration of the staining agents. Macroscopic investigations showed the best results using the BaII eosin Y salt 2 c with respect to uniform staining. In addition, no physical deformation of the tissue cubes, such as shrinking, was visible. An inhomogeneous and incomplete staining was observed for the samples treated with the CuII 2 d and PbII salts 2 e [13] even after an incubation time of 144 h (see Scheme 1 B and Supporting Information, chapter 8). To allow for an X‐ray contrast agent to enhance the soft‐tissue contrast, the standard histological staining protocol had to be tailored towards X‐ray μCT by means of pH adjustment of the tissue prior to staining, increasing the incubation times and the concentration of the contrast agent. As such acidification of the tissue sample prior to staining turned out to be crucial for 2 a and 2 c. The enhanced accumulation of both 2 a and 2 c in the cell cytoplasm can be explained by increased ionic interactions between the contrast agent and basic protein residues that are protonated at acidic pH values. [5a] Under these conditions, a macroscopically complete and homogeneous staining for the barium‐eosin Y salt (2 c) was achieved after incubation of the tissue for 72 h, while the tissue samples treated with 2 a suffered from inhomogeneities (see the Supporting Information, chapter 8).
In order to study the contrast enhancement of the barium‐eosin Y salt (2 c) in comparison to the eosin Y disodium salt (2 a) in more detail, CT measurements at a μCT system were performed for the tissue samples incubated for 72 h under different conditions. The obtained μCT data were analyzed and evaluated for (i) completeness of staining, (ii) presence of diffusion rings, (iii) contrast enhancement, (iv) appearance of CT artifacts as streaks, and (v) homogeneity of the staining.
The barium‐eosin Y‐treated samples (1 and 3), which have been acidified during fixation, offered a complete and homogeneous staining of the soft‐tissue samples, as indicated by the CT slices (Figure 2 A) and the constant plateau seen in the line plot (Figure 2 B). This result clearly confirms the macroscopic observations (see Scheme 1 B and Supporting Information, chapter 8) and shows the reliability and reproducibility of the staining method using 2 c as the dye. In addition, these probes (2 c, acidified) displayed a significantly higher gray value (Figure 2 B) when compared to the equimolar eosin Y disodium‐stained samples 2 and 6 and the non‐acidified barium‐eosin Y samples 5 and 7. As the gray values represent a measure for contrast enhancement (the higher the gray value the better the attenuation contrast), this refers to a significantly increased contrast of the acidified liver samples stained with 2 c compared to 2 a and thus demonstrates the impact of the heavy metal cation. This effect, however, was only observed for the barium‐eosin Y salt 2 c while other Ba salts containing low atomic number elements, such as Ba(OH)2 or Ba(OAc)2, failed as specific staining agents. These negative control experiments show nicely the mutual influence of the organic anion eosinate Y and the heavy‐metal barium cation for cytoplasm interaction and contrast enhancement. Besides this, the variations in the line plots of the acidified eosin Y disodium samples (2 and 6) as well as the non‐acidified barium‐eosin Y samples (5 and 7) seen at the beginning or end of the plateau, clearly indicate the formation of a diffusion ring, indicative of an incomplete and inhomogeneous staining of the soft tissue sample.
Figure 2.
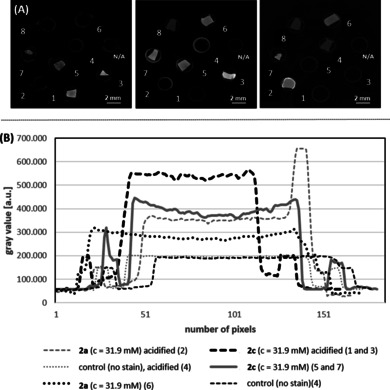
(A) Representative μCT slices of the equimolar stained turkey liver pieces (incubation time 72 h) and (B) the corresponding line plots. 1: 2 c (c=31.9 mm), acidified; 2: 2 a (c=31.9 mm), acidified; 3: 2 c (c=31.9 mm), acidified; 4: control sample (no staining agent was applied), acidified; 5: 2 c (c=31.9 mm); 6: 2 a (c=31.9 mm); 7: 2 c (c=31.9 mm); 8: control sample (no staining agent was applied). Parameters of the μCT setup (V|tome|X, Phönix X‐ray/ GE) used for the measurement: U=50 kV; I=110 μA; exposure time: 2 s; pixel size: 40 μm. The μCT slices were chosen so that all investigated samples are visible as they are mounted in different positions within the sample holder. The gray values were normalized to the sample holder, which was the same for all stained samples (0.5 mL Eppendorf tube).
Encouraged by the results obtained above using the barium eosin Y staining agent (2 c), we further explored a possible contrast enhancement by raising the water solubility of the barium eosinates. We thus developed a directed synthesis to selectively brominate the xanthene core in 3 to obtain the mono‐, di‐, and tri‐brominated fluorescein derivatives 4–6 (Scheme 2). Treatment of 3–6 with NaOH or Ba(OH)2 afforded after recrystallization the corresponding sodium and barium salts 2 and 7–10. To get a first hint at the hydrophilicity of these compounds, we determined the logP values of the lactones 1 and 3–6 as well as of the acid salts 2, 7, and 9 (Supporting Information, chapter 3). Here, an explicit correlation of the number of Br atoms and the partition coefficient was revealed, in particular for the barium fluoresceins 2 c and 7 c–10 c.
Scheme 2.
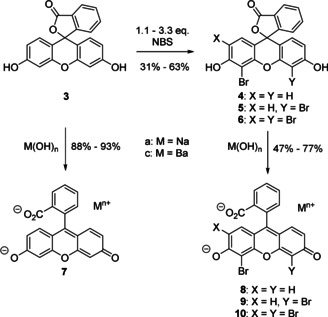
Selective bromination of fluorescein (3) and preparation of the corresponding sodium 7 a–10 a and barium salts 7 c–10 c.
Because of the significantly lowered lipophilicity of the dibromo barium fluoresceinate 9 c in comparison to the eosin Y salt 2 c in combination with its straightforward synthesis, the dibromo fluorescein 9 c was evaluated in more detail. In a second staining experiment the influence of the halogenation degree on the fluorescein core was studied with respect to contrast enhancement using μCT. Since the first staining experiment proved already a better performance of the barium‐eosin Y salt (2 c) compared to the eosin Y disodium salt (2 a), we decided to exclude 2 a from the current study. In line with the results described for 2 c before (see Figure 2), the soft‐tissue samples being acidified during fixation or prior to staining with 2 c and 9 c, respectively, displayed a better contrast enhancement compared to the non‐acidified samples (for details see the Supporting Information, chapter 10). The dibromo barium fluorescein derivative (9 c) performed better than 2 c when the maximum concentration of each compound in water was applied (c=45 mg mL−1 [c=72.0 mm] for 9 c; c=25 mg mL−1 [c=31.9 mm] for 2 c) offering a homogeneous staining of the whole tissue sample (see the Supporting Information, chapter 9, Figure S3). The increased contrast for 9 c can be explained by its enhanced water solubility of the dibromo compound 9 c. Overall, the barium xanthene derivatives 2 c and 9 c showed much better contrast enhancement compared to the sodium analogues 2 a and 9 a at such low concentrations.
To allow for comparison with the histological results and to showcase the compatibility of the developed barium fluorescein staining protocol with standard histological methods, the cell nucleus‐specific staining with the counter stain Mayr's hematoxylin was applied to the histological microscopic slide after staining with 2 c and μCT measurements. As expected, the cell cytoplasm still appeared pinkish (see the Supporting Information, chapter 12, Figure S4A) and the cell nuclei were highlighted purple in color (see the Supporting Information, chapter 12, Figure S4B). The barium dibromo fluoresceinate salt 9 c, staining of the cell cytoplasm, as well as the additional Mayr's hematoxylin counterstain (H‐stain) were therefore not disturbed by each other and thus standard histological slides (see the Supporting Information, chapter 12, Figure S4A, B) were obtained following standard histological H‐staining procedures. The resulting images were of high quality and suitable to undergo further histological analysis, which contributes to the practicality of our method and significantly enhances the sample availability.
After the in‐depth evaluation on the ability of the barium salts 2 c and 9 c to act as X‐ray CT tracers, we wanted to compare the staining quality of our newly developed dye 9 c to the recently introduced X‐ray stain 2 a. [5a] Therefore, we applied the dibromo fluorescein barium salt (9 c) to mouse kidney‐tissue pieces (≈5 mm edge length). The mouse kidney with its different tissue types offers various biological structures at multiple scales. After the acquisition of an overview scan, a volume of interest (VOI) was chosen and measured with high resolution as a local tomography (see the Supporting Information, video). The ability to obtain high‐resolution 3D data with isotropic resolutions of desired VOIs while keeping the soft‐tissue sample intact is a unique feature of μCT that cannot be found among other microscopy techniques such as most light or electron microscopy techniques.
Our results are displayed in Figure 3 and confirm homogenous staining throughout the sample without diffusion artifacts. The perspective view of a representative volume in Figure 3 A highlights the 3D arrangement of inner structures and connectivity between different tissue types. The provided contrast enabled the visualization of relevant anatomical structures within this volume of interest, the cortex and outer medulla region such as convoluted tubules, vessels, or medulla rays. Representative individual 2D μCT slices derived from the orthogonal planes of the volume in Figure 3 A are displayed in Figure 3 B–D. The validation of the μCT results was performed through histological analysis. The representative histological light microscopy image shown in Figure 3 E was obtained from the very same dibromo fluorescein barium salt (9 c) stained mouse kidney tissue piece seen in Figure 3 A. Here, the obtained histological section was counterstained with the standard histological procedure according to Mayr's sour hematoxylin to stain the cell nuclei, which were not targeted by the cytoplasm selective 9 c. This resulted in a typical H&E‐stained histological section, which corresponds very well with the μCT slice shown in Figure 3 C.
Figure 3.
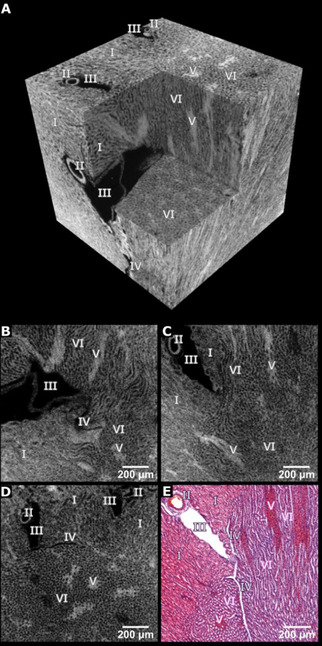
High‐resolution μCT data of the cortex and outer medulla region of a mouse kidney after application of the dibromo fluorescein barium salt (9 c). (A) Representative μCT volume of 1.20 mm × 1.20 mm × 1.20 mm (effective voxel size ≈3.3 μm). (B–D) Individual μCT slices derived from the orthogonal planes through the volume shown in (A). (E) Representative X‐ray barium eosin Y‐stained histological microscopic slide. The cell nuclei were counter stained with Mayr's sour hematoxylin. Legend: I proximal convoluted tubules, II: artery, III: vein, IV: capillary, V: medullary rays, and VI: loop of Henle.
Different gray values within the sample display varying concentrations of contrast agent accumulated in the soft tissue, that is, the higher the protonated protein/peptide content in the cytoplasm the more contrast agent can interact with these structures and the higher the contrast. This can be seen in the perspective view of a representative virtual volume in Figure 3 A and the individual CT slices in Figure 3 B–D, for example, labelled structures such as V appear very bright and III being black meaning no accumulation of contrast agent. The CT results are very well reflected in the histological slide where the structures V appear very pink indicating a high concentration of the contrast agent 9 c, while II and III being white highlight the absence of contrast agent. Thus, the staining results and image quality compare very well with the respective results obtained with the eosin Y disodium salt (2 a). [5a] A clear advantage is seen here in the enormous reduction of the contrast agent used to stain the biopsy samples from 300 mg mL−1 for 2 a to 45 mg mL−1 for 9 c. Even though the color of the dibromo fluorescein barium salt (9 c) shifted to orange‐pink when compared to the eosin Y disodium salt (2 a), the pathologists observed no problems to perform their histological analysis. Thus, the new X‐ray stain dibromo fluorescein barium salt (9 c) proved superior and is thus suitable for μCT even at low concentrations.
To conclude, the improved solubility of 9 c in water was crucial to obtain this new X‐ray staining agent that allows to non‐destructively and selectively visualize the cell cytoplasm of biological and medical soft‐tissue samples in three dimensions. The application of the staining protocol to turkey liver and mouse kidney tissue pieces underlines the reliability of the protocol and emphasizes the use for different tissue types. The ability to counterstain the biopsy samples using standard histological methods paves the way for establishing a convenient 3D X‐ray histology approach as a complementary tool for future histological analysis. This will offer access to additional information and support histologists where 2D imaging is facing its boundaries and thus meeting the demands to provide answers to advanced medical questions, which will benefit from targeted staining of specific biological structures as well as non‐destructive 3D imaging techniques.
Conflict of interest
The authors declare no conflict of interest.
Supporting information
As a service to our authors and readers, this journal provides supporting information supplied by the authors. Such materials are peer reviewed and may be re‐organized for online delivery, but are not copy‐edited or typeset. Technical support issues arising from supporting information (other than missing files) should be addressed to the authors.
Supplementary
Supplementary
Acknowledgements
This work was funded by the Emmy‐Noether (DFG, GU 1134‐3) and Heisenberg (DFG, GU 1134‐4) program of the German Research Foundation (DFG) to T.G. M.B. thanks the European Union Horizon 2020 research and innovation program under the Marie Skłodowska‐Curie Grant Agreement No. H2020‐MSCA‐IF‐2015–703745‐CONSALT. Open access funding enabled and organized by Projekt DEAL.
M. Busse, J. P. Marciniszyn, S. Ferstl, M. A. Kimm, F. Pfeiffer, T. Gulder, Chem. Eur. J. 2021, 27, 4561.
Contributor Information
Dr. Madleen Busse, Email: madleen.busse@tum.de.
Prof. Dr. Tanja Gulder, Email: tanja.gulder@uni-leipzig.de.
References
- 1.
- 1a. Andreasen A., Drewes A., J. Neurosci. Methods 1992, 45, 199–207; [DOI] [PubMed] [Google Scholar]
- 1b. Braverman M. S., Braverman I. M., J. Invest. Dermatol. 1986, 86, 290–294; [DOI] [PubMed] [Google Scholar]
- 1c. Meyer E. P., Domanico V. J., J. Neurosci. Methods 1988, 26, 129–132; [DOI] [PubMed] [Google Scholar]
- 1d. Streicher J., Weninger J. W., Müller G. B., Anat. Rec. 1997, 248, 583–602. [DOI] [PubMed] [Google Scholar]
- 2.
- 2a. Davidovits P., Egger M. D., Nature 1969, 223, 831; [DOI] [PubMed] [Google Scholar]
- 2b. Matsumoto B., Cell Biological Applications of Confocal Microscopy, Vol. 70, Academic Press, San Diego, 2002; [Google Scholar]
- 2c. Morales-Navarrete H., Segovia-Miranda F., Klukowski P., Meyer K., Nonaka H., Marsico G., Chernykh M., Kalaidzidis A., Zerial M., Kalaidzidis Y., eLife 2015, 4, e11214; [DOI] [PMC free article] [PubMed] [Google Scholar]
- 2d. Stevens J. K., Linda R. M., Judy E. T. in Three-Dimensional Confocal Microscopy: Volume Investigation of Biological Specimens, Vol. 1, Academic Press, San Diego, 1994; [Google Scholar]
- 2e. Stockert J. C., Blazquez-Castro A. in Fluorescence Microscopy in Life Sciences, Bentham Science Publishers, 2017; [Google Scholar]
- 2f. Girkin M., Carvalho M. T., J. Opt. 2018, 20, 053002. [Google Scholar]
- 3.
- 3a. Rosenthal J. V. M., Walker D., Bennett M., Mohun T. J., Birth Defects Res. C 2004, 72, 213–223; [DOI] [PubMed] [Google Scholar]
- 3b. Weninger J. W., Meng S., Streicher J., Müller G. B., Anat. Embryol. 1998, 197, 341–348. [DOI] [PubMed] [Google Scholar]
- 4. Denk W., Hortsmann H., PLoS Biol. 2004, 2, e329. [DOI] [PMC free article] [PubMed] [Google Scholar]
- 5.
- 5a. Busse M., Müller M., Kimm M. A., Ferstl S., Allner S., Achterhold K., Herzen J., Pfeiffer F., Proc. Natl. Acad. Sci. USA 2018, 115, 2293–2298; [DOI] [PMC free article] [PubMed] [Google Scholar]
- 5b. Jeffery N. S., Stephenson R. S., Gallagher J. A., Cox P., J. Biomech. Eng. 2011, 44, 189–192; [DOI] [PubMed] [Google Scholar]
- 5c. Metscher B. D., Dev. Dyn. 2009, 238, 632–640; [DOI] [PubMed] [Google Scholar]
- 5d. Metscher B. D., BMC Physiol. 2009, 9, 11; [DOI] [PMC free article] [PubMed] [Google Scholar]
- 5e. Mizutani R., Suzuki Y., Micron 2012, 43, 104–115; [DOI] [PubMed] [Google Scholar]
- 5f. Senter-Zapata M., Patel K., Bautista P. A., Griffin M., Michaelson J., Yagi Y., Pathobiology 2016, 83, 140–147; [DOI] [PubMed] [Google Scholar]
- 5g. Shearer T., Bradley R. S., Hidalgo-Bastida L. A., Sherratt M. J., Cartmell S. H., J. Cell Sci. 2016, 129, 2483–2492; [DOI] [PubMed] [Google Scholar]
- 5h. Virta M., Hannula I., Tamminen K., Lindfors K., Kaukinen A., Popp J., Taavela P., Saavalainen P., Hiltunen J., Hyttinen J., Kurppa K., Sci. Rep. 2016, 10, 13164. [DOI] [PMC free article] [PubMed] [Google Scholar]
- 6.
- 6a. Kerckhofs G., Sainz J., Maréchal M., Wevers M., Van de Putte T., Geris L. S., Chrooten J., Cartilage 2014, 5, 55–65; [DOI] [PMC free article] [PubMed] [Google Scholar]
- 6b. Müller M., d. S. Oliveira I., Allner S., Ferstl S., Bidola P., Mechlem K., Fehringer A., Hehn L., Dierolf M., Achterhold K., Gleich B., Hammel J. U., Jahn H., Mayer G., Pfeiffer F., Proc. Natl. Acad. Sci. USA 2017, 114, 12378–12383; [DOI] [PMC free article] [PubMed] [Google Scholar]
- 6c. Walton L. A., Radley R. S., Withers P. J., Ewton V. L., Watson R. E., Austin C., Sherratt M. J., Sci. Rep. 2015, 5, 10074; [DOI] [PMC free article] [PubMed] [Google Scholar]
- 6d. Ferstl S., Busse M., Müller M., Kimm M. A., Drecoll E., Bürkner T., Allner S., Dierolf M., Pfeiffer D., Rummeny E. J., Weichert W., Pfeiffer F., IEEE Trans. Med. Imaging 2019, 39, 1494–1500; [DOI] [PubMed] [Google Scholar]
- 6e. Müller M., Kimm M. A., Ferstl S., Allner S., Achterhold K., Herzen J., Pfeiffer F., Busse M., Sci. Rep. 2018, 8, 17855. [DOI] [PMC free article] [PubMed] [Google Scholar]
- 7.
- 7a. Chao W., Harteneck B. D., Liddle J. A., Anderson E. H., Attwood D. T., Nature 2005, 435, 1210–1213; [DOI] [PubMed] [Google Scholar]
- 7b. Falcone R., Jacobsen C., Kirz J., Marchesini S., Shapiro D., Spence J., Contemporary Physics 2011, 52, 293–318; [Google Scholar]
- 7c. Kirz J. C., J. Phys. Conf. Ser. 2009, 186, 012001. [Google Scholar]
- 8.
- 8a.http://bruker-microct.com/products/2211.htm;
- 8b.https://www.gemeasurement.com/sites/gemc.dev/files/geit-31344en nanotom m 0517.pdf;
- 8c.http://www.xradia.com/zeiss-xradia520versa/;
- 8d.http://www.xradia.com/zeiss-xradia-810-ultra/.
- 9. Martins de Souza e Silva J., Zanette I., Noel P. B., Cardoso M. B., Kimm M. A., Pfeiffer F., Sci. Rep. 2015, 5, 14088. [DOI] [PMC free article] [PubMed] [Google Scholar]
- 10.An overview on the use of eosin dyes in organic synthesis can be found in
- 10a. Hari D. P., König B., Chem. Commun. 2014, 50, 6688–6699; [DOI] [PubMed] [Google Scholar]
- 10b. Romero N. A., Nicewicz D. A., Chem. Rev. 2016, 116, 10075–10166; [DOI] [PubMed] [Google Scholar]
- 10c. Srivastava V., Singh P. P., RSC Adv. 2017, 7, 31377–31392. [Google Scholar]
- 11.An overview on eosin dyes used for protein staining can be found in
- 11a. Hong H. Y., Yoo G. S., Choi J. K., Anal. Lett. 1999, 32, 2427–2442; [Google Scholar]
- 11b. Selsted M. E., Becker H. W., Anal. Biochem. 1986, 155, 270–274. [DOI] [PubMed] [Google Scholar]
- 12. Russo P., Handbook of X-ray Imaging: Physics and Technology (Medical Physics and Biomedical Engineering), Taylor & Francis Inc., New York, 2018. [Google Scholar]
- 13.For the synthesis and characterization of the PbII eosin Y salt (2 e) see Anselmi C., Capitani D., Tintaru A., Doherty B., Sgamellotti A., Miliani C., Dyes Pigm. 2017, 140, 297–311. [Google Scholar]
Associated Data
This section collects any data citations, data availability statements, or supplementary materials included in this article.
Supplementary Materials
As a service to our authors and readers, this journal provides supporting information supplied by the authors. Such materials are peer reviewed and may be re‐organized for online delivery, but are not copy‐edited or typeset. Technical support issues arising from supporting information (other than missing files) should be addressed to the authors.
Supplementary
Supplementary


