

Summary
Flowering time is a key adaptive and agronomic trait. In Arabidopsis, natural variation in expression levels of the floral repressor FLOWERING LOCUS C (FLC) leads to differences in vernalization. In Brassica napus there are nine copies of FLC. Here, we study how these multiple FLC paralogues determine vernalization requirement as a system.
We collected transcriptome time series for Brassica napus spring, winter, semi‐winter, and Siberian kale crop types. Modelling was used to link FLC expression dynamics to floral response following vernalization.
We show that relaxed selection pressure has allowed expression of FLC paralogues to diverge, resulting in variation of FLC expression during cold treatment between paralogues and accessions. We find that total FLC expression dynamics best explains differences in cold requirement between cultivars, rather than expression of specific FLC paralogues.
The combination of multiple FLC paralogues with different expression dynamics leads to rich behaviour in response to cold and a wide range of vernalization requirements in B. napus. We find evidence for different strategies to determine the response to cold in existing winter rapeseed accessions.
Keywords: Brassica napus, flowering locus C, gene dosage balance, modelling, phenotypic plasticity, polyploidy, transcriptomics, vernalization
Introduction
Many plants time developmental changes to coincide with favourable seasons. To synchronize reproduction with spring, several wild and crop species require long periods of winter‐like cold to accelerate flowering, a process called vernalization. Within species, the duration of cold that plants need to be exposed to prior to flowering is a major determinant of when they flower (reviewed by Chouard, 1960). The allotetraploid crop Brassica napus (rapeseed, canola) has been bred for different environments in order to maximize time available for growth, reduce exposure to adverse environmental conditions and to coordinate with the land management cycle (Marjanović‐Jeromela et al., 2007; Canola Council of Canada, 2013). Consequently, B. napus varieties can be grouped into ‘crop types’. Spring types have essentially no cold requirement and are planted and harvested in the same season, with no over‐wintering. Semi‐winters have a weak vernalization requirement and are grown in regions with mild winters. Winter types are often characterized as having a strong vernalization requirement, and need to experience an extended period of cold prior to flowering (reviewed by Leijten et al., 2018). Within each crop type, further variation exists in the amount of cold required for flowering, and in the sensitivity of flowering time to vernalization treatment (Schiessl et al., 2017).
In the diploid Arabidopsis thaliana, most natural variation in vernalization requirement arises from differences in expression of the well‐characterized transcriptional repressor FLOWERING LOCUS C (FLC) (Johanson et al., 2000; Lempe et al., 2005; reviewed by Bloomer & Dean, 2017). FLC is a MADS‐box transcription factor that represses the central flowering regulators FLOWERING LOCUS T (FT) and SUPPRESSOR OF OVEREXPRESSION OF CO 1 (SOC1) in a quantitative manner, such that in warm, long day conditions, the level of Arabidopsis FLC (AtFLC) expression is directly correlated with time to the floral transition (Lee et al., 2000; Michaels et al., 2005; Hepworth et al., 2020). The level of FLC expression is set early in seed development and is influenced both by trans‐factors, such as the gene FRIGIDA, and by noncoding cis‐variation at the FLC locus itself, to determine whether the plant will show a ‘winter‐annual’ or ‘rapid‐cycling’ type life history (Johanson et al., 2000; Lempe et al., 2005; Shindo et al., 2005; reviewed by Bloomer & Dean, 2017).
When Arabidopsis is subjected to winter‐like cold, AtFLC is transcriptionally repressed and epigenetically silenced (Sung & Amasino, 2004; reviewed by Song et al., 2013; Xu & Chong, 2018; Costa & Dean, 2019; He et al., 2020). Epigenetic silencing required the cold‐induction of VERNALIZATION INSENSITIVE3 (VIN3) a PHD‐family protein required to activate the Polycomb Repressive Complex2 at the AtFLC locus (Sung & Amasino, 2004). The PHD‐PRC2 complex methylates H3 lysine residues (H3K27me3) to silence transcription (Sung & Amasino, 2004; Wood et al., 2006; De Lucia et al., 2008). On return to warm conditions, VIN3 expression is abolished, but H3K27me3 is spread across the AtFLC locus to maintain a stable ‘memory’ of cold, so that in spring, AtFLC expression remains repressed, allowing flowering to be triggered by a combination of other environmental and internal signalling pathways (Michaels & Amasino, 1999; Searle et al., 2006).
Epigenetic silencing at FLC is a slow process, occurring over weeks in the cold. H3K27me3 accumulates and represses AtFLC in a quantitative manner until this repression is saturated (Sheldon, 2000; Angel et al., 2011). The quantitative nature of FLC silencing and cold‐memory means that, in Arabidopsis, the flowering behaviour of natural variants is determined both by the pre‐vernalization levels of FLC and by the response‐rate of reduction of AtFLC expression in the cold (Shindo et al., 2006; Li et al., 2014; Bloomer & Dean, 2017; Hepworth et al., 2020).
The role of FLC is similar in other Brassicaceae (Leijten et al., 2018), however polyploids such as B. napus have multiple copies of genes (paralogues), many of which exhibit differences in regulation (Jones et al., 2018). We recently reported that flowering time genes are over‐represented in the B. napus genome relative to other families (Jones et al., 2018); in particular, FLC has nine identifiable copies in B. napus. The majority of these are believed to have been generated through whole genome duplication, as B. napus arose by alloploidy between the paleo‐polyploid ancestors of B. rapa (A‐genome) and B. oleracea (C‐genome), however BnaFLC.A03b, BnaFLC.C03b, and BnaFLC.09a are nonsyntenic copies, and instead arose through tandem or segmental duplication (Cai et al., 2014).
Over‐retention of paralogues suggests they may be dosage sensitive genes, retained to maintain stoichiometric expression balance, or alternatively, that they may play a role in facilitating adaptation and the acquisition of new functionality (Maere et al., 2005). A persuasive explanation for the retention of paralogues following whole genome duplication is the gene dosage hypothesis, in which gene loss would lead to negative consequences by perturbing the stoichiometric ratio of gene products. By contrast, individually duplicated dosage sensitive genes are expected to be more likely to be lost for the same reason (Birchler & Veitia, 2010, 2012). If selection acts at the level of total gene expression of a gene for which there are multiple copies, then individual paralogues can drift in their expression as long as this effect is compensated for by other paralogues (‘compensatory drift’, Thompson et al., 2016). Thus, within the context of a polyploid organism not all paralogous copies of a gene are necessarily equally important for its canonical function and reduced selection pressure arising from multiple copies can allow sub‐ or neo‐functionalization to a different role (Conant & Wolfe, 2008; Hua et al., 2009; Yu et al., 2018; Jones et al., 2018; Wu et al., 2019). By bringing together two paleo‐polyploid genomes with unique evolutionary histories, B. napus has assembled a large pool of FLC paralogues with potentially wide variation in expression profiles and/or function to draw upon when adapting to different flowering requirements. How, and whether all FLC paralogues contribute to vernalization requirement and determine flowering behaviour is therefore not clear.
There is evidence that only certain FLC paralogues have maintained a role in vernalization in B. napus. Expression of some BnaFLC paralogues are found to be unresponsive to cold (Schiessl et al., 2019). This has been interpreted to indicate that they may no longer be involved in the cold requirement machinery and may have sub‐functionalized to some different role in other processes besides cold response in flowering regulation (Schiessl et al., 2019). Consistent with this, associative genomics studies using different panels of accessions have identified sequence or expression variation in only a subset of paralogues (BnaFLC.A02, BnaFLC.A03b, BnaFLC.A10, and BnaFLC.C02) as associated with cold required for flowering (Hou et al., 2012; Wu et al., 2012, 2019; Raman et al., 2013; Song et al., 2020; Tudor et al., 2020). (See Table 1 for paralogue naming conventions.) Further evidence for the roles of specific paralogues in generating variation was provided by the demonstration that a combination of BnaFLC.A10 with a defined transposable element together with a functional BnaFLC.A02 is required for winter crop types (Yin et al., 2020). This is despite the fact that other paralogues are capable of delaying flowering in Arabidopsis, or have been implicated in flowering time control in the closely related B. rapa and B. oleracea species, suggesting that they are largely conserved in flowering‐time control (BnaFLC.A03a, BraFLC.A02, BraFLC.A03a, BraFLC.A03b, BraFLC.A10, BoFLC.C02, BoFLC.C03b, BoFLC.C09a and BoFLC.C09b; Tadege et al., 2001; Schranz et al., 2002; Pires et al., 2004; Lin et al., 2005; Kim et al., 2007; Razi et al., 2008; Irwin et al., 2016; Abuyusuf et al., 2019; Stansell et al., 2019).
Table 1.
FLOWERING LOCUS C (FLC) gene identities (IDs) in Brassica napus.
| Short FLC ID | Full FLC ID | EnsemblPlants FLC ID |
|---|---|---|
| BnaFLC.A01 | ||
| BnaFLC.A02 | BnaA02g00370D | GSBRNA2T00143535001 |
| BnaFLC.A03a | BnaA03g02820D | GSBRNA2T00129741001 |
| BnaFLC.A03b | BnaA03g13630D | GSBRNA2T00142187001 |
| BnaFLC.A10 | BnaA10g22080D | GSBRNA2T00135921001 |
| BnaFLC.C02 | BnaC02g00490D | GSBRNA2T00068991001 |
| BnaFLC.C03a | BnaC03g04170D | GSBRNA2T00134620001 |
| BnaFLC.C03b | BnaC03g16530D | GSBRNA2T00024568001 |
| BnaFLC.C09a | BnaC09g46500D | GSBRNA2T00016124001 |
| BnaFLC.C09b | BnaC09g46540D | GSBRNA2T00016119001 |
Here, building on the model of gene dosage (Conant et al., 2014; Cheng et al., 2018) and drift compensation (Thompson et al., 2016) and extending these ideas to dynamical behaviour, we test the hypothesis that total FLC expression dynamics, as opposed to previously reported individual FLC paralogues, are key to determining flowering time. We present new transcriptome time series across a range of B. napus life‐histories and demonstrate that when FLC expression over vernalization is considered, total BnaFLC expression explains variation in the vernalization requirements between rapeseed crop types, suggesting that all expressed paralogues of BnaFLC are important in determining crop type cold requirement and response.
We show that the expression of different BnaFLC paralogues decline at different rates during vernalization (suggesting that the paralogues may have sub‐functionalized within their roles as quantitative environmental sensors in the vernalization pathway), resulting in expression sensitivity over different durations of cold. We find evidence that reduced selection pressure has potentiated this divergence of response.
In B. napus, we also see variation in the sensitivity of expression to the cold of each BnaFLC paralogue between accessions. Modelling suggests that this variation in cold response rate (in addition to pre‐vernalization expression levels) is important in determining vernalization requirement.
These findings suggest that total BnaFLC expression can be controlled by many strategies, as expression of one paralogue can be compensated for by a variety of combinations of expression of the others. Consistent with this, we see examples of numerous different FLC composition strategies which result in the same crop type, within the well‐studied Renewable Industrial Products from Rapeseed (RIPR) accession panel (Havlickova et al., 2018; Schiessl et al., 2019).
Materials and Methods
Plant growth conditions, RNA extraction, sample preparation and sequencing
Brassica napus cv. Stellar, Zhongshuang 11, Tapidor_JIC, Express‐617, and Ragged Jack plants were sown in cereals mix (40% medium grade peat, 40% sterilized soil, 20% horticultural grit, 1.3 kg m–3 PG mix 14‐16‐18 + Te base fertilizer, 1 kg m–3 Osmocote Mini 16‐8‐11 2 mg + Te 0.02% B, wetting agent, 3 kg m–3 maglime, 300 g m–3 Exemptor). Material was grown in a Conviron MTPS 144 controlled environment room with Valoya NS1 LED lighting (250 µmol m−2 s−1) 18°C : 15°C, day : night, 70% relative humidity with a 16 h day. At day 21, plants were put into vernalization at 5°C (8 h day).
The Tapidor accession used to generate this data is from a different seed lineage to that used in other studies (Havlickova et al., 2018), and during this analysis it became clear that differences exist in its FLC complement. Here this accession is referred to as Tapidor_JIC to differentiate it from the canonical Tapidor accession.
At each sampling timepoint three replicates samples containing either three seedings or three first true leaves were collected. For Express‐617 only one leaf sample was collected at each timepoint. Samples were ground in LN2 to a fine powder before RNA extraction and DNase treatment were performed following the method provided with the EZNA® Plant RNA Kit (Omega Bio‐tek Inc., http://omegabiotek.com/store/).
RNA samples were processed at Novogene (Beijing, China); complementary DNA (cDNA) libraries were constructed using NEBNext Ultra Directional Library Kit (New England Biolabs Inc., Ispwich, MA, USA), sequencing was performed using Illumina HiSeq X, resulting in 150 bp paired end reads.
Bioinformatics
Publicly available single‐end fastq files of gene expression over vernalization were downloaded from the National Centre for Biotechnology Information (NCBI) Sequence Read Archive (SRA), project ID PRJNA398789 (Jones et al., 2018). Publicly available single‐end RNA sequencing data for pre‐vernalization gene expression data in the RIPR panel were downloaded from NCBI SRA, project ID PRJNA309367 (Havlickova et al., 2018).
Gene expression quantification was carried out using Hisat v.2.0.4 (Kim et al., 2015) and Stringtie v.1.2.2 (Pertea et al., 2015). Reads were aligned to the Darmor‐bzh reference genome (Chalhoub et al., 2014), downloaded from www.genoscope.cns.fr/brassicanapus/data/.
Phylogenetic analyses
Coding sequences and corresponding protein sequences were curated based on aligned RNA sequencing reads, apart from BnaFLC.C03b which was not expressed in any sample. A codon aligned nucleotide sequence was then generated as described (Suyama et al., 2006) manually edited in geneious prime (v.2020.0.3). Protein sequence alignment and Neighbour‐Joining tree were generated using geneious prime with default settings. ω ratios (dN/dS) were calculated using the Ka/Ks webtool from CBU (http://services.cbu.uib.no/tools/kaks). The phylogenetic tree was plotted using the phytools R package (Revell, 2012).
Simulation of expected RNA sequencing mis‐mapping rate between FLC paralogues
Using the FLC gene models in the Darmor‐bzh reference sequence (Chalhoub et al., 2014, http://www.genoscope.cns.fr/brassicanapus/data/), ArtificialFastqGenerator (Frampton & Houlston, 2012), was used to generate simulated reads, with read‐length, and sequencing error rates sampled from our real Fastq files. Simulated reads were put through the same alignment pipeline as the real data.
FLC expression model fitting
FLC expression over vernalization was assumed to follow an exponential decay function. This is analogous to the equation governing radioactive decay and reflects the assumption that the probability of each FLC locus in a cell switching from ‘ON’ to ‘OFF’ is constant over time during vernalization.
To model experimentally measured FLC expression over vernalization for each paralogue of FLC and total FLC in each accession, an analysis of variance (ANOVA) test was used to select between
which models FLC decay to zero given sufficient time and
which models FLC decay to some nonzero value c. The selected model was carried forward for analysis. In these equations, y is FLC expression measured in TPM (transcripts per kilobase million), x is days of cold, and a, b and c are fitted parameters. The parameters a and c together govern pre‐vernalization expression, b governs the rate of decay.
For the prediction of RIPR panel FLC expression levels over vernalization, model 1 was assumed. The experimentally measured FLC expression level at 21 d was used as , and was set according to the assumptions described later.
Results
Total FLC expression over vernalization treatments corresponds to expected duration of cold requirement
We hypothesized that different crop types of B. napus will exhibit different total FLC expression dynamics. This was based on previous reports that link FLC expression to vernalization requirements in Arabidopsis accessions (Johanson et al., 2000; Lempe et al., 2005; Li et al, 2014; Bloomer & Dean, 2017), that flowering time depends on the decline of FLC expression during the cold (Shindo et al, 2006; Bloomer & Dean, 2017; Takada et al., 2019; Hepworth et al, 2020), and that expression levels can be tuned to be optimal for their environment (Dekel & Alon, 2005).
To test this hypothesis, we studied BnaFLC expression over vernalization time‐courses in six exemplar accessions of different crop types, one time‐course has been previously reported (Jones et al., 2018), and four were generated for this study. Stellar and Westar are spring oil seed rape (OSR) accessions, Zhongshuang 11 is a Chinese semi‐winter OSR, Tapidor_JIC and Express‐617 are winter OSR accessions, and Ragged Jack is a Siberian kale accession with a stronger vernalization requirement (Supporting Information Fig. S1).
To model the response of the BnaFLC copies to cold, exponential decay models were fit to the total BnaFLC expression data with parameters corresponding to pre‐vernalization expression levels and expression decay rates during vernalization (also referred to here as ‘cold response’). In Arabidopsis, AtFLC expression changes during vernalization have been described by a biphasic exponential decay model, corresponding to periods of epigenetically independent and dependent downregulation, as diagnosed by low and high expression of the PHD protein VIN3, respectively (Hepworth et al., 2018). However, under our experimental vernalizing conditions, VIN3 expression rapidly increased (Fig. S2), so monophasic models were sufficient.
As shown in Fig. 1(a), pre‐vernalization total BnaFLC expression does not correspond well to vernalization requirement. For example, the winter variety Tapidor_JIC has higher pre‐vernalization total BnaFLC expression than Ragged Jack but requires a shorter vernalization period (Fig. S1). Furthermore, the semi‐winter Zhongshuang 11 has similar pre‐vernalization BnaFLC expression levels to the winter type accessions Express‐617 and Ragged Jack. However, there are clear differences in the rate at which total BnaFLC expression declines under vernalization between varieties. For example, the initially high levels of BnaFLC seen in Zhongshuang 11 decay very rapidly under these vernalizing conditions. These differences are statistically significant given the exponential decay assumption (Fig. 2b).
Fig. 1.
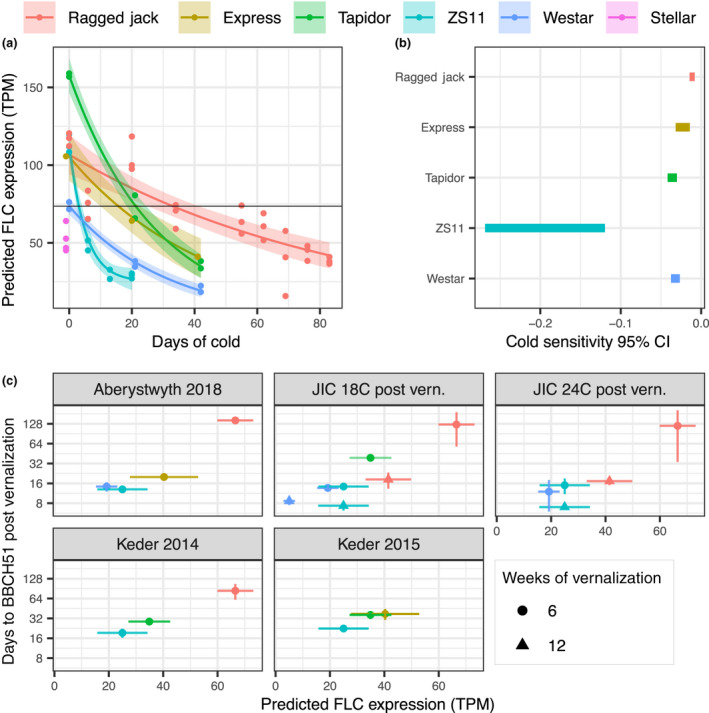
Total FLOWERING LOCUS C (FLC) expression corresponds well to vernalization requirement in Brassica napus when differences in expression response to cold are accounted for. (a) Pre‐vernalization FLC expression and response of FLC expression to cold are important for vernalization requirement. Time at which total FLC expression drops below a threshold value in each accession is consistent with cold requirement for competence to flower. Measured total FLC (summed expression of all nine FLC genes) is plotted against days of vernalization at 5°C (points). Mean and 95% confidence interval for mean plotted for each accession assuming an exponential decay model (line and ribbon). Horizontal line indicates approximate proposed floral competence threshold based on pre‐vernalization FLC expression in Westar. (b) The fitted FLC response to cold is statistically different between accessions. The 95% confidence interval range for the estimated exponential decay rate (parameter b in the equation ; see the Materials and Methods section) of total FLC expression over vernalization time. (c) Below the threshold floral competence level, floral development rate corresponds well to remaining post‐vernalization total FLC. Predicted total FLC expression is derived from models fit to FLC expression over vernalization for periods of 12 wk (Ragged Jack), 6 wk (Tapidor_JIC, Westar), or 3 wk (Zhongshuang 11) as shown in (a). The number of days post‐vernalization to reach developmental stage BBCH51 (buds visible, Meier et al., 2009) were measured in separate experiments after 6 or 12 wk of vernalization. Mean values and 95% confidence intervals for mean values are plotted. The association between predicted FLC and time taken is surprisingly clear, considering that different individuals are considered, and for some cases the extrapolation of vernalization times from the data used to fit the models. This is most extreme for Zhongshuang 11 (ZS11), in which final measurements at 3 wk are used to make predictions at 12 wk, which may explain its relatively poor agreement with the consensus pattern. Expression levels are given in TPM (transcripts per kilobase million).
Fig. 2.
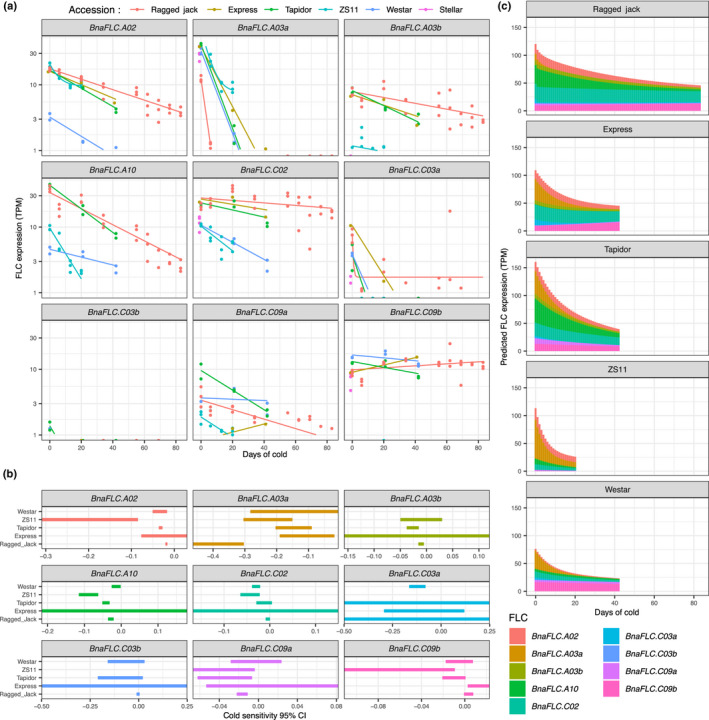
Differences in response of total FLOWERING LOCUS C (FLC) expression during vernalization are a consequence of pre‐vernalization composition of FLC paralogues, and of differences in the cold response of the same loci between Brassica napus accessions. (a) Experimental and fitted models for expression of individual FLC paralogues over vernalization. The Y‐axis is log scale, meaning that the gradient of the lines is equal to the exponential decay rate . Differences in this rate are clearly seen between the major expressed paralogues. (b) Confidence intervals show that differences between paralogues, and between accessions at a single locus can be statistically significant. The 95% confidence interval range for the estimated decay rates in the different FLC paralogues among the six‐accession panel. (c) Predicted expression levels of individual FLC paralogues, stacked to show contribution to total FLC level in different accessions. Variation in the relative expression of cold responsive and unresponsive paralogues, as well as cold response at each locus contribute to the quantitatively different behaviour of total FLC over cold. Expression levels are given in TPM (transcripts per kilobase million).
The spring variety Westar flowers rapidly without cold treatment. If pre‐vernalization total BnaFLC expression in the spring variety Westar is taken as the approximate level which is insufficient to prevent flowering, we find that the order in which the total BnaFLC of each variety is predicted to cross this threshold corresponds to their vernalization requirement based on crop type. Use of this threshold level is consistent with the experimental observation that Ragged Jack requires c. 6 wk (42 d) vernalization at 5°C for floral competence (Fig. S1). Below this threshold, predicted total BnaFLC expression levels after 6 and 12 wk vernalization correspond well to the time taken to reach BBCH51developmental stage (buds visible, Meier et al., 2009) after removal from vernalizing conditions (Fig. 1c). We conclude that total BnaFLC expression dynamics correlate with different cold requirements between B. napus crop types.
Differences in total BnaFLC cold response are caused both by differences between paralogues within an accession and differences in homologue behaviour between accessions
We next asked what might cause the different rates of decline in total BnaFLC expression. We hypothesized that different FLC paralogues may have different expression decay rates. To investigate this, we examined the expression of the nine individual paralogues in each B. napus accession.
As different BnaFLC paralogues are highly similar, being up to 98.48% identical at the sequence level (BnaFLC.A03a vs BnaFLC.C03a), we first ensured that our RNA sequencing data was able to distinguish between the paralogues. Under simulation, paired‐end reads are able to distinguish well between paralogues (Fig. S3; Table S1). For shorter, single‐end RNA sequencing data (Havlickova et al., 2018; Jones et al., 2018), more mis‐mapping can be expected, but we see that paralogues can still be distinguished (Fig. S4).
As previously reported, some paralogues are expressed at different levels in the different accessions prior to vernalization (Schiessl et al., 2019). Interestingly, Express‐617 (a winter type accession), has spring‐type levels of pre‐vernalization BnaFLC.A10 (Fig. 2a), which has been repeatedly identified as discriminating between spring and winter behaviour (Hou et al., 2012; Schiessl et al., 2017, 2019; Wu et al., 2019; Song et al., 2020). However, in Express‐617 this spring‐type BnaFLC.A10 paralogue is compensated for by higher expression of a combination of other BnaFLC paralogues, notably BnaFLC.A02, BnaFLC.C02 and BnaFLC.C03a, resulting in a high total level of BnaFLC. This finding emphasizes the importance of considering the BnaFLC loci in combination, rather than individually.
In addition to differences in pre‐vernalization expression level, statistically significant differences in cold expression response exist between paralogues (Fig. 2a,b). For example, the expression of BnaFLC.A03a paralogue declines rapidly with time across all tested accessions in the first 3 wk of vernalization (strong cold response). By contrast, expression of the BnaFLC.C09b locus either maintains, or slightly increases expression during cold in all accessions (cold insensitive). Other paralogues have varied cold responses between these two extremes. Interestingly, there are also significant differences in the rate at which expression declines between accessions for equivalent FLC paralogues, including in the BnaFLC.A02, BnaFLC.A10 and BnaFLC.C02 copies, genes which have recently been associated with crop type differences (Song et al., 2020; Yin et al., 2020).
In order to assess the relative importance of the pre‐vernalization BnaFLC composition of highly cold responsive and unresponsive BnaFLC paralogues, as compared to differences in responsiveness at the same loci between accessions, we plotted how the individual paralogues are predicted to contribute to the total BnaFLC level over cold days (Fig. 2c). This analysis suggests that Zhongshuang 11 has a low vernalization requirement compared to winter crop types primarily because the rapid‐vernalizing BnaFLC.A03a type makes up a large proportion of its total pre‐vernalization FLC. Although expression of many other paralogues decays rapidly in Zhongshuang 11 relative to other accessions, they are not initially expressed at a high level, so that their large cold response has relatively little effect on total BnaFLC response. By contrast, Ragged Jack appears to require an extreme vernalization treatment relative to Tapidor_JIC and Express‐617, partly because its pre‐vernalization FLC composition is weighted away from BnaFLC.A03a, towards more stable paralogues, but also because many paralogues of FLC appear to be less cold responsive than in Express‐617 or Tapidor_JIC. For example, BnaFLC.A10 is highly expressed in both Tapidor_JIC and Ragged Jack, but is more stably expressed in the latter.
Together, these analyses suggest that total FLC expression dynamics, comprising individual FLC paralogues that have diverged in their response to cold, determine vernalization requirements in the six studied B. napus accessions.
Divergent expression dynamics are associated with relaxed selection strength acting on coding sequences
In order to gain insights into the diversity of expression dynamics observed for the multiple BnaFLC paralogues, as well as the origin of this variation, we first clustered the BnaFLC genes based on their expression dynamics in the six accessions (Fig. 3a). This clustering identified three main expression types (A, B and C). Cluster A comprised genes with relatively cold stable expression (BnaFLC.C02, BnaFLC.C09b). Cluster B comprised genes with a moderate expression decay rate (BnaFLC.A10, BnaFLC.A02) and cluster C consisted of genes that had either a rapid decay rate or low overall levels of expression (BnaFLC.A03a, BnaFLC.A03b, BnaFLC.C03a, BnaFLC.C03b, BnaFLC.C09a). Notably, this clade included all genes that arose through tandem or segmental duplications (BnaFLC.A03b, BnaFLC.C03b, BnaFLC.C09a), including the presumed pseudogene (BnaFLC.C03b).
Fig. 3.
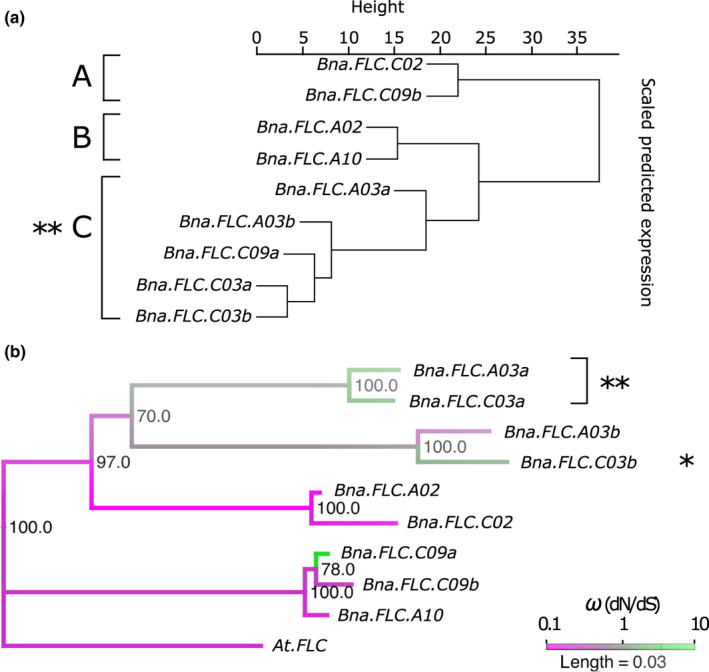
Divergent expression dynamics are associated with relaxed selection on coding sequences. (a) Brassica napus FLOWERING LOCUS C (FLC) genes clustered by similarity in expression during vernalization. Dendrogram shows clustering by Euclidean distance between expression profiles during vernalization in the six core accessions. Three main expression types are observed (A, B, and C) corresponding to cold stable expression (A), moderate decay rate through vernalization (B) and rapid decay or low expression levels (C). (b) A phylogenetic tree based on codon aligned coding sequences with Arabidopsis FLC (AtFLC) as an outgroup. Bootstrap confidence levels (percentage of 1000 replicates) are indicated at each node. Colour scale indicates the ω ratio calculated along each branch. Asterisks indicate the significance levels of the Relax test for relaxed selection (*,P < 0.05; **,P < 0.01).
The gene balance hypothesis (Birchler & Veitia, 2010) predicts that duplicates of dosage sensitive genes are less likely to be selectively maintained following segmental duplication than following whole genome duplication (Conant et al., 2014; Cheng et al., 2018). We wondered whether the divergent expression types seen for type C genes might therefore be associated with altered signatures of selection.
To investigate this further we determined the ratio of nonsynonymous to synonymous substitution rates (ω = dN/dS) along branches of an FLC phylogenetic tree. All genes belonging to expression types A and B showed ω values below 0.5 consistent with purifying selection (Fig. 3a), i.e. selection against deleterious variation.
By contrast, four out of five type C expression genes had ω values at or above 1, consistent with relaxed or positive selection (Fig. 3b). We subsequently used Relax, a test based on random effects branch‐site evolutionary models (Wertheim et al., 2014), to formally compare the strength of selection acting on expression type C genes, to that acting on type A and B genes. Rather than use a single gene‐wide ω, Relax estimates a distribution of ω values over all sites. Importantly, this allows it to efficiently distinguish between an increase in ω due to general relaxed selection from an increase in ω due to intensified positive selection at a sub‐set of sites. Explicitly, Relax estimates a separate discrete distribution of ω for reference and test branches in a codon‐based phylogenetic framework. A likelihood ratio test then compares the null model in which the distribution of ω is the same for reference and test branches to an alternative model in which the test ω distribution is modified by a free ‘selection intensity’ parameter K. A value of K < 1 indicates relaxed selection whilst a value of K > 1 indicates increased selection (Wertheim et al., 2014).
The Relax test demonstrated that coding sequences of type C genes have experienced a significant reduction in selection strength compared to those of expression type A and B (K = 0.03, P = 0.0017). We re‐ran the analyses for individual genes or pairs of genes with similar expression profiles in clade C. Relaxed selection was confirmed for BnaFLC.A03a/BnaFLC.C03a (K = 0.00, P = 0.0012) and for the pseudogene BnaFLC.C03b (K = 0.00, P = 0.045) but not for BnaFLC.A03b (P = 0.641) suggesting that this last gene is still experiencing purifying selection, consistent with its lower ω value (Fig. 3b). BnaFLC.C09a is a very recent duplicate and had therefore accumulated insufficient substitutions (a single nonsynonymous substitution) for meaningful analysis. These findings are consistent with the hypothesis that individual paralogues may drift in their expression and that reduced expression may reduce selection pressure and promote neo‐ and sub‐functionalization (Thompson et al., 2016). In the case of BnaFLC.A03a, and BnaFLC.C03a, this sub‐functionalization apparently takes the form of an increased cold response sensitivity, diversifying the range of cold response rates available to the polyploid within the FLC gene group.
Different strategies for pre‐vernalization BnaFLC composition exist within the winter crop type
The finding that total FLC dynamics is determined by combining paralogues with different cold responses suggests that different combinations could be employed to achieve a similar outcome. In order to assess this inference we considered expression of BnaFLC paralogues in a subset of the RIPR panel comprising 37 spring, 43 winter, six semi‐winter crop types, and nine swede types (Havlickova et al., 2018). The RIPR panel data was collected pre‐vernalization (Havlickova et al., 2018). This panel includes the six varieties measured in our time‐course over vernalization.
Consistently among the semi‐winter varieties included in the RIPR panel, a comparatively large proportion of the total BnaFLC is made up of the highly responsive BnaFLC.A03a copy (Fig. 4). This fits with a simple hypothesis, in which prior to vernalization the BnaFLC.A03a copy inhibits flowering, but rapidly decays with cold, leaving the total other paralogues insufficiently expressed to prevent flowering. Conversely the swede types, which have an extreme, long vernalization requirement, commonly have a low BnaFLC.A03a to BnaFLC.A10 expression ratio relative to other accessions.
Fig. 4.
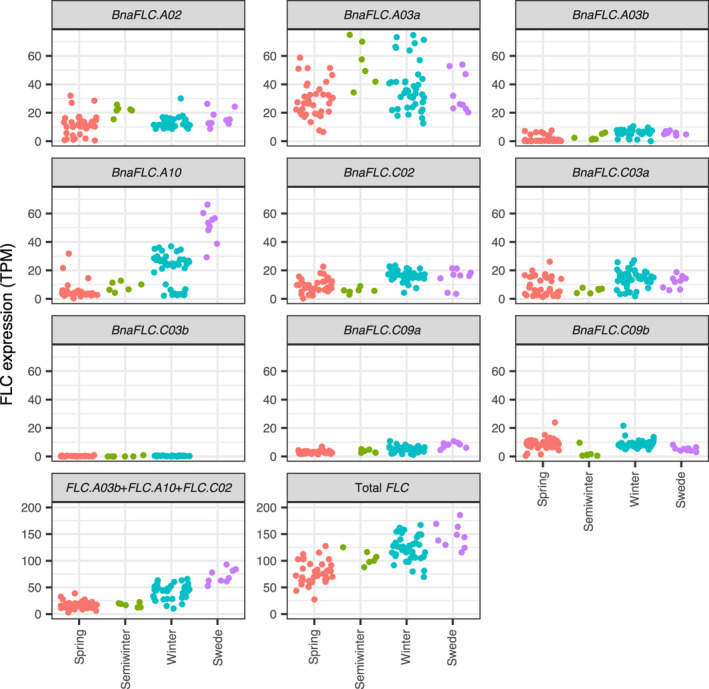
Pre‐vernalization FLOWERING LOCUS C (FLC) levels in Brassica napus do not distinguish well between crop types. Each point corresponds to FLC expression in a 3‐wk‐old un‐vernalized leaf sample. Although total FLC expression is associated with crop type (as there is a difference in the mean expression level between spring and winter types), it does not distinguish between crop types (as the distributions of expression levels in spring and winter crop types overlap), and so it is not sufficient to explain why an accession has a spring type or a winter type vernalization requirement. Similarly, expression of some individual paralogues (BnaFLC.A03b, BnaFLC.A10, BnaFLC.C02) were found to associate with the spring, winter split (Schiessl et al., 2019), but are not sufficient to separate them, either considered individually or in combination (BnaFLC.A03b + BnaFLC.A10 + BnaFLC.C02). Expression levels are given in TPM (transcripts per kilobase million).
As previously reported, although total BnaFLC expression prior to vernalization is associated with crop type, it is a poor discriminant between spring and winter types in this panel (Fig. 4, total FLC subplot), and pre‐vernalization expression levels of BnaFLC.A10, BnaFLC.A03b and BnaFLC.C02 provide the best discriminants between spring and winter crop types in this data (Schiessl et al., 2019). However, pre‐vernalization FLC expression in the RIPR panel makes it clear that Express‐617 is not unusual in having atypical expression of one of these key paralogues for its crop type. Fig. 4 shows that expression of these paralogues is insufficient to explain the spring–winter crop type split: the range of expression levels of every individual paralogue of BnaFLC shows a large overlap between spring and winter crop types. Of the 37 spring and 43 winter accessions, eight spring types and four winter types have noncanonical expression of BnaFLC.A03b. Three spring accessions, and 11 winter accessions have noncanonical BnaFLC.A10 expression levels, and the majority of spring types have greater BnaFLC.C02 expression than the lowest winter type.
It is therefore insufficient to consider each FLC paralogue in isolation to explain the cold requirements of these accessions. Moreover, a simple combination of pre‐vernalization expression of the paralogues which have previously been identified as best distinguishing spring from winter are still not able to separate them. Considering BnaFLC.A03b + BnaFLC.A10 + BnaFLC.C02; 34 spring lines express more of these than the lowest winter line, and 12 winter lines express less than the highest spring line.
Among the winter‐type accessions, several different ‘strategies’ for the composition of pre‐vernalization FLC have arisen (Fig. 5). Broadly, there are two different high pre‐vernalization total FLC strategies (groups A and C), and one lower total FLC group (group B). Members of group B express proportionately more of the cold‐stable FLC paralogues identified in the previous section, whereas for example in group A, approximately half of the total FLC is composed of the rapidly cold responsive BnaFLC.A03a copy. Further nested subgroups are evident within each of these broad strategies. For example; within both groups A and B, there are examples of spring and winter type BnaFLC.A10 expression, which are compensated for by expression levels of various other paralogues.
Fig. 5.
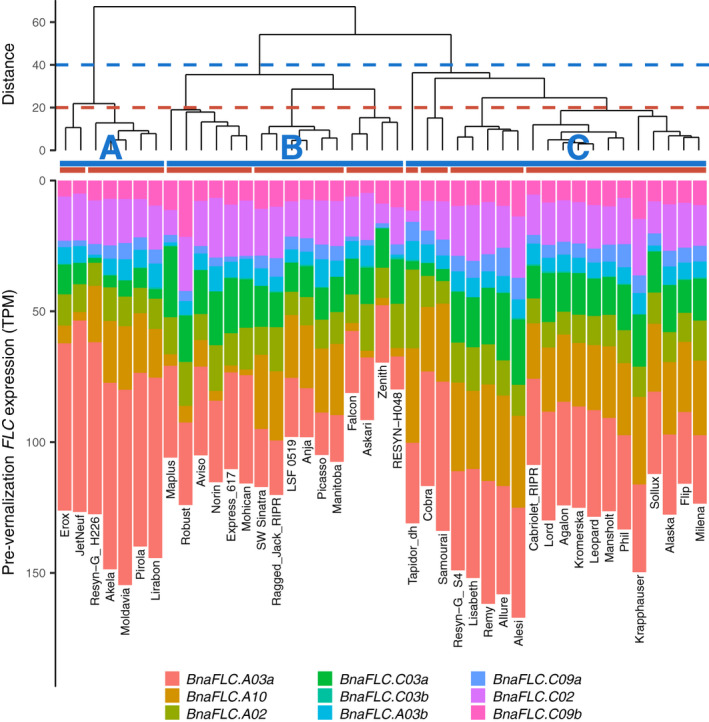
Different FLOWERING LOCUS C (FLC) composition strategies exist among Brassica napus winter crop type accessions. Pre‐vernalization FLC composition of winter crop type accessions, clustered by similarity in FLC paralogue expression. Dendrogram shows clustering by Euclidean distance between pre‐vernalization FLC expression in each accession. Horizontal bars show cluster membership if cut at height of 40 (blue), or 20 (red). Bar‐plot shows pre‐vernalization FLC expression, FLC paralogues are ordered by approximate cold stability from most stable (BnaFLC.C09b) to least (BnaFLC.A03a). There are three broad FLC compositions (A, B and C groups) within winter type accessions. The B group has low total expression, but proportionately more stable paralogue expression. The A and C groups have higher total FLC expression, the A group has high expression of the rapidly decaying BnaFLC.A03a copy. Within these groups, further subtypes exist (see e.g. red clusters). For example; the A group is further split by whether BnaFLC.A10 is expressed. Expression levels are given in TPM (transcripts per kilobase million).
These results confirm that high pre‐vernalization levels of total FLC expression do not imply a strong vernalization requirement, and importantly show that different combinations of paralogue expression are employed to achieve the same (winter) crop type. The FLC composition strategies seen among winter accessions suggest that paralogue response to cold, as well as pre‐vernalization expression level should be considered.
Total BnaFLC explains cold requirement in the RIPR diversity panel if differences in the response of FLC expression to cold are considered
Pre‐vernalization FLC expression is only weakly associated with length of cold requirement. To assess whether differences in the cold response of BnaFLC expression are sufficient to explain variation in cold requirement between crop types, we modelled the predicted level of BnaFLC expressed in the RIPR lines during vernalization treatment (Fig. 6). We used the experimentally measured pre‐vernalization BnaFLC expression levels as a starting level for each accession. The exponential decay rate parameter was set based on the values previously measured in the six accessions, under three different assumptions. It was either (1) set as the mean measured cold response value for all paralogues of BnaFLC, so assuming no differences in decay rate between paralogues or accessions (Fig. 6, left). Or (2) set to the mean value across accessions for each individual paralogue, meaning for example that BnaFLC.A03a decays relatively rapidly, and so assuming no differences between accessions (Fig. 6, middle). Or (3) set to the most extreme measured response for each paralogue among the six accession panels, so as to best separate spring and semi‐winter (rapid cold response) from winter and swede crop types (slow cold response), this allows for differences in decay rate between FLC paralogues, and between accessions (Fig. 6, right). In each panel, bold lines show the predicted values using the accession models fit to measured BnaFLC levels during vernalization as previously discussed (see Fig. 1a). Vertical dashes indicate when each accession crosses below the Westar‐derived total FLC threshold level and are predicted to be competent to flower.
Fig. 6.
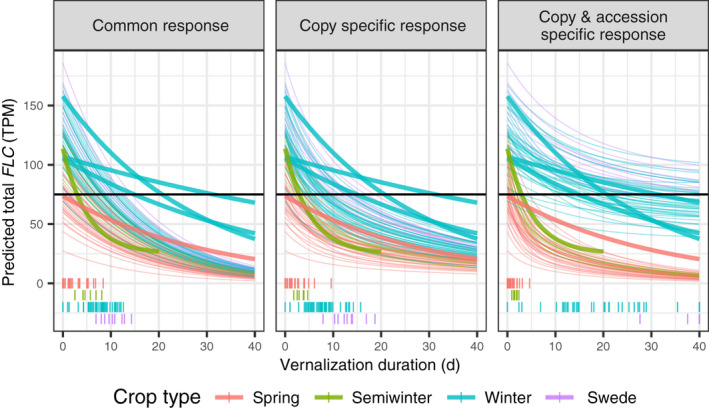
Difference in decay rate between Brassica napus accessions is required to achieve realistic vernalization predictions. The predicted FLOWERING LOCUS C (FLC) expression levels over vernalization for Renewable Industrial Products from Rapeseed (RIPR) panel accessions. A threshold FLC expression for floral competence is shown at 75 TPM (transcripts per kilobase million). Bold lines show modelled FLC expression over vernalization for our six‐accession panel, based on measured expression (also shown in Fig. 1a). The time at which each accession crosses the floral competence threshold is shown with vertical dashes. A threshold of 75 TPM is used as this is the measured pre‐vernalization expression level of Westar, which has no vernalization requirement, and is taken as an approximation of the required level to be able to flower upon cessation of cold treatment. Day 0 expression is taken from measured expression in the leaf at 21 d. Decay parameters are based on values measured in six accessions, under different assumptions; (left) common response; all decay rates are the same for all paralogues in all accessions, (middle) paralogue specific response; FLC paralogues have different cold response rates, which is set to the mean measured value or each paralogue, (right) paralogue and accession specific response; the same paralogue of FLC may have different decay rates in different accessions. The decay rate for each paralogue in each accession is set to the most extreme maximum‐likelihood value estimated for that FLC paralogue among the six‐accession panel, in order to maximize the difference between the low vernalization (spring and semi‐winter) and high vernalization (winter and swede) groups. Only by accounting for differences in cold response between paralogues and accessions is good separation of crop types and realistic vernalization requirements for winter crop types predicted (vertical dashes).
If differences in cold response between paralogues are not taken into account (Fig 6, left), then separation in predictions for required cold treatment between crop types is poor, reflecting the low association of pre‐vernalization total BnaFLC with crop type and its poor predictive power.
If different BnaFLC paralogues are allowed different decay rates (Fig 6, middle), the results are slightly better in terms of crop type separation, reflecting the fact that differences in pre‐vernalization BnaFLC composition between accessions contribute to differences in their cold requirement. However, this simple model predicts unrealistically short cold requirements in winter and swede varieties, which often require more than 12 wk vernalization (Schiessl et al., 2017).
To separate spring and winter crop types, and predict realistic cold period requirements for winter accessions, differences in the cold response of individual paralogues between accessions must be considered (Fig 6, right). Under this assumption, three winter types (Falcon, Resyn‐H048, Zenith) are predicted to require less cold than the most cold‐dependent spring type. This is also the only tested assumption under which measured expression in the winter accessions Express‐617 and Tapidor_JIC is not misrepresentative of the predicted BnaFLC expression for winter accessions in the RIPR panel.
More detailed predictions of the vernalization requirements for these accessions are not possible without further characterization of FLC response to cold in them. However, this approach successfully demonstrates that differences in cold response of BnaFLC expression within the range observed in a small panel of accessions are sufficient to largely explain crop type differences in this broader group.
Taken together, our data, analysis and modelling support the view that total BnaFLC expression dynamics rather than individual paralogues are the key factor determining vernalization requirements.
Discussion
The allotetraploid crop B. napus has nine copies of FLC, a key gene that determines a plant’s vernalization requirement and associates with adaptation to different agricultural environments by adjusting flowering time. Individual FLC paralogues have been linked to different B. napus crop types (Hou et al., 2012; Wu et al., 2012, 2019; Raman et al., 2013; Schiessl et al., 2019; Song et al., 2020; Yin et al., 2020); yet there are discrepancies between observed and expected FLC expression levels based on a crop type classification of accessions; and transferring seemingly specific crop type‐defining paralogues into a different crop type did not resulted in the expected changes (Yin et al., 2020).
Here, we investigated how multiple paralogues of the flowering gene FLC may function as a system to determine vernalization requirements in B. napus. In contrast to previous studies (Schiessl et al., 2019), which have largely focused on pre‐vernalization FLC expression, we demonstrate that when BnaFLC expression response to cold is additionally considered, total BnaFLC expression can explain cold requirement in B. napus better than individual ‘important’ paralogues. The importance of total BnaFLC suggests that all copies are relevant in determining vernalization requirement, including copies which are themselves cold‐unresponsive, Fig. 7.
Fig. 7.
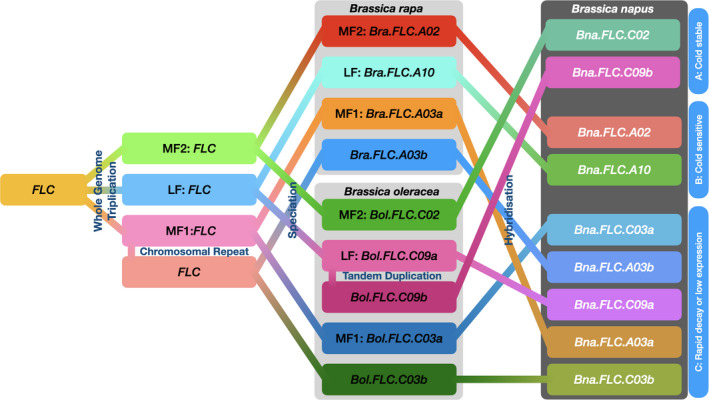
Evolutionary relationship between Brassica napus FLOWERING LOCUS C (FLC) paralogues and their cold response dynamics. Evolutionary path of FLC in Brassica napus following Schiessl et al. (2019), starting from a genome wide triplication in an ancestor with a single FLC copy (related to Arabidopsis). A subsequent gene duplication event (chromosomal repeat and inversion) is thought to predate the speciation into B. rapa, B. oleracea and B. nigra (B. nigra not shown here.) A further gene duplication (tandem duplication) event took place within the B. oleracea lineage. All nine FLC paralogues in B. napus (hybridization between B. rapa and B. oleracea) have been retained and have developed different cold response dynamics, possibly as a consequence of gene dosage balance acting on total FLC and drift compensation.
We suggest that differences between accessions in the response of total BnaFLC expression to vernalization are controlled both by varying the pre‐vernalization composition of expressed BnaFLC paralogues (with different cold responses), as well as through differences in the cold responses of BnaFLC orthologues between accessions. This parallels the case in Arabidopsis, in which variation between accessions in both pre‐vernalization expression and cold‐downregulations at the single AtFLC locus are important for the local adaptation of accessions (Lempe et al., 2005; Li et al., 2014; Duncan et al., 2015; Méndez‐Vigo et al., 2016; Bloomer & Dean, 2017; Whittaker & Dean, 2017). In B. napus, this variation is spread across multiple paralogues within a single species. How then does such wide variation in the expression dynamics of different paralogues arise? One example is provided by the drift compensation model (Thompson et al., 2016) which demonstrates how the expression of individual paralogues can move freely so long as other paralogues compensate for any introduced expression changes. One prediction of this model is that over time the expression level of some genes will reduce sufficiently that selection is relaxed, allowing the evolution of new function, new expression dynamics, or pseudogenization. Consistent with this model, BnaFLC paralogues with low levels of expression such as BnaFLC.C03b or novel dynamics, such as the highly cold responsive paralogue BnaFLC.A03a show evidence of relaxed selection.
It is also possible for variation to arise in the context of purifying selection. Of the paralogues that have ω < 0.5, those belonging to the C genome form one expression type (cold‐stable), while those belonging to the A genome form another (cold responsive). This is despite each A genome paralogue being more closely related phylogenetically to its direct C genome homoeologue (Fig. 3). This suggests that differential selection in the c. 2.5–4.5 Myr since divergence of the A and C genomes (Arias et al., 2014; Liu et al., 2014) but prior to the formation of B. napus may also have contributed to variation in expression dynamics. Thus, compensatory drift, relaxation of selection and differential selection all have the potential to generate diversity in expression dynamics which, when brought together in a single species provides a pool of variation that may be more rapidly evolvable than a single gene.
An example of how altered expression levels contribute to the rapid evolution of cold sensitivity within the context of BnaFLC can be seen in the Chinese semi‐winters (Fig. 4). Since the introduction of winter accessions to China in the 1940s, selective breeding for a milder cold requirement has apparently led to an increase in the relative pre‐vernalization expression of the highly cold responsive BnaFLC.A03a paralogues, and decrease in the expression of cold stable paralogues, resulting in a dramatically different expression of total BnaFLC over vernalization, and consequently a novel vernalization response phenotype, distinct from both spring and winter crop types.
Based on the hypothesis that total FLC is important, we might expect to find different ways of implementing the same total BnaFLC behaviour through different combinations of paralogue dynamics. Consistent with this idea, within the winter crop type, we observe a number of different strategies for managing total BnaFLC through variation in the pre‐vernalization BnaFLC composition of differently cold responsive paralogues. A consequence of this diversity of viable strategies is that association studies are more likely to be sensitive to the composition of the accessions studied, than for phenotypes where the strategy space is smaller. When paralogues can compensate for each other and produce the same phenotype, it is not clear whether a statistical association between a trait and a particular paralogue means that it is truly contributing more to producing a phenotype within an individual, or is instead associated with a more common strategy within the panel. Here, cold requirement provides a case study for the additional difficulties of gene association studies with polygenic traits.
Although we find that separation between the cold requirement of spring and winter crop types is much better after consideration of differences in the cold response of gene expression, the model is not perfect. For example, three winter accessions (out of 43) are not predicted to require more vernalization than the most cold‐requiring spring type. This is likely to be caused by a combination of several factors (1–4). (1) Although the ASSYST crop type labels (spring, semi‐winter, winter, swede) are a useful shorthand for vernalization phenotype, they are not perfect; there is variation in cold requirement with each crop type group, and the labels can be misleading. For example, the winter variety Mansholt has been reported to flower without vernalization, whereas the spring varieties Giant‐xr707 and Daichousen (fuku) do require vernalization (Schiessl et al., 2017). (2) The hard FLC expression threshold for floral competence considered here is an approximation and a simplification. The level used was based on the pre‐vernalization BnaFLC expression of the spring variety Westar, and thus was considered to provide a lower bound on the true threshold level. However, any ‘threshold level’ is also likely to vary between accessions, partly as a consequence of the next point. (3) Variation at genes downstream, or independent of FLC expression in the vernalization pathways can also affect cold requirement. For example, the low vernalization requirement in Mansholt has been linked to sequence variation in the promoter of BnaFT.C02 (Schiessl et al., 2017). BnaFT.A02, BnaFT.C06a and BnaFT.C06b have also been associated with two major QTL clusters for flowering time (Wang et al., 2009; Tudor et al., 2020), and may modify the effects of FLC. (4) The range of decay parameters allowed for each FLC paralogue were derived from measurements of only six accessions, and it is likely that more extreme FLC paralogue responses to cold exist within the RIPR panel.
Differences in the cold sensitivity of expression between paralogues suggest that, as in Arabidopsis (Shindo et al, 2006; Li et al., 2014; Bloomer & Dean, 2017), cold sensitivity is at least partially a consequence of cis sequence differences at the BnaFLC loci. However, we also see common patterns across paralogues within accessions (for example many paralogues have relatively stable expression in Ragged Jack). This suggests that functionally important differences in responsiveness are also caused by trans factors, which regulate multiple BnaFLC loci during vernalization. Consistent with this, genes involved in chromatin modification at FLC have experienced selection during crop type improvement (Lu et al., 2019). More thoroughly studying the range of cold responses in a broad panel of accessions is therefore an important next step in order to understand this system.
In summary, our findings support the idea that total BnaFLC expression, rather than individual BnaFLC paralogues, determine vernalization requirement in B. napus. Central to this proposition is consideration of the dynamic cold response of BnaFLC expression, which we modelled using an exponential decay function. The proposed hypothesis provides a simple, mechanistically‐based explanation of an accession’s cold requirement, and thus is a useful framework from which to further study vernalization in this polyploid system. Given information on pre‐vernalization expression levels, the current model allows for simple predictions of the magnitude of vernalization requirement attributable to each FLC copy in a given accession. As more data regarding the quantitative response of paralogues to cold becomes available, we hope to be able to produce more refined predictions for the duration of vernalization necessitated by different FLC complements.
The importance of combined BnaFLC levels suggests that B. napus may have retained so many FLC paralogues, because (in the absence of significant feedback regulation) loss of a duplicate results in a quantitative difference in total BnaFLC expression level, which may be sufficient to lead to detrimental changes in phenotype. Notably, this is the case even for paralogues which are themselves unresponsive to vernalization. Such considerations are consistent with gene‐dosage selection (Conant et al., 2014) and drift compensation (Thompson et al., 2016) applied to expression dynamics, and suggest a means by which paralogue combinatorics could be exploited to potentiate phenotypic diversity in polyploids.
Author contributions
AC designed and performed the majority of the data analysis. AC, JH, RJM and AL wrote the manuscript with contributions from all co‐authors. AL performed the phylogenetic analysis and selection pressure calculations. JH, EHT, DMJ, SW, LB, FC, KW, CC, JAI and RW performed the experiments. RJM, RW, LO, JHD and JAI supervised the project.
Supporting information
Fig. S1 Ragged Jack is an extreme winter type relative to Tapidor_JIC and Express‐617.
Fig. S2 VIN3 is rapidly induced, meaning that epigenetic dependent and independent vernalization periods are not distinguishable under our experimental conditions.
Fig. S3 FLC gene sequences are sufficiently different that RNA sequencing can distinguish them.
Fig. S4 FLC gene sequences for publicly available 100 bp single‐end RNA reads are sufficiently different that RNA sequencing can distinguish them.
Table S1 Only minor divergence from the reference sequence is observed in the FLC coding sequence.
Please note: Wiley Blackwell are not responsible for the content or functionality of any Supporting Information supplied by the authors. Any queries (other than missing material) should be directed to the New Phytologist Central Office.
Acknowledgements
The authors acknowledge financial support from Biotechnology and Biological Sciences Research Council grants; Brassica rapeseed and vegetable optimization strategic Lola (BB/P003095/1), ‘Genes in the environment’ (BB/P013511/1), and ‘National Capability in Crop Phenotyping’ (BB/J004464/1). The authors declare no significant competing financial, professional, or personal interests which might influence the performance or presentation of this study.
Data availability
The data that support the findings will be available in SRA, BioProject ID PRJNA648031, following an embargo from the date of publication to allow for commercialization of research findings.
References
- Abuyusuf M, Nath UK, Kim HT, Islam MR, Park JI, Nou IS. 2019. Molecular markers based on sequence variation in BoFLC1.C9 for characterizing early‐ and late‐flowering cabbage genotypes. BMC Genetics 20: 42. [DOI] [PMC free article] [PubMed] [Google Scholar]
- Angel A, Song J, Dean C, Howard M. 2011. A Polycomb‐based switch underlying quantitative epigenetic memory. Nature 476: 105–109. [DOI] [PubMed] [Google Scholar]
- Arias T, Beilstein MA, Tang M, McKain MR, Pires JC. 2014. Diversification times among Brassica (Brassicaceae) crops suggest hybrid formation after 20 million years of divergence. American Journal of Botany 101: 86–91. [DOI] [PubMed] [Google Scholar]
- Birchler JA, Veitia RA. 2010. The gene balance hypothesis: implications for gene regulation, quantitative traits and evolution. New Phytologist 186: 54–62. [DOI] [PMC free article] [PubMed] [Google Scholar]
- Birchler JA, Veitia RA. 2012. Gene balance hypothesis: connecting issues of dosage sensitivity across biological disciplines. Proceedings of the National Academy of Sciences, USA 109: 14746–14753. [DOI] [PMC free article] [PubMed] [Google Scholar]
- Bloomer RH, Dean C. 2017. Fine‐tuning timing: natural variation informs the mechanistic basis of the switch to flowering in Arabidopsis thaliana . Journal of Experimental Botany 68: 5439–5452. [DOI] [PubMed] [Google Scholar]
- Cai G, Yang Q, Yi B, Fan C, Edwards D, Batley J, Zhou Y. 2014. A complex recombination pattern in the genome of allotetraploid Brassica napus as revealed by a high‐density genetic map. PLoS ONE 9: e109910. [DOI] [PMC free article] [PubMed] [Google Scholar]
- Canola Council of Canada . 2013. Canola Encyclopedia: time‐of‐seeding . [WWW document] URL https://www.canolacouncil.org/canola‐encyclopedia/plant‐establishment/time‐of‐seeding/.
- Chalhoub B, Denoeud F, Liu S, P Parkin IA, Tang H, Wang X, Chiquet J, Belcram H, Tong C, Samans B et al. 2014. Early allopolyploid evolution in the post‐Neolithic Brassica napus oilseed genome. Science 345: 950–953. [DOI] [PubMed] [Google Scholar]
- Cheng F, Wu J, Cai X, Liang J, Freeling M, Wang X. 2018. Gene retention, fractionation and subgenome differences in polyploid plants. Nature Plants 4: 258–268. [DOI] [PubMed] [Google Scholar]
- Chouard P. 1960. Vernalization and its relations to dormancy. Annual Review of Plant Physiology 11: 191–238. [Google Scholar]
- Conant GC, Birchler JA, Pires JC. 2014. Dosage, duplication, and diploidization: clarifying the interplay of multiple models for duplicate gene evolution over time. Current Opinion in Plant Biology 19: 91–98. [DOI] [PubMed] [Google Scholar]
- Conant GC, Wolfe KH. 2008. Turning a hobby into a job: how duplicated genes find new functions. Nature Reviews Genetics 9: 938–950. [DOI] [PubMed] [Google Scholar]
- Costa S, Dean C. 2019. Storing memories: the distinct phases of Polycomb‐mediated silencing of Arabidopsis FLC. Biochemical Society Transactions 47: 1187–1196. [DOI] [PubMed] [Google Scholar]
- De Lucia F, Crevillen P, Jones AME, Greb T, Dean C. 2008. A PHD‐polycomb repressive complex 2 triggers the epigenetic silencing of FLC during vernalization. Proceedings of the National Academy of Sciences, USA 105: 16831–16836. [DOI] [PMC free article] [PubMed] [Google Scholar]
- Dekel E, Alon U. 2005. Optimality and evolutionary tuning of the expression level of a protein. Nature 436: 588–592. [DOI] [PubMed] [Google Scholar]
- Duncan S, Holm S, Questa J, Irwin J, Grant A, Dean C. 2015. Seasonal shift in timing of vernalization as an adaptation to extreme winter. eLife 4: e06620. [DOI] [PMC free article] [PubMed] [Google Scholar]
- Frampton M, Houlston R. 2012. Generation of artificial FASTQ files to evaluate the performance of next‐generation sequencing pipelines (JH Badger, Ed.). PLoS One 7: e49110. [DOI] [PMC free article] [PubMed] [Google Scholar]
- Havlickova L, He Z, Wang L, Langer S, Harper AL, Kaur H, Broadley MR, Gegas V, Bancroft I. 2018. Validation of an updated associative transcriptomics platform for the polyploid crop species Brassica napus by dissection of the genetic architecture of erucic acid and tocopherol isoform variation in seeds. The Plant Journal. 93: 181–192. [DOI] [PMC free article] [PubMed] [Google Scholar]
- He Y, Chen T, Zeng X. 2020. Genetic and epigenetic understanding of the seasonal timing of flowering. Plant Communications 1: 1–13. [DOI] [PMC free article] [PubMed] [Google Scholar]
- Hepworth J, Antoniou‐Kourounioti RL, Berggren K, Selga C, Tudor EH, Yates B, Cox D, Collier Harris BR, Irwin JA, Howard M et al. 2020. Natural variation in autumn expression is the major adaptive determinant distinguishing Arabidopsis FLC haplotypes. eLife 9: e57671. [DOI] [PMC free article] [PubMed] [Google Scholar]
- Hepworth J, Antoniou‐Kourounioti RL, Bloomer RH, Selga C, Berggren K, Cox D, Collier Harris BR, Irwin JA, Holm S, Säll T et al. 2018. Absence of warmth permits epigenetic memory of winter in Arabidopsis. Nature Communications 9: 639. [DOI] [PMC free article] [PubMed] [Google Scholar]
- Hou J, Long Y, Raman H, Zou X, Wang J, Dai S, Xiao Q, Li C, Fan L, Liu B et al. 2012. A tourist‐like MITE insertion in the upstream region of the BnFLC.A10 gene is associated with vernalization requirement in rapeseed (Brassica napus L.). BMC Plant Biology 12: 238. [DOI] [PMC free article] [PubMed] [Google Scholar]
- Hua S, Shamsi IH, Guo Y, Pak H, Chen M, Shi C, Meng H, Jiang L. 2009. Sequence, expression divergence, and complementation of homologous ALCATRAZ loci in Brassica napus . Planta 230: 493–503. [DOI] [PubMed] [Google Scholar]
- Irwin JA, Soumpourou E, Lister C, Ligthart J‐D, Kennedy S, Dean C. 2016. Nucleotide polymorphism affecting FLC expression underpins heading date variation in horticultural brassicas. The Plant Journal 87: 597–605. [DOI] [PMC free article] [PubMed] [Google Scholar]
- Johanson U, West J, Lister C, Michaels S, Amasino R, Dean C. 2000. Molecular analysis of FRIGIDA, a major determinant of natural variation in Arabidopsis flowering time. Science 290: 344–347. [DOI] [PubMed] [Google Scholar]
- Jones DM, Wells R, Pullen N, Trick M, Irwin JA, Morris RJ. 2018. Spatio‐temporal expression dynamics differ between homologues of flowering time genes in the allopolyploid Brassica napus . The Plant Journal 96: 103–118. [DOI] [PMC free article] [PubMed] [Google Scholar]
- Kim D, Langmead B, Salzberg SL. 2015. HISAT: a fast spliced aligner with low memory requirements. Nature Methods 12: 357–360. [DOI] [PMC free article] [PubMed] [Google Scholar]
- Kim SY, Park BS, Kwon SJ, Kim J, Lim MH, Park YD, Kim DY, Suh SC, Jin YM, Ahn JH et al. 2007. Delayed flowering time in Arabidopsis and Brassica rapa by the overexpression of FLOWERING LOCUS C (FLC) homologs isolated from Chinese cabbage (Brassica rapa L. ssp. pekinensis). Plant Cell Reports 26: 327–336. [DOI] [PubMed] [Google Scholar]
- Lee H, Suh SS, Park E, Cho E, Ahn JH, Kim SG, Lee JS, Kwon YM, Lee I. 2000. The AGAMOUS‐lIKE 20 MADS domain protein integrates floral inductive pathways in Arabidopsis. Genes and Development 14: 2366–2376. [DOI] [PMC free article] [PubMed] [Google Scholar]
- Leijten W, Koes R, Roobeek I, Frugis G, Leijten W, Koes R, Roobeek I, Frugis G. 2018. Translating flowering time from Arabidopsis thaliana to Brassicaceae and Asteraceae crop species. Plants 7: 111. [DOI] [PMC free article] [PubMed] [Google Scholar]
- Lempe J, Balasubramanian S, Sureshkumar S, Singh A, Schmid M, Weigel D. 2005. Diversity of flowering responses in wild Arabidopsis thaliana strains. PLoS Genetics 1: e6. [DOI] [PMC free article] [PubMed] [Google Scholar]
- Li P, Filiault D, Box MS, Kerdaffrec E, van Oosterhout C, Wilczek AM, Schmitt J, McMullan M, Bergelson J, Nordborg M et al. 2014. Multiple FLC haplotypes defined by independent cisregulatory variation underpin life history diversity in Arabidopsis thaliana. Genes and Development 28: 1635–1640. [DOI] [PMC free article] [PubMed] [Google Scholar]
- Lin SI, Wang JG, Poon SY, Su CL, Wang SS, Chiou TJ. 2005. Differential regulation of FLOWERING LOCUS C expression by vernalization in cabbage and arabidopsis. Plant Physiology 137: 1037–1048. [DOI] [PMC free article] [PubMed] [Google Scholar]
- Liu S, Liu Y, Yang X, Tong C, Edwards D, Parkin IAP, Zhao M, Ma J, Yu J, Huang S et al. 2014. The Brassica oleracea genome reveals the asymmetrical evolution of polyploid genomes. Nature Communications 5: 3930. [DOI] [PMC free article] [PubMed] [Google Scholar]
- Lu K, Wei L, Li X, Wang Y, Wu J, Liu M, Zhang C, Chen Z, Xiao Z, Jian H et al. 2019. Whole‐genome resequencing reveals Brassica napus origin and genetic loci involved in its improvement. Nature Communications 10: 1154. [DOI] [PMC free article] [PubMed] [Google Scholar]
- Maere S, De Bodt S, Raes J, Casneuf T, Van Montagu M, Kuiper M, Van De Peer Y. 2005. Modeling gene and genome duplications in eukaryotes. Proceedings of the National Academy of Sciences, USA 102: 5454–5459. [DOI] [PMC free article] [PubMed] [Google Scholar]
- Marjanović‐Jeromela A, Marinković R, Mijić A, Jankulovska M, Zdunić Z. 2007. Interrelationship between oil yield and other quantitative traits in rapeseed (Brassica napus L.). Journal of Central European Agriculture 8: 165–170. [Google Scholar]
- Meier U, Bleiholder H, Buhr L, Feller C, Hack H, Heß M, Lancashire P, Schnock U, Stauß R, Van Den Boom T et al. 2009. The BBCH system to coding the phenological growth stages of plants–history and publications. Journal für Kulturpflanzen 61: 41–52. [Google Scholar]
- Méndez‐Vigo B, Savic M, Ausín I, Ramiro M, Martín B, Picó FX, Alonso‐Blanco C. 2016. Environmental and genetic interactions reveal FLOWERING LOCUS C as a modulator of the natural variation for the plasticity of flowering in Arabidopsis. Plant, Cell & Environment 39: 282–294. [DOI] [PubMed] [Google Scholar]
- Michaels SD, Amasino RM. 1999. FLOWERING LOCUS C encodes a novel MADS domain protein that acts as a repressor of flowering. The Plant Cell 11: 949–956. [DOI] [PMC free article] [PubMed] [Google Scholar]
- Michaels SD, Himelblau E, Sang YK, Schomburg FM, Amasino RM. 2005. Integration of flowering signals in Winter‐annual Arabidopsis. Plant Physiology 137: 149–156. [DOI] [PMC free article] [PubMed] [Google Scholar]
- Pertea M, Pertea GM, Antonescu CM, Chang T‐C, Mendell JT, Salzberg SL. 2015. StringTie enables improved reconstruction of a transcriptome from RNA‐seq reads. Nature Biotechnology 33: 290–295. [DOI] [PMC free article] [PubMed] [Google Scholar]
- Pires JC, Zhao J, Schranz ME, Leon EJ, Quijada PA, Lukens LN, Osborn TC. 2004. Flowering time divergence and genomic rearrangements in resynthesized Brassica polyploids (Brassicaceae). Biological Journal of the Linnean Society 82: 675–688. [Google Scholar]
- Raman H, Raman R, Eckermann P, Coombes N, Manoli S, Zou X, Edwards D, Meng J, Prangnell R, Stiller J et al. 2013. Genetic and physical mapping of flowering time loci in canola (Brassica napus L.). Theoretical and Applied Genetics 126: 119–132. [DOI] [PubMed] [Google Scholar]
- Razi H, Howell EC, Newbury HJ, Kearsey MJ. 2008. Does sequence polymorphism of FLC paralogues underlie flowering time QTL in Brassica oleracea? Theoretical and Applied Genetics 116: 179–192. [DOI] [PubMed] [Google Scholar]
- Revell LJ. 2012. phytools: an R package for phylogenetic comparative biology (and other things). Methods in Ecology and Evolution 3: 217–223. [Google Scholar]
- Schiessl S, Huettel B, Kuehn D, Reinhardt R, Snowdon R. 2017. Post‐polyploidisation morphotype diversification associates with gene copy number variation. Scientific Reports 7: 41845. [DOI] [PMC free article] [PubMed] [Google Scholar]
- Schiessl SV, Quezada‐Martinez D, Tebartz E, Snowdon RJ, Qian L. 2019. The vernalisation regulator FLOWERING LOCUS C is differentially expressed in biennial and annual Brassica napus . Scientific Reports 9: 14911. [DOI] [PMC free article] [PubMed] [Google Scholar]
- Schranz ME, Quijada P, Sung SB, Lukens L, Amasino R, Osborn TC. 2002. Characterization and effects of the replicated flowering time gene FLC in Brassica rapa . Genetics 162: 1457–1468. [DOI] [PMC free article] [PubMed] [Google Scholar]
- Searle I, He Y, Turck F, Vincent C, Fornara F, Kröber S, Amasino RA, Coupland G. 2006. The transcription factor FLC confers a flowering response to vernalization by repressing meristem competence and systemic signaling in Arabidopsis. Genes & Development 20: 898–912. [DOI] [PMC free article] [PubMed] [Google Scholar]
- Sheldon CC. 2000. The molecular basis of vernalization: the central role of FLOWERING LOCUS C (FLC). Proceedings of the National Academy of Sciences, USA 97: 3753–3758. [DOI] [PMC free article] [PubMed] [Google Scholar]
- Shindo C, Aranzana MJ, Lister C, Baxter C, Nicholls C, Nordborg M, Dean C. 2005. Role of FRIGIDA and FLOWERING LOCUS C in determining variation in flowering time of Arabidopsis. Plant Physiology 138: 1163–1173. [DOI] [PMC free article] [PubMed] [Google Scholar]
- Shindo C, Lister C, Crevillen P, Nordborg M, Dean C. 2006. Variation in the epigenetic silencing of FLC contributes to natural variation in Arabidopsis vernalization response. Genes and Development 20: 3079–3083. [DOI] [PMC free article] [PubMed] [Google Scholar]
- Song JM, Guan Z, Hu J, Guo C, Yang Z, Wang S, Liu D, Wang B, Lu S, Zhou R et al. 2020. Eight high‐quality genomes reveal pan‐genome architecture and ecotype differentiation of Brassica napus . Nature Plants 6: 34–45. [DOI] [PMC free article] [PubMed] [Google Scholar]
- Song J, Irwin J, Dean C. 2013. Remembering the prolonged cold of winter. Current Biology 23: R807–R811. [DOI] [PubMed] [Google Scholar]
- Stansell Z, Farnham M, Björkman T. 2019. Complex horticultural quality traits in broccoli are illuminated by evaluation of the immortal BolTBDH mapping population. Frontiers in Plant Science 10: 1104. [DOI] [PMC free article] [PubMed] [Google Scholar]
- Sung S, Amasino RM. 2004. Vernalization in Arabidopsis thaliana is mediated the PHD finger protein VIN3. Nature 427: 159–164. [DOI] [PubMed] [Google Scholar]
- Suyama M, Torrents D, Bork P. 2006. PAL2NAL: robust conversion of protein sequence alignments into the corresponding codon alignments. Nucleic Acids Research 34: W609–W612. [DOI] [PMC free article] [PubMed] [Google Scholar]
- Tadege M, Sheldon CC, Helliwell CA, Stoutjesdijk P, Dennis ES, Peacock WJ. 2001. Control of flowering time by FLC orthologues in Brassica napus . The Plant Journal 28: 545–553. [DOI] [PubMed] [Google Scholar]
- Takada S, Akter A, Itabashi E, Nishida N, Shea DJ, Miyaji N, Mehraj H, Osabe K, Shimizu M, Takasaki‐Yasuda T et al. 2019. The role of FRIGIDA and FLOWERING LOCUS C genes in flowering time of Brassica rapa leafy vegetables. Scientific Reports 9: 13843. [DOI] [PMC free article] [PubMed] [Google Scholar]
- Thompson A, Zakon HH, Kirkpatrick M. 2016. Compensatory drift and the evolutionary dynamics of dosage‐sensitive duplicate genes. Genetics 202: 765. [DOI] [PMC free article] [PubMed] [Google Scholar]
- Tudor EH, Jones DM, He Z, Bancroft I, Trick M, Wells R, Irwin JA, Dean C. 2020. QTL‐seq identifies BnaFT.A02 and BnaFLC.A02 as candidates for variation in vernalisation requirement and response in winter oilseed rape (Brassica napus). Plant Biotechnology Journal 18: 2466–2481. [DOI] [PMC free article] [PubMed] [Google Scholar]
- Wang J, Long Y, Wu B, Liu J, Jiang C, Shi L, Zhao J, King GJ, Meng J. 2009. The evolution of Brassica napus FLOWERING LOCUS T paralogues in the context of inverted chromosomal duplication blocks. BMC Evolutionary Biology 9: 271. [DOI] [PMC free article] [PubMed] [Google Scholar]
- Wertheim JO, Murrell B, Smith MD, Kosakovsky Pond SL, Scheffler K. 2014. RELAX: detecting relaxed selection in a phylogenetic framework. Molecular Biology and Evolution 32: 820–832. [DOI] [PMC free article] [PubMed] [Google Scholar]
- Whittaker C, Dean C. 2017. The FLC locus: a platform for discoveries in epigenetics and adaptation. Annual Review of Cell and Developmental Biology 33: 555–575. [DOI] [PubMed] [Google Scholar]
- Wood CC, Robertson M, Tanner G, Peacock WJ, Dennis ES, Helliwell CA. 2006. The Arabidopsis thaliana vernalization response requires a polycomb‐like protein complex that also includes VERNALIZATION INSENSITIVE 3. Proceedings of the National Academy of Sciences, USA 103: 14631–14636. [DOI] [PMC free article] [PubMed] [Google Scholar]
- Wu D, Liang Z, Yan T, Xu Y, Xuan L, Tang J, Zhou G, Lohwasser U, Hua S, Wang H et al. 2019. Whole‐genome resequencing of a worldwide collection of rapeseed accessions reveals the genetic basis of ecotype divergence. Molecular Plant 12: 30–43. [DOI] [PubMed] [Google Scholar]
- Wu J, Wei K, Cheng F, Li S, Wang Q, Zhao J, Bonnema G, Wang X. 2012. A naturally occurring InDel variation in BraA.FLC.b (BrFLC2) associated with flowering time variation in Brassica rapa . BMC Plant Biology 12: 1–9. [DOI] [PMC free article] [PubMed] [Google Scholar]
- Xu S, Chong K. 2018. Remembering winter through vernalisation. Nature Plants 4: 997–1009. [DOI] [PubMed] [Google Scholar]
- Yin S, Wan M, Guo C, Wang B, Li H, Li G, Tian Y, Ge X, King GJ, Liu K et al. 2020. Transposon insertions within alleles of BnaFLC.A10 and BnaFLC.A2 are associated with rapeseed (Brassica napus L.) seasonal crop‐type. Journal of Experimental Botany 71: 4729–4741. [DOI] [PubMed] [Google Scholar]
- Yu H, Jiao B, Lu L, Wang P, Chen S, Liang C, Liu W. 2018. NetMiner‐an ensemble pipeline for building genome‐wide and high‐quality gene co‐expression network using massive‐scale RNA‐seq samples. PLoS ONE 13: e0192613. [DOI] [PMC free article] [PubMed] [Google Scholar]
Associated Data
This section collects any data citations, data availability statements, or supplementary materials included in this article.
Supplementary Materials
Fig. S1 Ragged Jack is an extreme winter type relative to Tapidor_JIC and Express‐617.
Fig. S2 VIN3 is rapidly induced, meaning that epigenetic dependent and independent vernalization periods are not distinguishable under our experimental conditions.
Fig. S3 FLC gene sequences are sufficiently different that RNA sequencing can distinguish them.
Fig. S4 FLC gene sequences for publicly available 100 bp single‐end RNA reads are sufficiently different that RNA sequencing can distinguish them.
Table S1 Only minor divergence from the reference sequence is observed in the FLC coding sequence.
Please note: Wiley Blackwell are not responsible for the content or functionality of any Supporting Information supplied by the authors. Any queries (other than missing material) should be directed to the New Phytologist Central Office.
Data Availability Statement
The data that support the findings will be available in SRA, BioProject ID PRJNA648031, following an embargo from the date of publication to allow for commercialization of research findings.