Abstract
Introduction:
Two aspects of noise annoyance were addressed in the present laboratory study: (1) the disturbance produced by vehicle pass-by noise while engaging in a challenging non-auditory task, and (2) the evaluative response elicited by the same sounds while imagining to relax at home in the absence of a primary activity.
Methods and Material:
In Experiment 1, N = 29 participants were exposed to short (3-6 s) pass-by recordings presented at graded levels between 50 and 70 dB(A). Concurrent with each sound presentation, they performed a visual multiple-object tracking task, and subsequently rated the annoyance of the sounds on a VAS scale. In Experiment 2, N = 30 participants judged the sounds while imagining to relax, without such a cognitive task.
Results and Discussion:
Annoyance was reduced when participants were engaged in the cognitively demanding task, in Experiment 1. Furthermore, when occupied with the task, annoyance slightly, but significantly increased with task load. Across both experiments, the magnitude of simultaneously recorded skin conductance responses in the first 1-4 s after the onset of stimulation increased significantly with sound pressure level. Annoyance ratings tended to be elevated across all sound levels, though significantly only in Experiment 2, in participants classified as noise sensitive based on a 52-item questionnaire.
Conclusions:
The results suggest that noise annoyance depends on the primary activity the listener is engaged in. They demonstrate that phasic skin conductance responses may serve as an objective correlate of the degree of annoyance experienced. Finally, noise sensitivity is once more shown to augment annoyance ratings in an additive fashion.
Key Messages: Two laboratory experiments demonstrate that annoyance due to vehicle pass-by noise depends on both the kind of primary task those exposed are performing, and their individual noise sensitivity. Furthermore, skin conductance responses to the noises were shown to provide an objective measure of the degree of annoyance, primarily reflecting exposure level. Text
INTRODUCTION
In the ISO/TS standard 15666,[1] noise annoyance is defined as “one person’s individual adverse reaction to noise”. By analysing various definitions and cultural varieties of that notion, Guski et al. [2] conclude that it is a “multifaceted concept” having two major aspects: (1) immediate behavioural effects like disturbance and interference with intended activities, and (2) evaluative aspects like nuisance and unpleasantness. In most surveys of long-term, real-world noise annoyance, these two aspects − behavioural and evaluative − are necessarily confounded and often judged on a single rating scale such as the ICBEN scale recommended to assess noise-induced annoyance in socio-acoustical surveys. [1,3] The present laboratory study was designed to capture and at the same time distinguish both aspects of annoyance: The behavioural aspect of noise interfering with a focal task, and the evaluative aspect of judging the unpleasantness of sounds, the former operationalized by having participants perform a visual-attention task while being exposed to varying levels of noise (Experiment 1), and the latter by instructing listeners to focus on the sounds without any distraction (Experiment 2).
An issue related to the definition of annoyance is whether it can be meaningfully studied in the laboratory at all. Note that noise annoyance is typically studied ‘in the field’, i.e. in surveys querying a large number of participants on the inconveniences they experienced due to particular noise sources (e.g. aircraft noise) over a relatively long period of time, such as a year. By contrast, the validity of studying noise annoyance in the laboratory has been questioned on principled grounds.[4] The concern is that people − removed from their habitat − might tend to simply judge loudness, aesthetic preference, or some other salient perceptual feature of the sounds while disregarding the disruptive nature and affective component implied in the notion of annoyance.
Nevertheless, it is generally agreed upon that short-term effects of noise may be studied under laboratory conditions by having participants imagine a situation like relaxing at home and then judging noise samples played back as authentically as possible.[5,6,7,8] In the present study, in Experiment 1, we chose to have participants actually work on a primary task, not requiring a situation to be “imagined”, while being exposed to task-irrelevant and potentially annoying traffic noise. We further chose a task (multiple object tracking)[9,10] which can be varied in difficulty to produce different levels of cognitive load thereby manipulating the degree to which the noise might turn out to be “disturbing” with respect to that task.
Furthermore, in the course of studying noise effects in the laboratory, we also wanted to re-assess the value of an objective, psychophysiological indicator of annoyance. Previous studies had shown heart rate, finger-pulse amplitude, skin conductance, and respiration rate,[11,12,13] as well as blood pressure,[13,14] and the level of stress hormones[15,16] to be sensitive to either long-term or short-term exposure. Of these indicators, the measurement of the phasic skin conductance response (SCR) appeared to be both most practical and most promising given our paradigm of short-term exposure to noise samples varying in level. Note that the amplitude of the skin conductance response has been shown to be differentially sensitive to noise level in a few studies, though most of them used rather high levels of exposure[17,18] or long exposure durations.[13,19]
Finally, we wanted to investigate the role of our participants’ individual noise sensitivity in moderating their annoyance and skin conductance responses. Previous work has shown noise sensitivity to moderate both long-term[20,21] and short-term reactions[22,23,24] to noise exposure, typically − in the field studies cited − by additively boosting annoyance ratings rather than by showing interactions[25] depending on sound level. Thus, the point of the present study is (a) to determine whether noise sensitivity results in the same kind of parallel shift in annoyance-vs-level curves when it is based on short-term exposure in the laboratory, and (b) to investigate the effect of noise sensitivity on concurrently measured skin conductance reactions.
The study coming closest to the goals of the present one was published by Notbohm et al.[11]: It investigated annoyance produced by vehicle pass-by noises, measured psychophysiological reactions, and took the participants’ individual noise sensitivity into account. The study found significant effects of gender and age on the magnitude of the psychophysiological responses (finger pulse amplitude and/or skin-conductance level) to the noise. There are two important differences, however, when comparing the methodology used by Notbohm et al.[11] with ours: Their pass-by noises were equalized in A-weighted equivalent sound pressure level LAeq and presented in repeated loops over a 2-min period, consequently, the psychophysiological response was analyzed in terms of the (sustained) elevation in tonic skin-conductance level across the entire stimulation interval. By contrast, the present investigation was designed to study short-duration pass-by recordings (6 s), therefore inspecting the ‘phasic’ (transitory) skin conductance response. Furthermore, we emphasized a psychophysical perspective by looking at subjective and skin conductance responses as a function of varying sound-pressure level in graded steps.
The goal of the study was threefold: (1) to determine whether noise annoyance may be reliably judged as a ‘secondary task’ while the subject is occupied with some primary task of varying difficulty (Experiment 1) or without concurrent performance demands (Experiment 2), (2) to assess whether skin conductance responses (SCRs) to isolated noise events may serve as a valid indicator of annoyance and (3) to clarify the role of noise sensitivity in modulating both annoyance ratings and psychophysiological responses.
EXPERIMENT 1
Subjects and methods
Participants
A sample of N = 29 participants (18 men, 11 women, age range 18-61 years, MD = 22) was recruited from the TU Darmstadt student body and members of the laboratory. All participants claimed to have normal hearing, except for two who reported occasional tinnitus not affecting their hearing sensitivity. Undergraduate psychology students participated for course credit. Written informed consent was obtained from all subjects in accordance with the Declaration of Helsinki. In compliance with the policies at TU Darmstadt, where submission to the institutional ethics board is not obligatory for non-invasive studies of human participants, no specific ethics committee approval was sought for the present study, since the research did not pose any risks to medical health or psychological well-being, and did not involve deception, or other ethically relevant issues.
Stimuli
Three recordings of vehicle pass-by noises prepared for an earlier study[6] were used as stimuli. They had been recorded using stereo microphones in an ORTF arrangement and were between 3.7 and 6.4 s long. The recordings were of a motorcycle decelerating and breaking while passing by, and of two trucks, one accelerating, the other one decelerating and eventually idling near the recording site. Thus, the recordings were sufficiently rich in timbre and spectral change over time to be distinguishable and to potentially elicit different degrees of annoyance. Their A-weighted, energy-equivalent sound pressure levels recorded at a distance of 3 m when passing the microphones were approx. 70 dB(A) for the accelerating truck sound and 62 dB(A) for the remaining two sounds (averaged across the two stereo channels). In the present experiment, in order to vary sound pressure level, they were presented at the original levels and attenuated to six lower levels, in 2-dB(A) steps, thus resulting in ranges 50-62 (motorcycle, decelerating truck) and 58-70 dB(A) (accelerating truck).
Apparatus
The stereo recordings were presented via electrodynamic headphones (Beyerdynamic DT 990) without further processing. To that effect they were D/A converted (with 44.1 kHz, 32 bits) by a high-quality sound card (RME multiface II) and passed through a headphone amplifier (Behringer Pro 8). The playback at different levels was achieved by storing attenuated copies of the sounds. A-weighted sound pressure levels were verified using an artificial ear (Brüel & Kjær type 4153) fitted with a condenser microphone (Brüel & Kjær type 4192), and connected to a sound level meter (Brüel & Kjær type 2250). The experiment was conducted in a double-walled, sound-attenuated chamber (Industrial Acoustics Company).
During the listening test, skin conductance was continuously measured with a psychophysiological recording system (Biopac MP 150WS-NDT and GSR100C module with AcqKnowledge 3.9 data acquisition software) via two Ag/AgCl electrodes (diameter 8 mm) filled with isotonic gel (0.5% saline in a neutral base) attached to the palm of the participant’s non-dominant hand. Skin conductance was recorded at a sampling rate of 250 Hz.
In order to determine each participant’s individual noise sensitivity, a 52-item, German-language questionnaire (LEF)[26] that had been psychometrically evaluated and compared to other noise-sensitivity measures[27] was completed after the listening tests.
Procedure
On each trial, participants had to perform a visual-attention task while being exposed to one of the pass-by recordings. The task chosen was a ‘multiple object tracking’ (MOT)[10,28] task, as illustrated in Figure 1. At the outset of each trial, participants were presented with an array of 16 circles that were moving in random directions within a grey circular field occupying almost the entire screen. A subset of 2, 3, or 4 circles was presented in orange color (i.e., the target circles), while the remaining circles were presented in yellow (i.e., the distractor circles). The number of circles to be tracked thus defined three levels of task difficulty. Participants were instructed to track the orange target circles throughout the trial [see the left screen in Figure 1]. The target circles remained orange for 2 seconds, after which they changed color to yellow for 4 seconds [center screen in Figure 1]. The participants were instructed to continue tracking the circles that initially were orange, thus the total tracking time per trial was 6 seconds. At the end of each trial, a single circle in the display changed color to white (i.e., the probe circle). Participants were instructed to indicate whether this probe circle was one of the (originally orange) target circles by pressing either the left mouse button for “yes”, or the right mouse button for “no” [see the right screen in Figure 1]. The probe circle was originally a target circle on 50% of the trials, and a distractor circle on 50% of the trials. Participants received feedback on their performance (correct/false) immediately after they had made a response.
Figure 1.
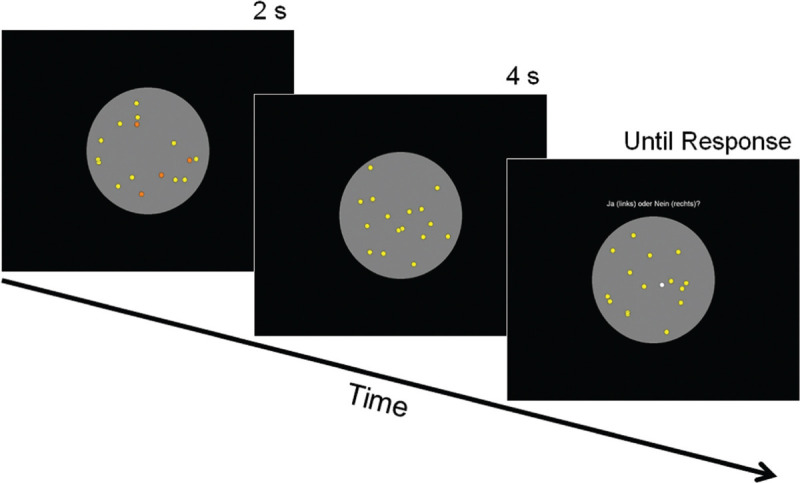
Multiple-object tracking task. Left screenshot: 2, 3, or (in this example) 4 of the randomly moving dots are marked (in orange color) to be tracked. Center screenshot: Color highlighting disappears and the dots (now all yellow) continue moving within the circular gray area. Right screenshot: One of the dots turns white and the participant is to decide whether it was one of those to be tracked (earlier marked in orange).
After a 1-s delay, a 22-cm horizontal visual-analogue scale (VAS) appeared on the screen prompting the participants to indicate how annoying they found the sound played during that trial. The scale was labelled “Gar nicht lästig” (not annoying at all) on its left and “Extrem lästig” (extremely annoying) on its right end.
Each type of trial (3 sounds x 7 levels x 3 task difficulties x 2 types of probes) was presented only once to each participant, in random sequence, thus resulting in a total of 126 trials. There were no practice trials. The entire procedure, including preparing the skin conductance recordings and filling out the noise sensitivity questionnaire took approximately 1h.
Results I: Annoyance with concurrent task load
Annoyance ratings
The VAS annoyance ratings (expressed as a proportion of the scale 0 − 1.0) were arithmetically averaged across subjects and appropriate conditions. Performance in the MOT visual-attention task was evaluated as the proportion of accurate responses. Two groups of high versus low noise sensitivity were formed by splitting the entire sample along the median (an LEF score of 74) resulting in a ‘low’ group (Nlow = 15) with a mean noise sensitivity (LEF) score of 53.33 and a ‘high’ group (Nhigh = 14) with a mean noise sensitivity score of 94.43.
Figure 2 (left graph) shows that accuracy in the multiple-object-tracking task is quite high (averaging between 70 and 90% correct) and drops as the task difficulty is increased from tracking 2 to 4 circles. That is evidence that subjects attended to the task, performed well above chance level, and were affected by the cognitive load it imposed. Noise sensitivity did not have a significant effect on performance in the MOT task.
Figure 2.
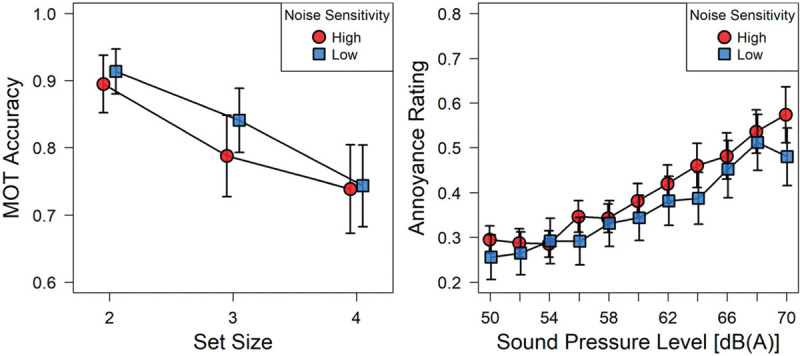
Left: Mean accuracy in the visual attention task as a function of set size (the number of objects to be tracked). Right: Mean annoyance ratings as a function of SPL. Both graphs show separate curves for the group of highly noise sensitive participants (Nhigh = 14) contrasted with those of low noise sensitivity (Nlow = 15). Error bars denote standard errors of the means.
Figure 2 (right graph) shows mean annoyance ratings as a function of A-weighted sound pressure level, contrasting participants of low self-reported noise sensitivity (open symbols) with those reporting high noise sensitivity (filled symbols). A 3 (difficulty) x 11 (sound level) x 2 (noise sensitivity groups) mixed-factors analysis of variance (ANOVA) in which task difficulty and sound level constituted within-subjects factors revealed a highly significant main effect of sound level on the annoyance ratings, F(10,270)=46.06; P<0.001; η2=0.19. Though it is evident in Figure 2 that the more noise-sensitive individuals tended to produce higher annoyance ratings throughout the range of levels studied, that effect was not statistically significant, F(1,27)=.39; P=0.53; neither was any of the interaction effects in the ANOVA thus specified.
The difficulty of the primary visual-attention (MOT) task, however, did have a small, but significant, effect [Figure 3] on annoyance ratings: The more demanding that task was on a given trial, the higher the reported annoyance. With two circles to track, mean annoyance was M=0.36, SD=0.18; with three circles to track it was M=0.38, SD=0.18, and at the most difficult level, with four circles, M=0.41, SD=0.19. This was reflected in a highly significant main effect of difficulty in a 3 (difficulty) x 11 (sound level) x 2 (noise sensitivity groups) mixed-factors ANOVA, F(2,54)=13.08; P<0.001; η2=.009 in which difficulty and sound level constituted within-subjects factors.
Figure 3.
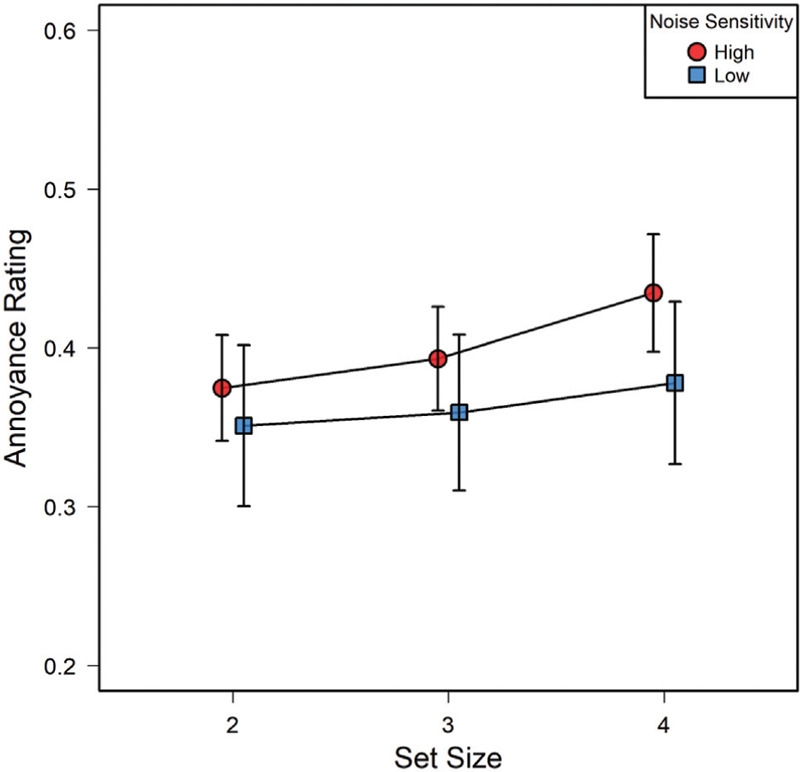
Mean annoyance ratings (0–1.0) as a function of set size (the number of objects to be tracked). Separate curves are shown for participants of high (Nhigh = 14) versus low noise sensitivity (Nlow = 15). Note that the standard errors of the means reflect the dispersion of responses to all sound pressure levels presented.
Skin conductance responses
To analyze the skin conductance recordings, they were first temporally aligned with the 6-s trial structure of the visual attention task performed under noise. To that effect, the change in skin conductance, expressed in µS and referenced to the conductivity level at the onset of the noise (and of the MOT task) was averaged across trials accompanied by the same sound pressure level and tracked for the 6 s of the MOT task and the subsequent response interval.
The result is seen in Figure 4 which shows the magnitude and duration of the phasic skin conductance response (SCR) to increase with the level of the sound presented; the effect is most marked for the four highest SPLs which are due to the accelerating truck sound played back at levels of up to 70 dB(A). In order to analyze these data statistically, the ‘first-interval response’ (FIR), i.e. the average skin conductance level in seconds 1-4 of the response to the sounds was determined (which is assumed to reflect an orienting response)[29]; for details see Koenig et al. (2017). Analyzing these data as a function of level, noise-sensitivity and concurrent task difficulty in a three-factor ANOVA revealed all but a significant main effect of sound pressure level, F(10,260)=3.24; P<0.001; η2=0.03. Later components of the SCR did not show any further significant effects due to sound level.
Figure 4.
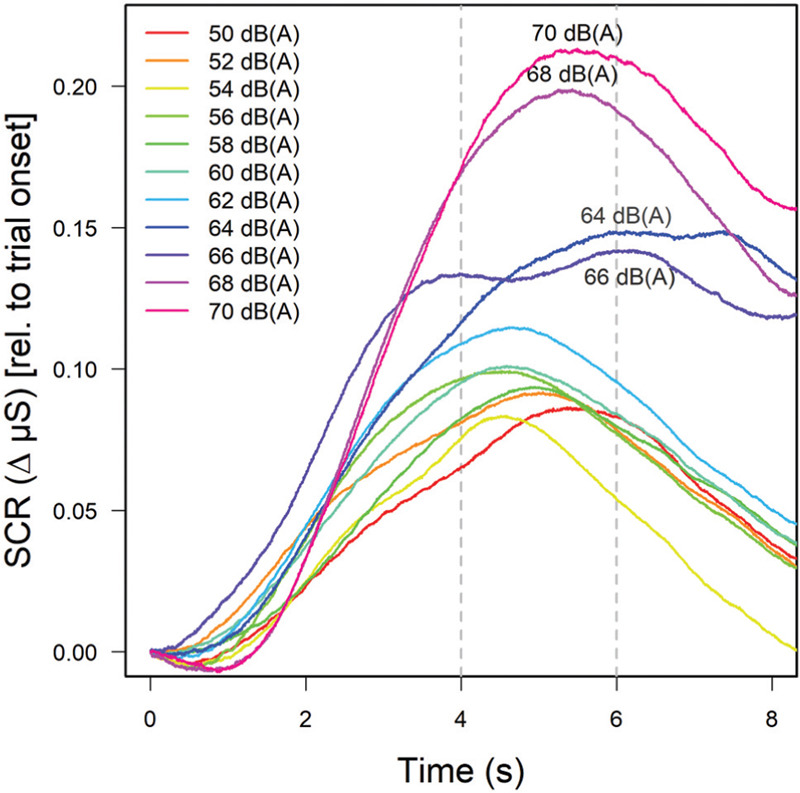
Mean skin conductance responses as a function of sound level (see figure legend). Curves are based on 18 trials per level and participant and averaged across 28 subjects for whom valid electrodermal data were obtained.
Discussion of Experiment 1
The results of Experiment 1 show that annoyance by short-duration traffic noise samples may be reliably judged (retrospectively) even when the listener is busy performing an absorbing concurrent task. The annoyance produced by the noise is significantly − though only to a small extent − influenced by the cognitive load imposed by that task, resulting in slightly higher ratings, whenever the task gets more difficult.
Furthermore, measuring event-related electrodermal responses appears to be a valid measure of perceived annoyance, exhibiting an unequivocal level dependence. Finally, noise sensitivity appears to play a role in augmenting both annoyance ratings and the magnitude of psychophysiological responses, but that effect failed to reach statistical significance in Experiment 1.
Nevertheless, since in Experiment 1, annoyance was judged while participants were actually occupied with an unrelated visual-attention task, there is a chance for annoyance ratings to be affected by the distraction. In the auditory literature, this kind of modulation of attention has sometimes been treated as “informational masking”,[30] even when it operates across sensory modalities.[31] Likewise, psychophysiological responses might not only reflect the affective annoyance response we sought to measure, but also a cognitive-load component due to the demands of the primary task, though that is somewhat unlikely, given that task difficulty had no significant effect on the skin conductance responses.
Therefore, in Experiment 2, we wanted to study annoyance in the absence of a demanding task, thereby focusing on the evaluative aspect of annoyance and excluding the interference/disruptive aspect operationalized in Experiment 1. In Experiment 2, the participant’s task was to simply overhear the sounds while trying to relax, a scenario typically used in laboratory-based annoyance research.[32] Thus we hoped to compare the noise annoyance elicited while working on a demanding task with annoyance while imagining to relax, and simultaneously attempt to replicate some of the effects observed in Experiment 1.
EXPERIMENT 2
Subjects and methods
Participants
A total of N = 30 volunteers (14 male, 15 female, 1 self-declared ‘other’; age range 18-61 years; MD = 25.5), the majority of them psychology students participating for course credit, were recruited for Experiment 2. All reported to have normal hearing. Informed consent was obtained in the same manner as in Experiment 1.
Stimuli and apparatus
Two additional recordings of motorcycles in acceleration from the same database were included in Experiment 2.[33] Despite their moderate SPL they had been rated as particularly annoying in earlier work.[7] They had durations of 6 and 4.5 s and were played back at seven levels from 50 to 62 dB(A) in 2-dB steps. These stimuli were judged in Block 2 of Experiment 2; while Block 1 used the same vehicle noises (3 sounds at levels between 50 and 70 dB(A)) already employed in Experiment 1.
The apparatus used for sound playback and calibration and skin-conductance recordings was the same as that employed in Experiment 1. In addition to the noise-sensitivity questionnaire, however, an additional questionnaire, the German version of the Adult Temperament Questionnaire (ATQ)[34,35] was administered at the end of the session. Of particular interest was a subscale of their extraversion scale termed ‘high-intensity pleasure’, which reflects a ‘sensation-seeking’ personality trait, and their scale of ‘discomfort’ measuring something close to noise sensitivity.
Procedure
In terms of laboratory setup, timing, and stimulus randomization the procedure largely paralleled that of Experiment 1 with the important exception that there was no (primary) visual-attention task to perform. Rather, the participants were asked to imagine relaxing in their living room at home, as in many laboratory studies of annoyance.[6,24,32,36] To bring that instruction to mind on each trial, the 6-s sound interval was filled with the on-screen presentation of a photograph of a furnished but unoccupied living room. Subsequently, participants were asked to judge how much that noise might annoy them in the situation imagined, using the same graphic rating scale as in Experiment 1.
In order to facilitate a direct comparison with Experiment 1, unbiased by potential context effects, the first block of the data collection session simply replicated the conditions of Experiment 1. Rather than six (necessitated by the MOT task in Experiment 1), however, only four repetitions of each sound/level combination were presented, thus resulting in (3 sounds x 7 levels x 4 repetitions) 84 trials. The second block of the session was devoted to the two newly added motorcycle sounds (2 sounds x 7 levels x 4 repetitions) and resulted in 56 trials. The entire session lasted approximately 1 h.
Results II: Noise annoyance judged while imagining to relax
Annoyance ratings
As for Experiment 1, the VAS annoyance ratings (scale of 0 − 1.0) were arithmetically averaged across subjects and appropriate conditions, but separately for the two blocks or stimulus sets. Figure 5 shows that the annoyance ratings are largely determined by the A-weighted sound pressure level; with the motorcycle sounds from block 2 (open symbols) slightly offset towards higher annoyance values. The fact that different decibel ranges were presented in blocks 1 and 2, is reflected in the different response ranges on the y-axis, with little evidence for a context effect whereby the VAS scale might simply be adapted to the given range of levels.
Figure 5.
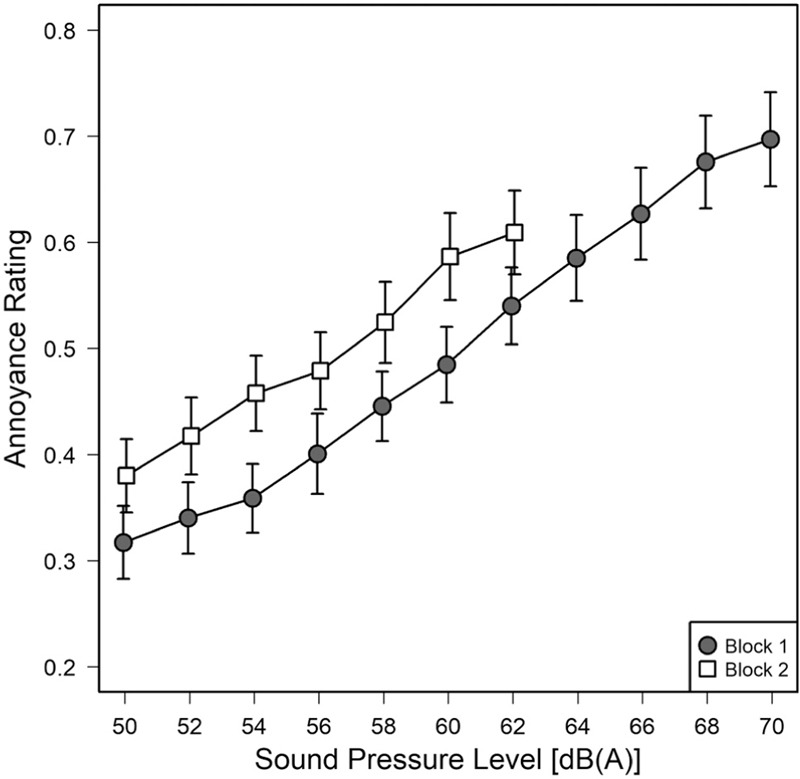
Mean annoyance ratings and standard errors as a function of SPL. Results from Block 1 (3 traffic noise samples, 50–70 dB(A), filled circles) are contrasted with those from Block 2 (2 motorcycle pass-by noises, 50-62 dB(A), open squares).
Separate two-factor ANOVAs with sound level constituting a within-subjects and noise-sensitivity group a between-subjects factor, showed significant main effects of level both for block 1, F(10,280)=44.96; P<0.001; η2=0.33, and for block 2, F(6,168)=40.86; P<0.001; η2=0.14, and no interaction with noise sensitivity.
When the participants of Experiment 2 were split into two noise-sensitivity groups along the median (an LEF score of 74.5) a ‘low’ noise sensitivity group (Nlow = 15) with a mean noise sensitivity (LEF) score of 61.1 and a ‘high’ noise sensitivity group (Nhigh = 15) with a mean noise sensitivity score of 92.4 emerged. Their SPL-vs-annoyance functions for block 1 are shown in [Figure 6], where for each of 11 pairs of data points, the mean annoyance expressed by the highly noise-sensitive group is above that of the group reporting low noise sensitivity. The statistical significance of that difference is confirmed by a main effect of noise sensitivity in the ANOVA, F(1,28)=4.34; P=0.046; η2=0.10. By contrast, in block 2, in which a lower range of SPLs was presented, the effect of noise sensitivity on annoyance ratings was not statistically significant, F(1,28)=0.23; P=0.63.
Figure 6.
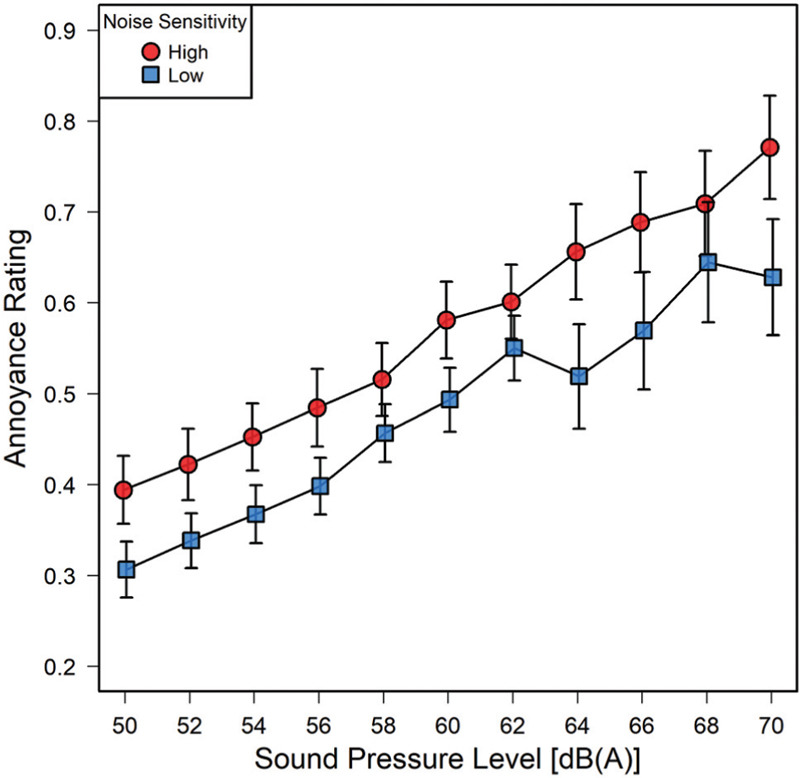
Mean annoyance ratings by noise sensitivity. Red circles denote means of highly noise sensitive participants (Nhigh = 15); blue squares those of participants reporting low noise sensitivity (Nlow = 15). Error bars denote standard errors of the means.
Skin conductance responses
Phasic skin conductance responses were analyzed in the same way as in Experiment 1. The resulting average level-dependent curves are plotted in Figure 7. As in Experiment 1, an increase and subsequent decay in skin conductance during the 6-s auditory stimulation interval was observed. It appears less pronounced than in Experiment 1, and largely due to the highest sound-pressure levels employed [see the labeled curves in Figure 7]. A two-factor ANOVA of the first-interval response (FIR, 1-4 s) with Noise Sensitivity constituting the second, between-subjects factor confirmed a statistically significant main effect of sound level, F(10,260)=2.22; P=.017; η2=.04, on SCRs. For the lower-level sounds in Block 2, the effect of level on SCRs failed to reach statistical significance, F(6,156)=1.58; P=.16. In neither case did (high vs. low) noise sensitivity produce significantly different SCR patterns or interactions with sound level.
Figure 7.
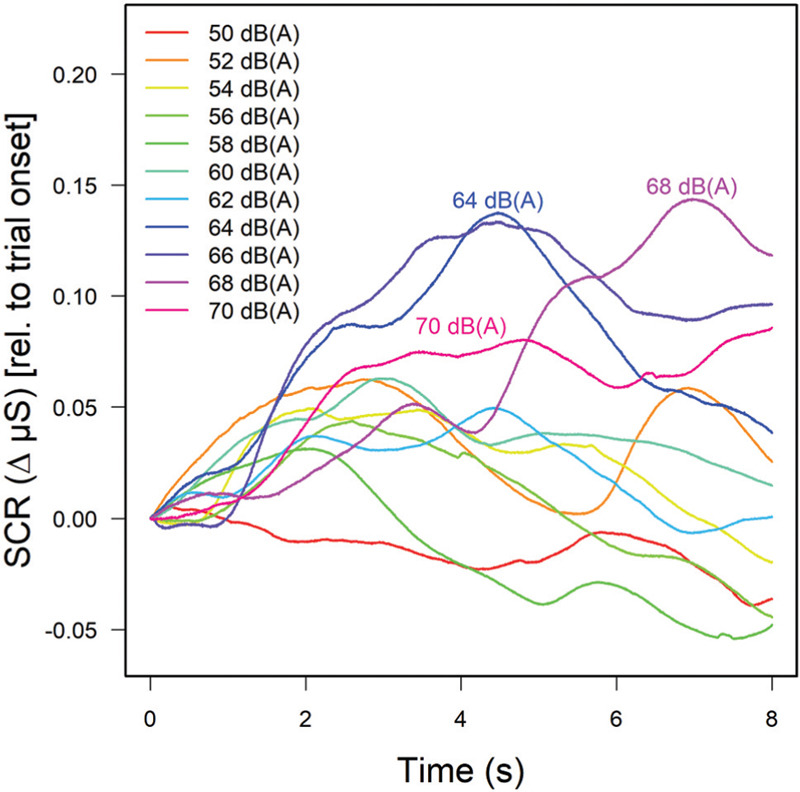
Mean skin conductance responses as a function of sound level (see legend). Curves of higher SPLs are labelled. The traces are based on 12 trials per level and participant and averaged across the three sounds and 28 subjects for whom valid electrodermal data were obtained.
Discussion of Experiment 2
In Experiment 2, noise annoyance was studied while participants were instructed to relax rather than performing a demanding cognitive task. Nevertheless, with a new sample of listeners and an extended stimulus set, most of the effects observed in Experiment 1 were confirmed or extended. Most importantly, the magnitudes of noise-related skin conductance responses were again found to be significantly related to sound level, though only for the sound set containing higher levels [Block 1, Figure 7] up to 70 dB(A). Furthermore, the effect of self-reported noise sensitivity as determined by a multi-item questionnaire was shown to significantly affect annoyance ratings, boosting them by some 10 percent, irrespective of sound level [see Figure 6], an effect that had been observed in the mean annoyance functions [Figure 2] of Experiment 1, but that had failed to reach statistical significance there.
These conclusions are somewhat weakened by the fact that both effects (of noise sensitivity, and of sound level on psychophysiological responses) were not confirmed with the newly introduced stimuli in Block 2 of Experiment 2. The most likely explanation is that the relatively low levels at which the motorcycle pass-by noises were played back prevented them from triggering electrodermal responses or from eliciting the kind of additional annoyance due to high individual noise sensitivity.
Consequently, the main point of having presented that extra stimulus set (Block 2) may have been to show that our (VAS) judgment scale is relatively robust to a familiar context effect, the ‘rubber-scale’ phenomenon that participants tend to adapt their response range to whatever stimulus range is presented.[37] Rather, the lower-level sounds of Block 2 [50-62 dB(A)] were not simply mapped into the same response range as the sounds of Block 1 [50-70 dB(A)], thereby demonstrating that some absolute-level information is carried over from Block 1 to Block 2,[38] even though the response scale was only weakly anchored by verbal labels. Whether that might have worked for the opposite order as well, i.e. extending rather than shrinking the stimulus range between blocks, remains an open issue. The fact that the two curves in Figure 5 do not simply coincide may be due to the fact that the newly introduced motorcycle pass-bys (Block 2) were perceived more annoying due to factors other than sound level, as had been indicated by an earlier study employing the same sounds (labelled ‘dao2’ and ‘dao3’ in their Fig. 1).[7]
GENERAL DISCUSSION
In two laboratory experiments using short-duration vehicle pass-by recordings presented at various levels, a total of 59 participants judged noise annoyance either while performing a demanding visual-attention task (Experiment 1), or without such distraction (Experiment 2), while imagining to relax. First, the results of both experiments will be analysed with respect to that distinction, i.e. the purely perceptual/evaluative vs. the behavioural/disruption-related aspect of noise annoyance. Secondly, the value of the phasic skin conductance response as an indicator of annoyance shall be evaluated. Thirdly, the role of personality characteristics, i.e. noise sensitivity and temperament, in affecting both annoyance judgments and psychophysiological reactions shall be discussed.
Noise annoyance with or without a focal task
When contrasting annoyance ratings made in Experiment 1 (where the sounds where played back while participants performed a demanding primary task) with those obtained in response to identical stimuli, but without such a task in Experiment 2 (Block 1), it is evident that the ratings in the former situation are lower and cover a restricted response range [see Figure 8]. That is mirrored in a significant main effect of task (versus no task), F(1,57)=7.52; P=0.008; η2=0.09, and a significant task x sound level interaction, F(10,570)=3.65; P<0.001; η2=0.01, in a two-factor mixed ANOVA. There are several potential explanations for this phenomenon, from random differences between the two samples of listeners, over a lack of attention to the sounds due to concentration on the primary task (producing “regression towards the mean” via unconfident or cautious judgments) to more substantial accounts. Research in memory psychophysics,[39,40] for example, suggests that (retrospective) judgments of remembered sensory intensities result in shallower psychophysical functions than judgments based on actual perception − which is somewhat plausible for our procedure given that in the task condition subjects might have been too busy to make an annoyance judgment while occupied with visual object tracking, whereas in the no-task condition they could well have formed an impression of annoyance while the sounds were still being played back. But it is equally conceivable that annoyance judgments under a relaxation instruction are boosted, because the annoyance potential is judged higher given that context.[6,41] Interestingly, a recent laboratory study (Experiment 1 of Zimmer et al.)[42] suggests that task-related effects on annoyance depend on whether the sounds interfere with performance or not: Sounds that significantly disrupted task performance tended to be more annoying when judged while performing the task compared to before or after, whereas for innocuous sounds, like the ones used in the present study, the reverse was true: Greater annoyance was observed when these sounds were fully attended to compared to when they were judged in the middle of performing a short-term memory task (see their Fig. 2).[42] The alternative, i.e., that mental stress attenuates the annoyance produced by background sound appears less likely, given that in Experiment 1, noise annoyance slightly increased as the focal visual-attention task became more difficult [see Figure 3], thus suggesting the opposite.
Figure 8.
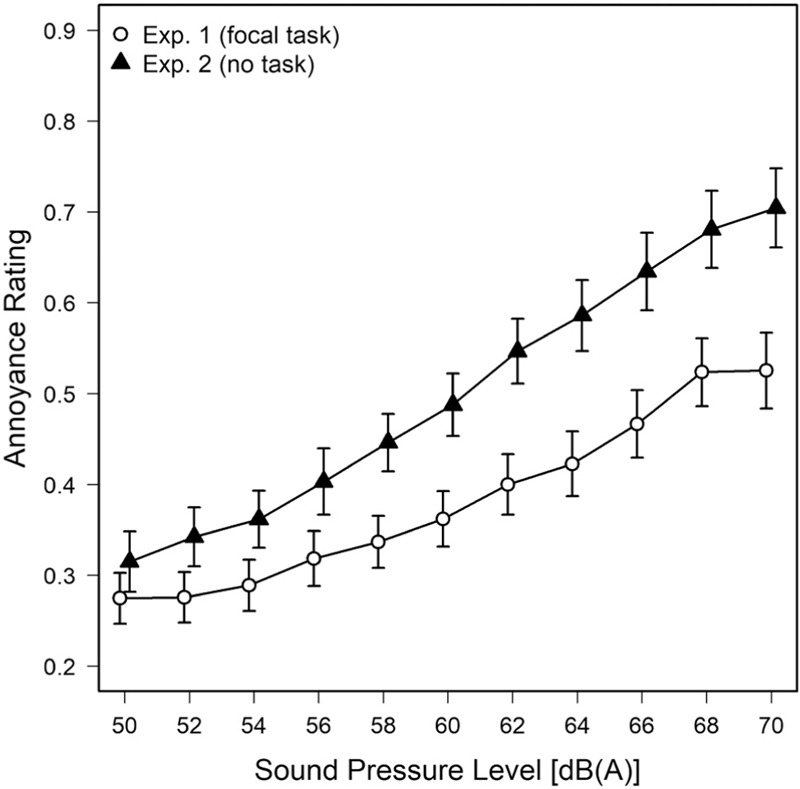
Mean noise annoyance (± one standard error of the mean) as a function of SPL. open circles denote the results of Experiment 1 in which participants heard the sounds while focusing on performing a visual-attention task. Filled triangles denote annoyance ratings of the same stimuli in Experiment 2 without such a concurrent task.
Psychophysiology of short-term reactions
Both experiments of the present report measured skin conductance responses to the onset of short-duration (3-6 s) traffic-noise samples, and observed significant increases in the magnitude of the responses as a function of sound level, though the effect was not strictly increasing [see Figures 4–7], and was statistically reliable only when a sufficiently large range of levels was presented. Showing a systematic effect of psychophysical level variation goes beyond demonstrating that an overall electrodermal effect is observed at all in response to noise,[11] and is encouraging, given that early investigations had required rather strong contrasts in sound pressure level (e.g., 60 vs. 100 dB SPL) to establish such effects.[18] Interestingly, a recent laboratory study also observed systematic covariation of tonic (sustained) increases in skin conductivity with sound level using noises of longer durations.[12] The most likely mechanism for the electrodermal response to annoying sounds to occur is an emotional/arousal response that reflects the evaluative component of annoyance.[43] Note, however, that even simple level changes within a sound sequence elicit SC responses proportional to the level difference.[44] In the present experiments, no systematic differences in SCRs were observed depending on whether the listener was immersed in a challenging task or not. Future studies should further explore the interaction of electrodermal responses with other psychophysiological indicators of annoyance.
Noise sensitivity and temperament scales
A psychometrically evaluated 52-item noise sensitivity questionnaire that was completed by all participants after the listening tests, revealed substantial effects of that trait on their ratings of the sounds, resulting − on average − in a parallel upward shift of annoyance as a function of level [see Figures 3–6]. Thus, in terms of the potential models discussed by van Kamp et al. (see their Figure 1),[21] noise sensitivity moderates the effect of sound level on annoyance, but does so in an additive fashion, not a multiplicative one. That agrees with most recent laboratory and field studies.[20,22,23,24] We did not find statistically reliable effects of participants’ noise sensitivity on the magnitude of the phasic skin conductance response; interestingly, Park et al. (their Figure 5)[13] did observe slightly larger tonic skin conductance levels in noise-sensitive participants using repeated impact sounds for longer durations.
The (ATQ)[35,45] temperament scales used to identify further personality dimensions potentially related to annoyance in Experiment 2 did not predict VAS ratings or skin conductance reactions as well as noise sensitivity did. Splitting the sample into groups of high vs. low (ATQ) ‘discomfort’ or into groups of strong vs. weak (ATQ) ‘high-intensity pleasure’ did not result in significantly different annoyance functions [as in Figure 6]. That was true, even though − as hypothesized − ATQ discomfort and noise sensitivity turned out to be highly correlated, r = 0.74, while ATQ high-intensity pleasure and noise sensitivity exhibited an equally high negative correlation, r = −0.65, in our sample of 30 participants. It should be noted though, that the ATQ scales generally are multi-sensory, including items for discomfort from high-level stimulation by modalities other than sound (e.g., bright lights), or for high-intensity pleasure derived from vestibular stimulation (a wild ride in an amusement park). Therefore, questionnaires, exclusively focusing on increased susceptibility to auditory stimulation, appear to be more diagnostic to capture the moderating effects of noise sensitivity on noise annoyance.
CONCLUSIONS
Two laboratory experiments on the perceived annoyance of traffic noise recordings presented at different levels show that the annoyance potential judged while listeners are instructed to relax is greater than the one they perceive when performing a distracting visual-attention task, with annoyance due to the sounds slightly increasing with task load. Furthermore, annoyance judgments tended to be incremented for participants rating themselves as sensitive to noise, suggesting an additive effect of this trait. The magnitude of skin conductance responses measured concurrently with each sound presentation increased significantly with sound level in both experiments, thus providing an additional, objective measure of the evaluative reaction to noise.
Financial support and sponsorship
Nil.
Conflicts of interest
There are no conflicts of interest.
Acknowledgement
Portions of the data were presented at the 34th annual meeting of the International Society for Psychophysics “Fechner Day 2018” in Lüneburg, Germany, and at the 23rd International Congress on Acoustics “ICA 2019” in Aachen, Germany.
REFERENCES
- 1.International Organization for Standardization (ISO) ISO/TS 15666 Acoustics − Assessment of Noise Annoyance by Means of Social and Socio-Acoustic Surveys. Geneva: ISO; 2003. [Google Scholar]
- 2.Guski R, Felscher-Suhr U, Schuemer R. The concept of noise annoyance: How international experts see it. J Sound Vib. 1999;223:513–27. [Google Scholar]
- 3.Fields JM, De Jong RG, Gjestland T, Flindell IH, Job RFS, Kurra S, L.ercher P, Vallet M, Yano T, Guski R, Felscher-Suhr U, Schuemer R. Standardized general-purpose noise reaction questions for community noise surveys: Research and a recommendation. J Sound Vib. 2001;242:641–79. [Google Scholar]
- 4.Guski R, Bosshardt HG. Gibt es eine “unbeeinflusste” Lästigkeit? [Is there an “unbiased annoyance”? Z Lärmbekämpfung] 1992;39:67–74. [Google Scholar]
- 5.Lambert J, Champelovier P, Blanchet R, Lavandier C, Terroir J, Márki F, Griefahn B, Iemma U, Janssens K, Bisping R. Human response to simulated airport noise scenarios in home-like environments. Appl Acoust. 2015;90:116–25. [Google Scholar]
- 6.Marquis-Favre C, Morel J. A simulated environment experiment on annoyance due to combined road traffic and industrial noises. Int J Environ Res Public Health. 2015;12:8413–33. doi: 10.3390/ijerph120708413. [DOI] [PMC free article] [PubMed] [Google Scholar]
- 7.Gille LA, Marquis-Favre C., Klein A. Noise annoyance due to urban road traffic with powered-two-wheelers: quiet periods, order and number of vehicles. Acta Acust United Ac. 2016;102:474–87. [Google Scholar]
- 8.Ryu JK, Jeon JY. Influence of noise sensitivity on annoyance of indoor and outdoor noises in residential buildings. Appl Acoust. 2011;72:336–40. [Google Scholar]
- 9.Cavanagh P, Alvarez GA. Tracking multiple targets with multifocal attention. Trends Cogn Sci. 2005;9:349–54. doi: 10.1016/j.tics.2005.05.009. [DOI] [PubMed] [Google Scholar]
- 10.Pylyshyn ZW, Storm RW. Tracking multiple independent targets: evidence for a parallel tracking mechanism. Spat Vis. 1988;3:179–97. doi: 10.1163/156856888x00122. [DOI] [PubMed] [Google Scholar]
- 11.Notbohm G, Schmook R, Schwarze S, Angerer P. Patterns of physiological and affective responses to vehicle pass-by noises. Noise Health. 2013;15:355–66. doi: 10.4103/1463-1741.116585. [DOI] [PubMed] [Google Scholar]
- 12.Park SH, Lee PJ. Effects of floor impact noise on psychophysiological responses. Building and Environment. 2017;116:173–81. [Google Scholar]
- 13.Park SH, Lee PJ, Jeong JH. Effects of noise sensitivity on psychophysiological responses to building noise. Build Environ. 2018;136:302–11. [Google Scholar]
- 14.Babisch W. Traffic noise and cardiovascular disease: epidemiological review and synthesis. Noise Health. 2000;2:9–32. [PubMed] [Google Scholar]
- 15.Ising H, Kruppa B. Health effects caused by noise: evidence in the literature from the past 25 years. Noise Health. 2004;6:5–13. [PubMed] [Google Scholar]
- 16.van Kempen E, Casas M, Pershagen G, Foraster M. WHO Environmental Noise Guidelines for the European Region: a systematic review on environmental noise and cardiovascular and metabolic effects: a summary. Int J Environ Res Public Health. 2018;15:379. doi: 10.3390/ijerph15020379. [DOI] [PMC free article] [PubMed] [Google Scholar]
- 17.Turpin G, Siddle DAT. Effects of stimulus intensity on electrodermal activity. Psychophysiology. 1979;16:582–91. doi: 10.1111/j.1469-8986.1979.tb01525.x. [DOI] [PubMed] [Google Scholar]
- 18.Turpin G, Schaefer F, Boucsein W. Effects of stimulus intensity, risetime, and duration on autonomic and behavioral responding: implications for the differentiation of orienting, startle, and defense responses. Psychophysiology. 1999;36:453–63. [PubMed] [Google Scholar]
- 19.Stansfeld SA, Clark CR, Turpin G, Jenkins LM, Tarnopolsky A. Sensitivity to noise in a community sample: II. Measurement of psychophysiological indices. Psychol Med. 1985;15:255–63. doi: 10.1017/s0033291700023539. [DOI] [PubMed] [Google Scholar]
- 20.Schreckenberg D, Griefahn B, Meis M. The associations between noise sensitivity, reported physical and mental health, perceived environmental quality, and noise annoyance. Noise Health. 2010;12:7–16. doi: 10.4103/1463-1741.59995. [DOI] [PubMed] [Google Scholar]
- 21.van Kamp I, Job RF, Hatfield J, Haines M, Stellato RK, Stansfeld SA. The role of noise sensitivity in the noise response relation: a comparison of three international airport studies. J Acoust Soc Am. 2004;116:3471–9. doi: 10.1121/1.1810291. [DOI] [PubMed] [Google Scholar]
- 22.Ellermeier W, Eigenstetter M, Zimmer K. Psychoacoustic correlates of individual noise sensitivity. J Acoust Soc Am. 2001;109:1464–73. doi: 10.1121/1.1350402. [DOI] [PubMed] [Google Scholar]
- 23.Gille LA, Marquis-Favre C, Weber R. Aircraft noise annoyance modeling: consideration of noise sensitivity and of different annoying acoustical characteristics. Appl Acoust. 2017;115:139–49. [Google Scholar]
- 24.Vallin PA, Marquis-Favre C, Bleuse J, Gille LA. Railway noise annoyance modeling: Accounting for noise sensitivity and different acoustical features. J Acoust Soc Am. 2018;144:3381–90. doi: 10.1121/1.5082296. [DOI] [PubMed] [Google Scholar]
- 25.Miedema HM, Vos H. Noise sensitivity and reactions to noise and other environmental conditions. J Acoust Soc Am. 2003;113:1492–504. doi: 10.1121/1.1547437. [DOI] [PubMed] [Google Scholar]
- 26.Zimmer K, Ellermeier W. Konstruktion und Evaluation eines Fragebogens zur Erfassung der individuellen Lärmempfindlichkeit [Construction and evaluation of a questionnaire for measuring individual noise sensitivity] Diagnostica. 1998;44:11–20. [Google Scholar]
- 27.Zimmer K, Ellermeier W. Psychometric properties of four measures of noise sensitivity: a comparison. J Environ Psychol. 1999;19:295–302. [Google Scholar]
- 28.Green CS, Bavelier D. Enumeration versus multiple object tracking: the case of action video game players. Cognition. 2006;101:217–45. doi: 10.1016/j.cognition.2005.10.004. [DOI] [PMC free article] [PubMed] [Google Scholar]
- 29.Koenig S, Nauroth P, Lucke S, Lachnit H, Gollwitzer M, Uengoer M. Fear acquisition and liking of out-group and in-group members: learning bias or attention? Biol Psychol. 2017;129:195–206. doi: 10.1016/j.biopsycho.2017.08.060. [DOI] [PubMed] [Google Scholar]
- 30.Shinn-Cunningham BG. Object-based auditory and visual attention. Trends Cogn Sci. 2008;12:82–86. doi: 10.1016/j.tics.2008.02.003. [DOI] [PMC free article] [PubMed] [Google Scholar]
- 31.Huang Y, Griffin MJ. The discomfort produced by noise and whole-body vertical vibration presented separately and in combination. Ergonomics. 2014;57:1724–38. doi: 10.1080/00140139.2014.943683. [DOI] [PubMed] [Google Scholar]
- 32.Kim J, Lim C, Hong J, Lee S. Noise-induced annoyance from transportation noise: short-term responses to a single noise source in a laboratory. J Acoust Soc Am. 2010;127:804–14. doi: 10.1121/1.3273896. [DOI] [PubMed] [Google Scholar]
- 33.Morel J, Marquis-Favre C, Gille LA. Noise annoyance assessment of various urban road vehicle pass-by noises in isolation and combined with industrial noise: a laboratory study. Appl Acoust. 2016;101:47–57. [Google Scholar]
- 34.Rothbart MK, Ahadi SA, Evans DE. Temperament and Personality: Origins and Outcomes. J Pers Soc Psychol. 2000;78:122–35. doi: 10.1037//0022-3514.78.1.122. [DOI] [PubMed] [Google Scholar]
- 35.Wiltink J, Vogelsang U, Beutel ME. Temperament and personality: the German version of the Adult Temperament Questionnaire (ATQ) GMS Psychosoc Med. 2006;3:10. [PMC free article] [PubMed] [Google Scholar]
- 36.Öhrström E, Björkman M, Rylander R. Laboratory annoyance and different traffic noise sources. J Sound Vib. 1980;70:333–41. [Google Scholar]
- 37.Parducci A. Category judgment: A range-frequency model. Psychol Rev. 1965;72:407–18. doi: 10.1037/h0022602. [DOI] [PubMed] [Google Scholar]
- 38.Ellermeier W, Westphal W, Heidenfelder M. On the “absoluteness” of category and magnitude scales of pain. Percept Psychophys. 1991;49:156–66. doi: 10.3758/bf03205035. 1991. [DOI] [PubMed] [Google Scholar]
- 39.Kerst SM, Howard JH. Memory psychophysics for visual area and length. Mem Cogn. 1978;6:327–35. doi: 10.3758/bf03197463. [DOI] [PubMed] [Google Scholar]
- 40.Moyer RS, Bradley DR, Sorensen MH, Whiting JC, Mansfield DP. Psychophysical functions for perceived and remembered size. Science. 1978;200:330–32. doi: 10.1126/science.635592. [DOI] [PubMed] [Google Scholar]
- 41.Öhrström E, Skånberg A, Svensson H, Gidlöf-Gunnarsson A. Effects of road traffic noise and the benefit of access to quietness. J Sound Vib. 2006;295:40–59. [Google Scholar]
- 42.Zimmer K, Ghani J, Ellermeier W. The role of task interference and exposure duration in judging noise annoyance. J Sound Vib. 2008;311:1039–51. [Google Scholar]
- 43.Bradley MM, Lang PJ. Affective reactions to acoustic stimuli. Psychophysiology. 2000;37:204–15. [PubMed] [Google Scholar]
- 44.Chuen L, Sears D, McAdams S. Psychophysiological responses to auditory change. Psychophysiology. 2016;53:891–904. doi: 10.1111/psyp.12633. [DOI] [PubMed] [Google Scholar]
- 45.Evans DE, Rothbart MK. Developing a model for adult temperament. Journal of Research in Personality. 2007;41:868–88. [Google Scholar]


