Abstract
An animal’s stress response requires different adaptive strategies depending on the nature and duration of the stressor. While acute stressors, like predation, induce a rapid and energy-demanding fight or flight response, long-term environmental stressors induce the gradual and long-lasting activation of highly conserved cytoprotective processes1–3. In animals across the evolutionary spectrum the continued activation of the fight-or-flight response weakens the animal’s resistance to environmental challenges4,5. However, the molecular and cellular mechanisms that regulate the trade-off between flight response and long-term stressors are poorly understood. Here we show that repeated induction of the C. elegans flight response shortens lifespan and inhibits conserved cytoprotective mechanisms. The flight response activates neurons that release tyramine, the invertebrate analog of adrenaline/noradrenaline. Tyramine stimulates the DAF-2/Insulin/IGF-1 pathway and precludes the induction of stress response genes by activating an adrenergic-like receptor in the intestine. In contrast, long-term environmental stressors, such as heat or oxidative stress, reduce tyramine release allowing the induction of cytoprotective genes. These findings demonstrate that a neural stress-hormone supplies a state-dependent neural switch between acute flight and long-term environmental stress responses and provides mechanistic insights into how the flight response impairs cellular defense systems and accelerates aging.
Keywords: Stress, Hormesis, Fight-or-Flight response, C. elegans, Neuromodulation, Tyramine, Insulin Signaling, G-Protein Coupled Receptors (GPCRs)
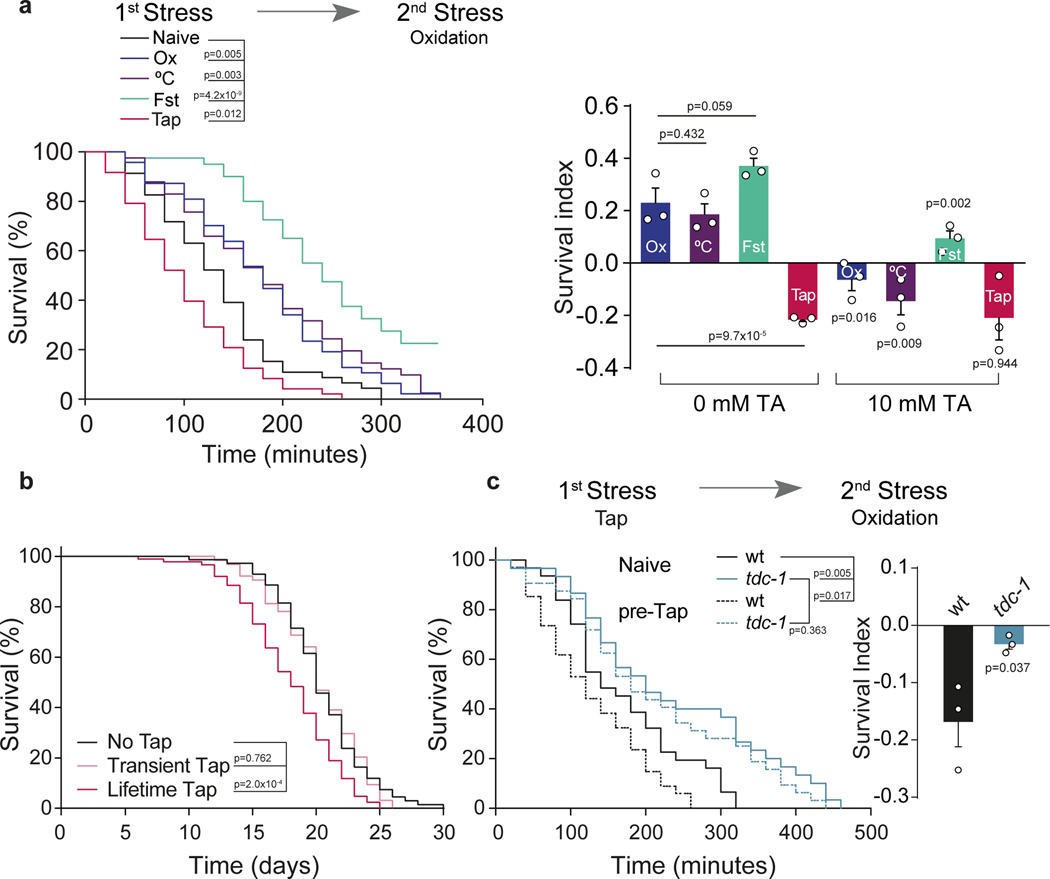
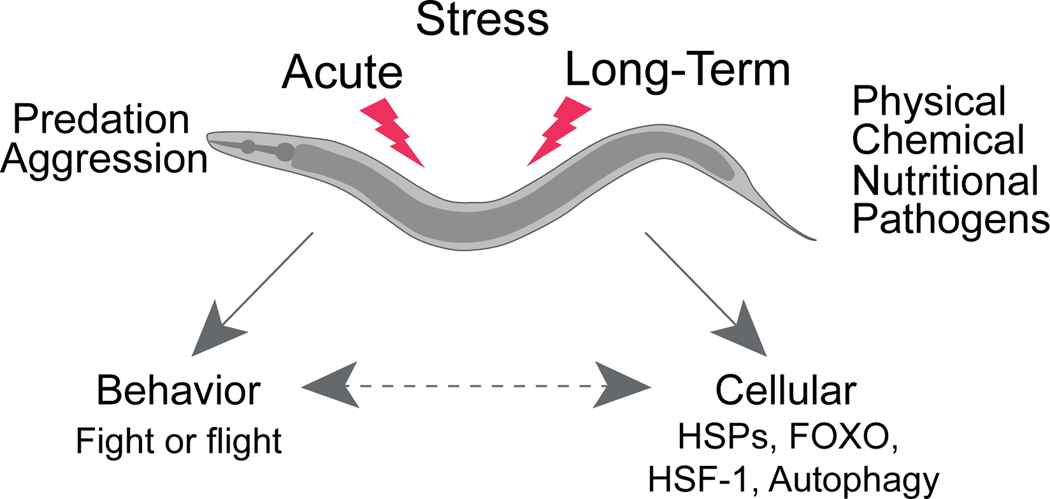
Like other animals, C. elegans faces challenges that occur either abruptly (e.g. predation) or more progressively (e.g. oxidation, heat, food shortage) (Extended Data Fig. 1a). Prolonged exposure to environmental stressors reduces an animal’s lifespan6 (Fig. 1a, Extended Data Fig. 2b). In response to touch, C. elegans engages in an escape- or flight response where it rapidly moves away from the stimulus7. We triggered the flight response every 5 min by applying a vibrational stimulus (“tap”) to the side of the agar plate containing the animals8. The repeated induction of the flight response throughout life significantly reduced lifespan (Fig. 1b). To study the interaction between different stress responses, we analyzed whether a mild stressor can affect C. elegans resistance to subsequent stronger stressors. Low doses of oxidative stress, mild heat or fasting made C. elegans more resistant to a subsequent higher dose of the same and other environmental stressors (Fig. 1a, Extended Data Fig. 2b,c). This adaptive induction of enhanced stress tolerance, called hormesis, has been previously observed in living organisms9–12. In contrast, the transient induction of the flight response, which does not affect overall lifespan of the animal (Fig. 1b), markedly reduced resistance to subsequent oxidative or thermal stress (Fig. 1a, Extended Data Fig. 2a–c).
Figure 1. The flight response and tyramine impair the resistance to subsequent stressors.
a, Representative survival curves of pre-stressed nematodes exposed to subsequent oxidation. Pre-stressors: Ox: Oxidation, °C: Heat, Fst: Fasting and Tap. Right, Survival Index (SI = fraction of surviving pre-treated animals minus fraction of surviving naïve animals) compare to naïve animals, in the absence or presence of tyramine (TA) during pre-treatment. Data represented as mean ± SEM. For 0 mM TA conditions, One-way ANOVA followed by Holm-Sidak’s test was used. For 10 mM TA conditions, a two-tailed t test (no TA vs TA) was used. b, Representative survival curves of animals subjected to activation of the flight response (every 5 min) for either 2.5 hours (Transient) or throughout life (Lifetime) (two-sided log-rank) c, Oxidation survival curves and SI (mean ± SEM, two-tailed t test, n=3) of tdc-1 mutants pre-exposed to mechanical stimulus (tap).
For survival curves (a-c), a two-sided log-rank test was used and the experiments were independently repeated three times (n=3) with similar results. 60–120 worms per condition per experiment were used.
Tyramine, which is structurally and functionally related to adrenaline/noradrenaline, plays a crucial role in the orchestration of the C. elegans flight response13–15. We found that exogenous tyramine inhibits the hormetic effects of mild oxidative, thermal, or nutritional pre-stressors (Fig. 1a, Extended Data Fig. 2c). Moreover, induction of the flight response in tyramine-deficient tdc-1 animals did not impair their subsequent resistance to either strong oxidative (Fig. 1c) or thermal stress (Extended Data Fig. 2f). This suggests that tyramine release during the flight response impairs the animal’s capacity to respond to subsequent environmental stressors. Furthermore, tdc-1 mutants were more resistant to environmental stressors and had an increased lifespan compared to wild-type animals (Fig. 1c and Extended Data Figs. 2f–j and 3b–d). In contrast, exogenous tyramine impaired environmental stress resistance and drastically shortened lifespan (Extended Data Fig. 2g and j). Tyramine is also a precursor for octopamine biosynthesis13. However, our results indicate that the lack of tyramine, and not octopamine, underlies the stress resistant phenotype of tdc-1 mutants (Extended Data Fig. 3).
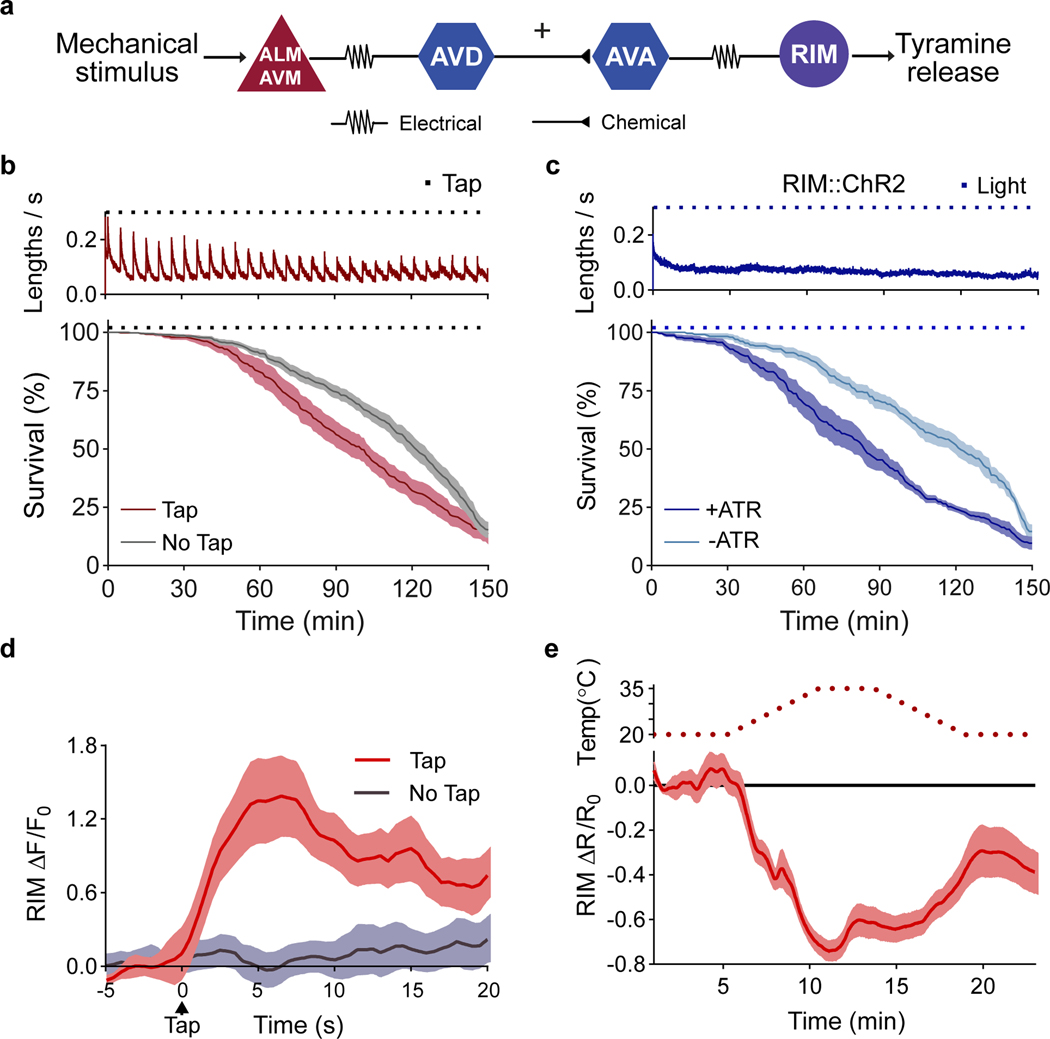
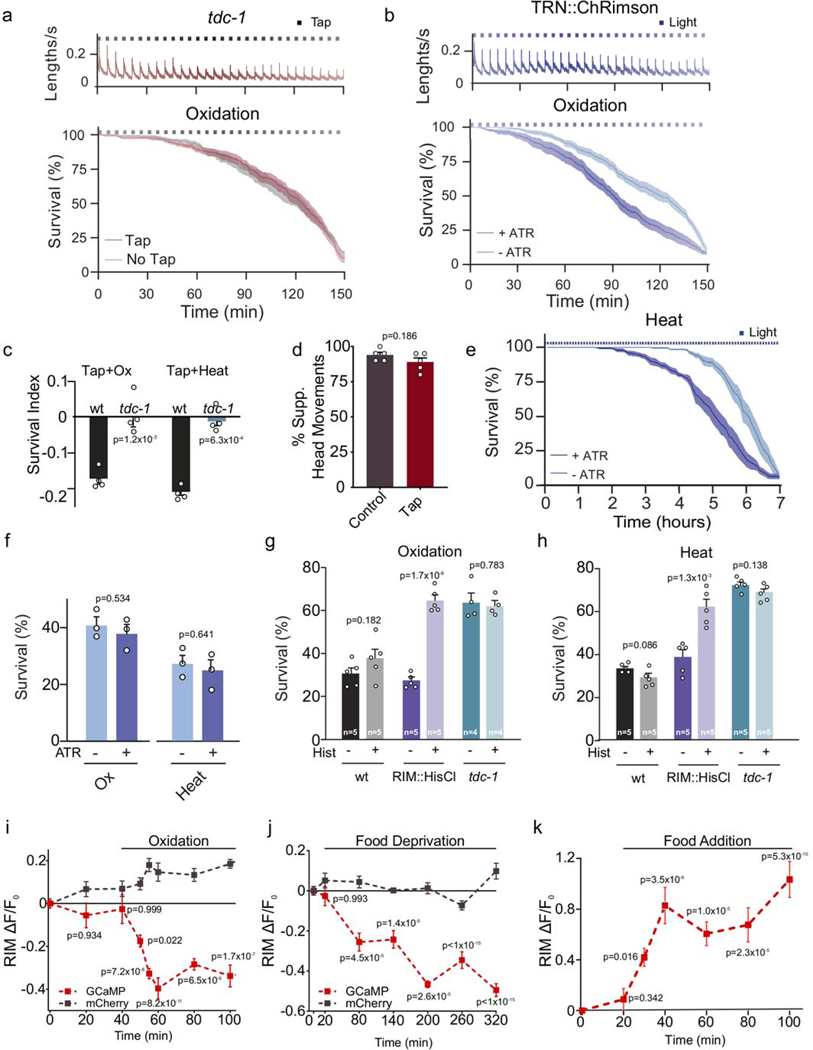
The flight response and environmental stressors may pose conflicting challenges to the organism. We found that repeated activation of the flight response during exposure to oxidative or heat stress reduced resistance of wild-type animals, but not tdc-1 mutants (Fig. 2b, Extended Data Fig. 4a, c). To exclude the possibility that the mechanical stimulus causes a physical damage that impairs the animal’s defense mechanisms, we triggered the flight response by optogenetic activation of mechanosensory neurons (Extended Data Fig. 4b). Light induction of the flight response reduced survival to oxidative stress and heat (Extended Data Fig. 4b, e). The flight response can be initiated by stimulation of the touch receptor neurons (TRN), which in turn activate a single pair of tyraminergic RIM neurons7,13,14 (Fig. 2a). Optogenetic activation of RIM was not sufficient to trigger a flight response, but did reduce resistance to environmental stress (Fig. 2c). In addition, the silencing of tyraminergic RIM neurons increased resistance to oxidative and heat stress (Extended Data Fig. 4g, h). Therefore, while tyramine orchestration of the flight response is beneficial to escape from predation15, it negatively impacts the response to environmental stressors.
Figure 2. The RIM neuron exhibits opposing activity patterns during the flight response vs exposure to environmental stressors.
a, Circuit for C. elegans flight response triggered by mechanical stimulation. b, Velocity traces (top, n=10 independent experiments) and survival curves (bottom) during oxidative stress for wild-type animals in the absence (n=13 independent experiments) or presence (n=10 independent experiments) of a mechanical stimulus (black squares). c, Velocity (n=7 independent experiments) and survival curves of animals exposed to oxidative stress and RIM optogenetic activation with (+ ATR) or without all-trans retinal (- ATR) (n=6 independent experiments per condition). Blue squares indicate light stimulus. d, Ca2+ dynamics of RIM::GCaMP6 (ΔF/F0) upon a mechanical stimulus t=0, tap: n=13 animals (red), no tap: n=14 animals (grey). e, Ca2+ responses upon heat stress (n=29 animals). Central lines indicate mean; shaded regions indicate SEM.
We analyzed the activity of RIM neurons during the flight- or environmental stress response. At the onset of the flight response there was an immediate rise in RIM calcium levels (Fig. 2d), consistent with observations that these neurons are active during reversals16,17. In contrast, a gradual but sustained reduction of calcium levels in RIM neurons was detected in animals subjected to heat, oxidative stress or food deprivation (Fig. 2e, Extended Data Fig.4i, j). This reduction is reversed upon removal of the stressor (Fig. 2e, Extended Data Fig. 4k). Thus, while the activity of the tyraminergic RIM neurons rapidly increased during the flight response, their activity decreased upon exposure to environmental stressors.
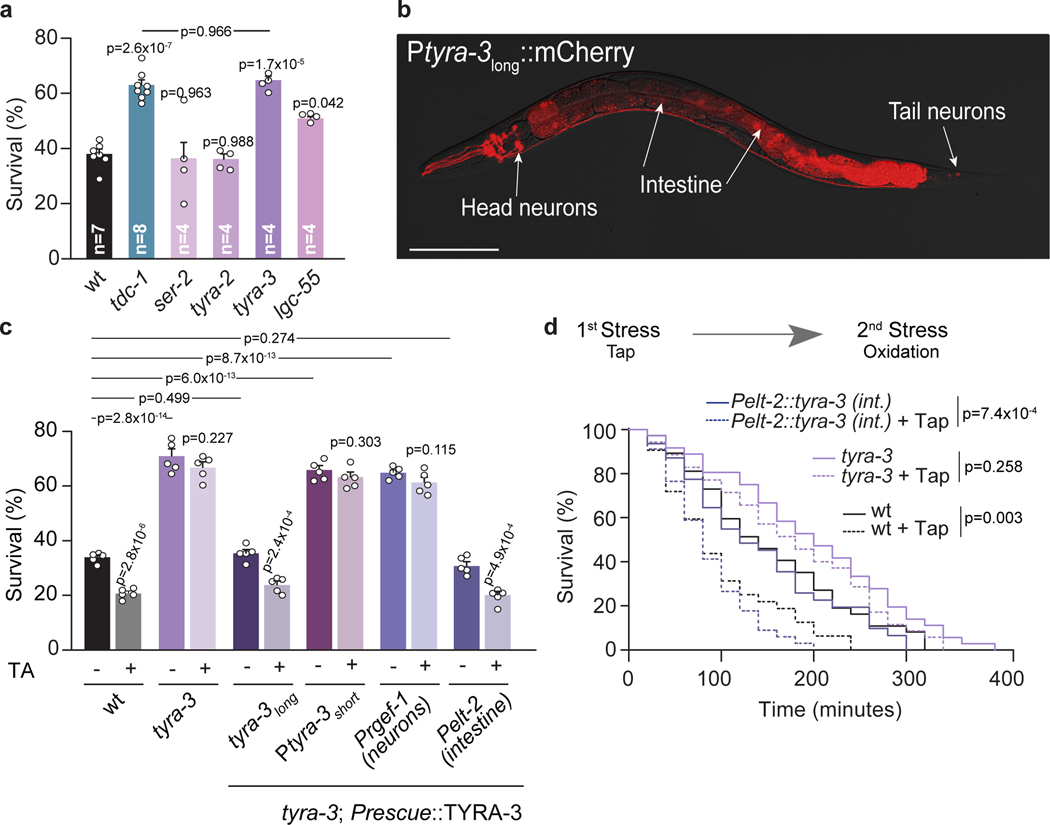
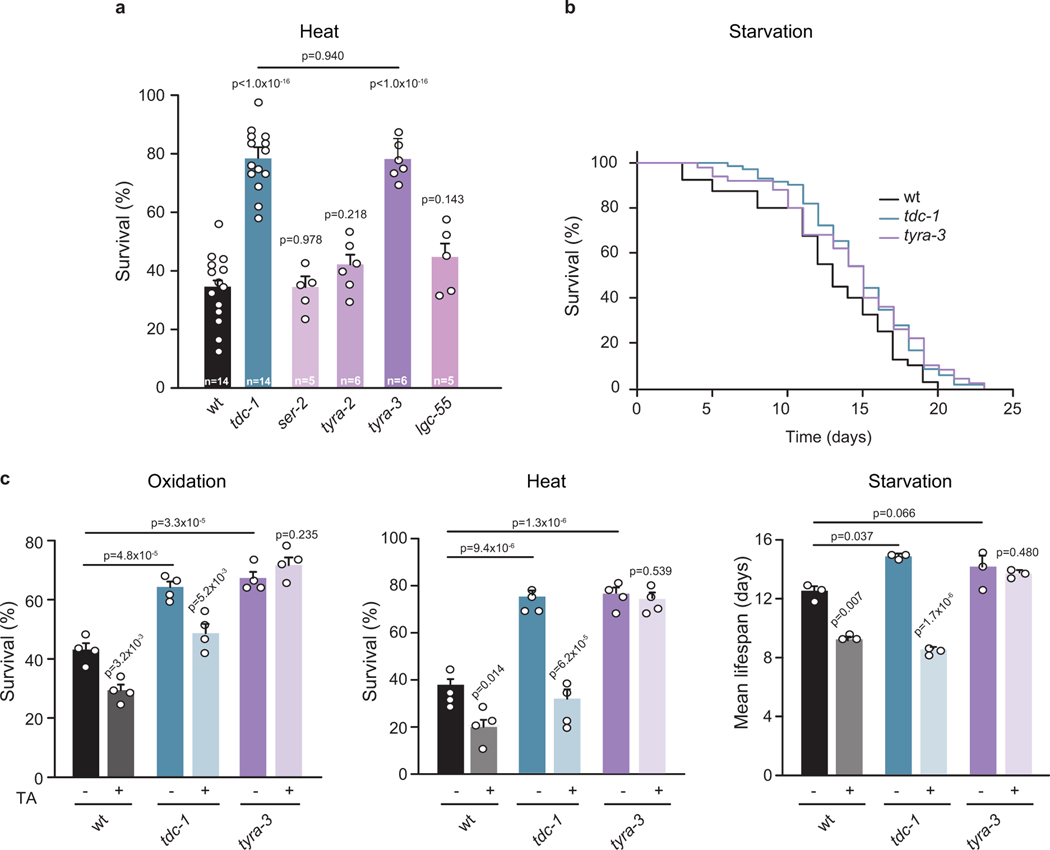
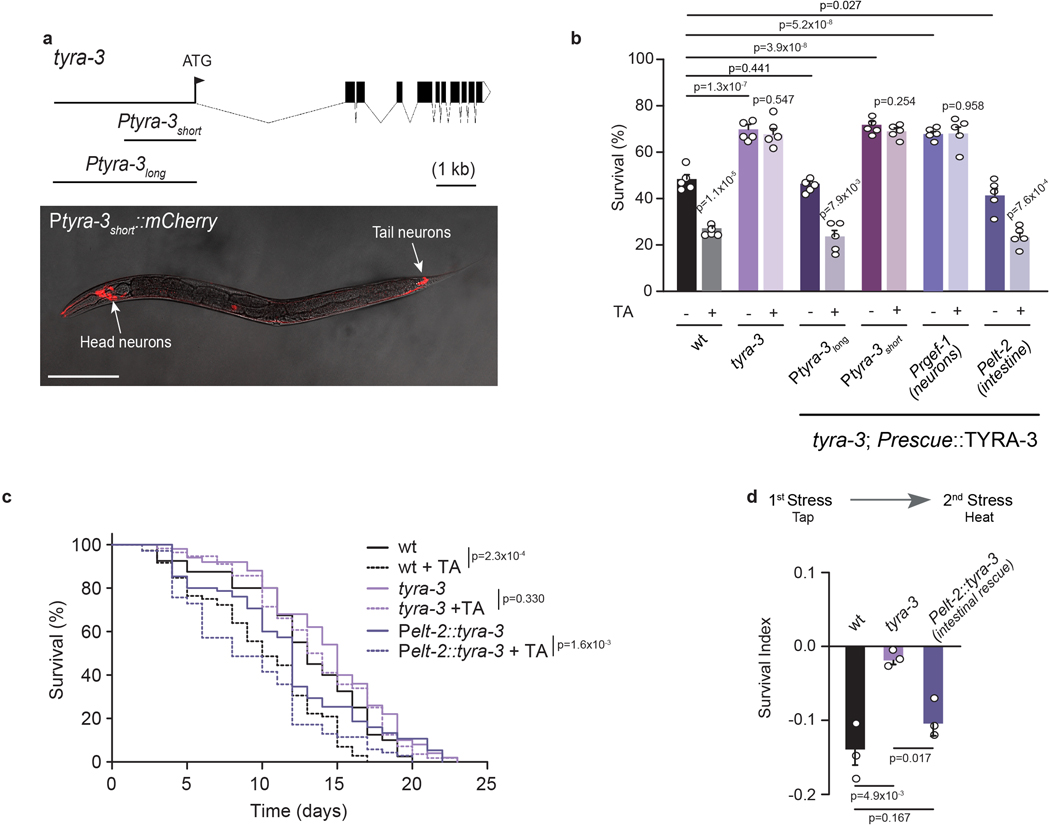
C. elegans has four different receptors that are activated by tyramine: three adrenergic-like GPCRs (SER-2, TYRA-2 and TYRA-3)18,19 and a tyramine-gated chloride channel (LGC-55)14. Like tyramine-deficient animals, we found that tyra-3 mutants are resistant to oxidative stress, heat and starvation (Fig. 3a; Extended Data Fig. 5 a,b). Moreover, exogenous tyramine did not reduce the stress resistance of tyra-3 mutants (Fig. 3c; Extended Data Fig. 5c). This shows that tyraminergic activation of TYRA-3, a predicted Gq-coupled GPCR20, is required to modulate the stress response. Where does TYRA-3 function? tyra-3 is expressed in a subset of neurons and the intestine (Fig. 3b). Expression rescue of tyra-3 in the intestine, but not in neurons, was sufficient to restore the stress sensitivity and the negative impact of exogenous tyramine on heat, oxidative stress and starvation survival to wild-type levels (Fig. 3c and Extended Data Fig. 6b, c). Moreover, while repeated induction of the flight response in tyra-3 mutants did not increase sensitivity to subsequent heat or oxidative stress, sensitivity was restored when tyra-3 was expressed in the intestine (Fig. 3d and Extended Data Fig. 6d). Since RIM neurons have no direct synaptic outputs onto the intestine, tyramine acts as a neurohormone to inhibit the environmental stress response through the activation of TYRA-3 in the intestine.
Figure 3. The GPCR TYRA-3 is required in the intestine for tyraminergic modulation of the stress response.
a, Resistance of tyramine receptor mutants exposed to oxidation (mean ± SEM, for each condition n is indicated in the figure, 40–60 worms per condition per experiment). One-way ANOVA, Holm-Sidak’s post-hoc test for multiple comparisons was used. b, Expression of a 3.4 kb Ptyra-3long::mCherry reporter. Scale bar: 150 μm. c, Survival percentages (mean ± SEM, n=5) of tyra-3 mutant animals expressing a tyra-3 cDNA driven by Ptyra-3long (Endogenous), Ptyra-3short (Neuronal subset), Prgef-1 (Pan-neuronal) or Pelt-2 (Intestinal) promoter upon exposure to oxidative stress, with or without tyramine (10 mM). For conditions without TA, One-way ANOVA, Holm-Sidak’s post-hoc test versus wild type was used. Two-tailed t test was used for comparison within each strain (no TA vs TA). d, Representative survival curves of naïve (solid line) or pre-tapped animals (dashed line) exposed to oxidation (two-sided log-rank). The experiment was independently repeated 3 times (n=3) with similar results.
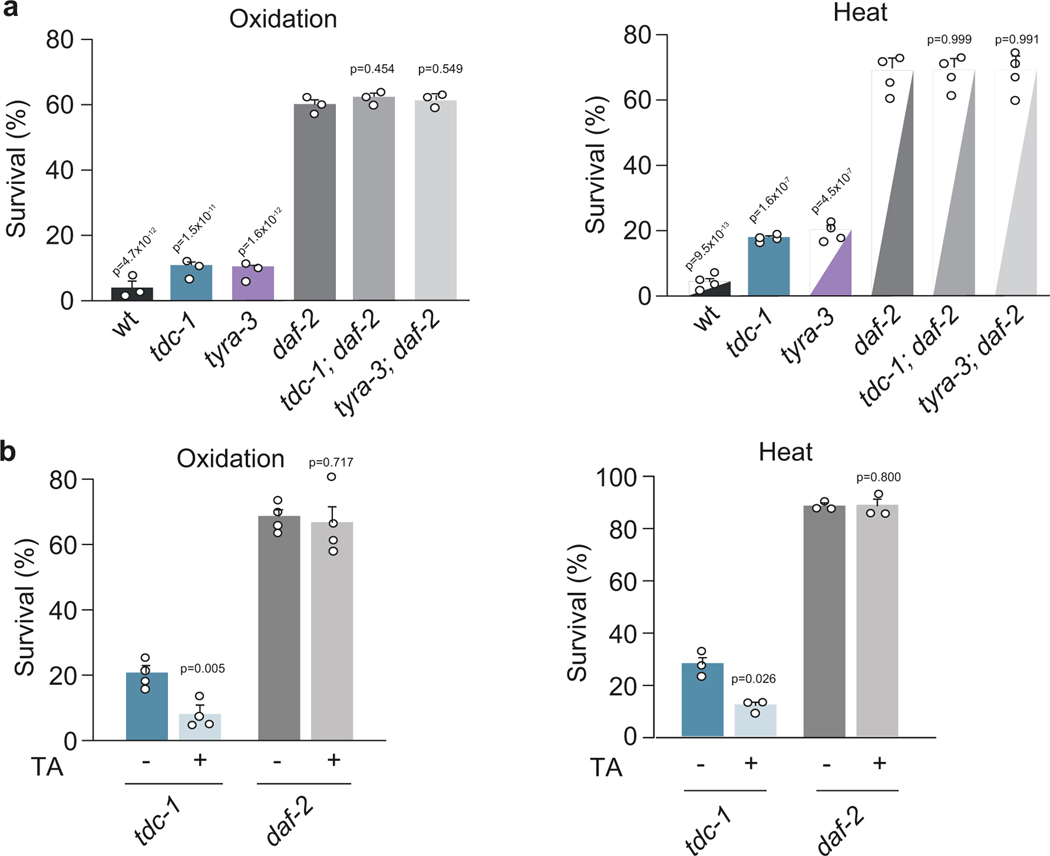
The response to environmental stressors triggers the activation of conserved cytoprotective processes21. Stress-induced activation of transcription factors, such as the Forkhead box O (FOXO/DAF-16), Heat Shock Factors (HSFs/HSF-1) and NF-E2-related factor 2 (NRF2/SKN-1), increases the expression of antioxidant enzymes and protein chaperones to cope with protein misfolding and aggregation2,3. The insulin/IGF-1 signaling (IIS) pathway regulates growth, reproduction, metabolic homeostasis, lifespan and stress resistance from nematodes to humans22. In C. elegans, loss-of-function mutations in the insulin/IGF-1 receptor ortholog, DAF-2, increase stress resistance and longevity23. Stress resistance of tdc-1; daf-2 and tyra-3; daf-2 double mutants was similar to that of daf-2 single mutants (Extended Data Fig. 7a) and exogenous tyramine did not impair the stress resistance of daf-2 mutants (Extended Data Fig. 7b). This suggests that tyraminergic inhibition of the environmental stress response depends on the DAF-2/IIS pathway.
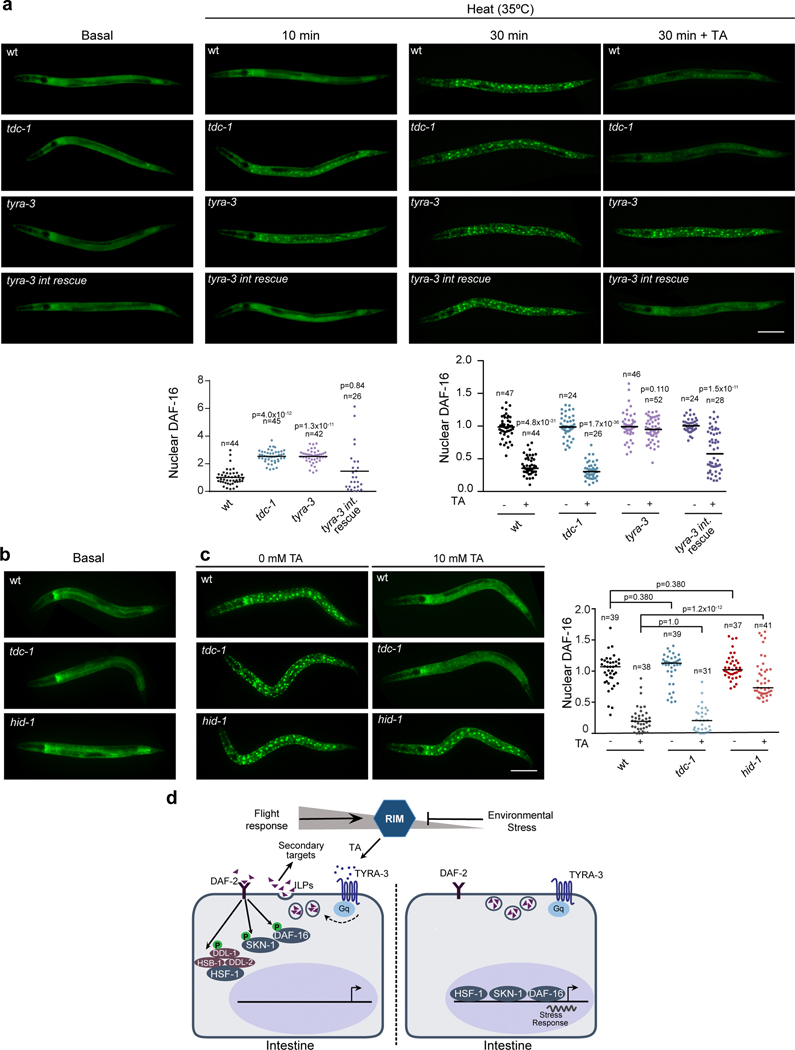
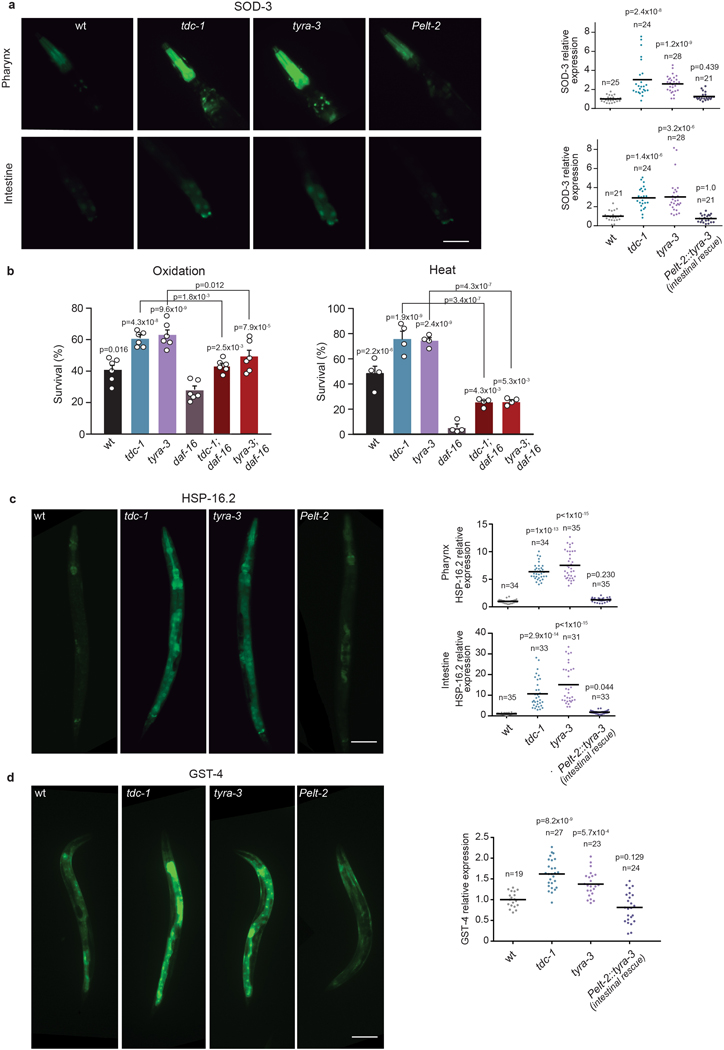
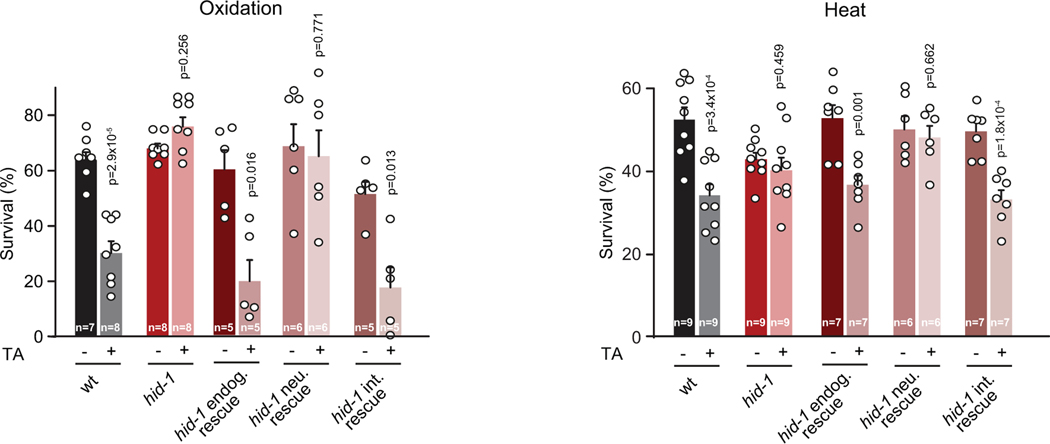
DAF-16/FOXO mediates a large portion of the physiological processes downstream of DAF-2. Environmental stressors reduce the activity of the DAF-2/IGFR, leading to DAF-16/FOXO translocation to the nucleus where it induces the expression of stress response genes21. After 10 min of exposure to heat (35˚C), tdc-1 and tyra-3 mutants exhibited significantly higher levels of nuclear DAF-16/FOXO accumulation compared to the wild-type background (Fig. 4a). Exogenous tyramine inhibited DAF-16/FOXO nuclear localization in wild-type and tdc-1 animals, but not in tyra-3 mutant animals exposed to a prolonged heat stimulus (30 min, Fig. 4a). Intestinal expression of tyra-3 rescued the DAF-16/FOXO localization phenotype of tyra-3 mutants (Fig. 4a). As expected, DAF-16/FOXO localized to the nucleus in response to a short exposure to oxidative, heat or nutritional stress (Extended Data Fig. 8a)21. In contrast, DAF-16/FOXO largely localized to the cytoplasm in response to repeated mechanical stimuli (Extended Data Fig. 8a). The induction of the flight response and optogenetic activation of the RIM neurons inhibited DAF-16/FOXO nuclear localization in animals exposed to heat (Extended Data Fig. 8b,c). Moreover, the expression of sod-3, a DAF-16/FOXO target gene, is upregulated in tdc-1 and tyra-3 mutants (Extended Fig. 9a). daf-16; tyra-3 and daf-16; tdc-1 mutants are more resistant to environmental stress than daf-16 single mutants, indicating that TYRA-3 likely interfaces with the DAF-2/IIS pathway upstream of DAF-16/FOXO (Extended Data Fig. 9b). Indeed, DAF-2 dependent and DAF-16/FOXO independent stress response genes such as hsp-16.2 (HSF-1) and gst-4 (SKN-1)24, were also upregulated in tdc-1 and tyra-3 mutant animals (Extended Data Fig. 9c,d). In tdc-1 and tyra-3 mutants, cytoprotective mechanisms, such as DAF-16 translocation or hsp-16 and sod-3 induction, were induced not only in the intestine, but also in other tissues (Fig. 4 and Extended Data Fig. 9). To test whether tyramine can activate the DAF-2/IIS pathway in non-intestinal cells through the release of Insulin-Like Peptides (ILPs) from the intestine, we analyzed DAF-16/FOXO localization and stress response in hid-1 mutants. HID-1 is a membrane protein required for neuropeptide sorting and insulin secretion in worms and mice25,26. In contrast to the wild type, exogenous tyramine did not impair DAF-16/FOXO translocation and stress resistance in hid-1 mutants (Fig. 4c). Expression of hid-1 in the intestine restored tyramine’s detrimental effect on the resistance to oxidative and heat stress (Extended Data Fig. 10). This suggests that TYRA-3 activation stimulates the release of Insulin-Like Peptides (ILPs) from the intestine to further inhibit cytoprotective pathways in non-intestinal cells (Fig. 4d).
Figure 4. Tyramine signaling inhibits stress-dependent nuclear translocation of DAF-16.
a, DAF-16a/b::GFP localization in basal condition and upon exposure to heat (35°C) for 10 min and 30 min in the absence or presence of tyramine (10 mM TA, 30 min). Scale bar: 150 μm. Bottom, Corresponding scatter dot plot with the number of cells with nuclear DAF-16 per animal (normalized to naïve animals, line at the mean). For 10 min heat conditions, One-way ANOVA Holm-Sidak’s post-hoc test versus wild-type was used. For 35 min heat conditions, a two-tailed t-test (no TA vs TA) was used. The experiment was repeated 4 times (n=4). For each condition n is indicated in the figure. b-c, DAF-16a/b::GFP localization in hid-1 mutants in basal conditions (b) and upon exposure to heat (35°C, 30 min) in the absence or presence of tyramine (c). Right, scatter dot plot with nuclear DAF-16 expression normalized to naïve animals (line at the mean). One-way ANOVA (Kruskal-Wallis test) and Dunn’s post-hoc test were used. The experiment was repeated 3 times (n=3). For each condition, n is indicated in the figure. d, Model: Tyraminergic modulation of the DAF-2/IIs pathway.
The metabolic rate increases during the animal’s flight response27,28. Since the upregulation of the insulin pathway is linked to increased metabolic rates29,30, tyramine-mediated activation of the DAF-2/IIs pathway may induce a metabolic shift to provide the fuel needed for high-energy demands of the C. elegans flight response. While tyramine release facilitates the animal’s escape from a threatening stimulus, the down regulation of tyramine signaling is crucial to deal with environmental stressors. Striking parallels exist in vertebrates, where acute stress stimulates the release of adrenaline and noradrenaline: key inducers of the animal’s fight-or-flight response. Given the conservation in neural control of stress responses, it will be interesting to determine whether perpetuated activation of the “fight-or-flight” response negatively impacts animal health and aging through the inhibition of insulin-dependent cytoprotective pathways.
Methods
Standard C. elegans culture and molecular biology methods were used 31,32. All strains were cultured at 20°C on NGM agar plates with the E. coli OP 50 strain as a food source. The wild-type strain was Bristol N2. Some strains were provided by the CGC, which is funded by NIH Office of Research Infrastructure Programs (P40 OD010440). CX16663 strain was kindly provided by C. Bargmann 33. The NM2761, NM3067, NM3139 and NM3154 strains were kindly provided by M. Nonet34. Worm population density was maintained low throughout their development and during the assays. The strains used were:
N2 (Wild-type)
MT10661 tdc-1(n3420) II
MT13113 tdc-1(n3419) II
MT9455 tbh-1(n3247) X
QW425 tdc-1(n3420) II; zfIs23[Ptbh-1::TDC-1::GFP]
CX16663 kyEx5846[pXJ07(Pgcy-13::HisCl1::SL2::mCherry)]
QW89 lgc-55(tm2913) V
OH313 ser-2(pk1357) X
QW42 tyra-2(tm1815) X
CX11839 tyra-3(ok325)X
QW833 lgc-55(tm2913)V; tyra-3(ok325)X; tyra-2(tm1846)X; ser-2(pk1357) X
OAR61 tyra-3(ok325)X; lin-15(n765ts); nbaEx 1 [pelt-2::TYRA-3 + pL15EK]]
CB1370 daf-2(e1370) III
OAR-2 tdc-1(n3420) II; daf-2(e1370) III
OAR-1 daf-2(e1370) III; tyra-3(ok325) X
QW495 tyra-3(ok325) X; lin-15(n765ts) X; zfEx121[Ptyra-3short::TYRA-3 + pL15EK]
QW1582 tyra-3(ok325) X; lin-15(n765ts)X; zfEx743[Pelt-2::TYRA-3 + pL15EK]
QW2029 tyra-3(ok325) X; lin-15(n765ts)X; zfEx962[Prgef-1::TYRA-3 + pL15EK]
OAR94 tyra-3(ok325) X; lin-15(n765ts)X; nbaEx21[Ptyra-3long::TYRA-3 + pL15EK]]
QW1649 zfIs144[Pmec-4::Chrimson::wCherry, pL15EK]
QW1046 lite-1(ce314) X; zfIs100[Pcex-1::ChR2::GFP]
QW1602 lin-15(n765ts) X; zfEx758[Pcex-1::NLSwCherry::SL2::GCaMP6, pL15EK]
GR1307 daf-16(mgDf50) I
OAR3 daf-16(mgDf50) I; tdc-1(n3420) II
OAR4 daf-16(mgDf50) I; tyra-3(ok325) X
TJ356 zIs356[Pdaf-16::DAF-16a/b::GFP + pRF4]
OAR5 tyra-3(ok325) X; zIs356[Pdaf-16::DAF-16a/b::GFP + pRF4]
OAR6 tdc-1(n3420) II; zIs356[Pdaf-16::DAF-16a/b::GFP + pRF4]
OAR62 tyra-3(ok325) lin-15(n765ts) X; nbaEx1[pelt-2::TYRA-3 + pL15EK];zIs356[Pdaf-16::DAF-16a/b::GFP + pRF4]
CF1553 muIs84[(pAD76) Psod-3::GFP + pRF4]
OAR13 tdc-1(n3420) II; muIs84[(pAD76) Psod-3::GFP + pRF4]
OAR14 tyra-3(ok325) X; muIs84[(pAD76) Psod-3::GFP + pRF4]
OAR92 tyra-3(ok325) lin-15(n765ts) X; nbaEx1[Pelt-2::TYRA-3 + pL15EK]]; [muIs84 [(pAD76) Psod-3::GFP + pRF4]
CL2070 dvIs70[Phsp-16.2::GFP + pRF4]
OAR63 tdc-1(n3420) II, dvIs70[Phsp-16.2::GFP + pRF4]
OAR64 tyra-3(ok325) X, dvIs70[Phsp-16.2::GFP + pRF4]
OAR65 tyra-3(ok325) lin-15(n765ts) X; dvIs70[Phsp-16.2::GFP + pRF4]; nbaEx1[Pelt-2::tyra-3;pL15EK]
CL2166 dvIs19[(pAF15)Pgst-4::GFP::NLS] III
OAR80dvIs19[(pAF15) Pgst-4::GFP::NLS] III; tyra-3(ok325) X
OAR93; tdc-1(n3420) II; dvIs19[(pAF15) Pgst-4::GFP::NLS] III
OAR81 tyra-3(ok325) lin-15(n765ts) X;dvIs19[(pAF15) gst-4p::GFP::NLS] III; nbaEx1 [Pelt-2::tyra-3;pL15EK]
NM2761 hid-1(sa722) X
NM3067 hid-1(sa722) lin-15(n765ts) X; jsEx896[Phid-1-HID-1-GFP]
NM3139 hid-1(sa722) lin-15(n765ts) X; jsEx909[Pges-1-HID-1-GFP + pL15EK]
NM3154 hid-1(sa722) lin-15(n765ts) X; jsEx897[Prab-3-HID-1-GFP + pL15EK]
QW2027 hid-1(sa722) X; zIs356[Pdaf-16::DAF-16a/b::GFP + pRF4]
QW2045 lin-15(n765ts) X; zfEx969[Ptyra-3long::mCherry; + pL15EK ]
Stress resistance assays
Heat Stress:
Thermotolerance assays were performed as described35 with some modifications. For each strain, four 35 mm NGM agar plates containing 20 animals (with or without 10 mM exogenous tyramine) were incubated at 35˚C for 4 h. To ensure proper heat transfer, 6 mm thick NGM agar plates were used. Animals were synchronized as L4s and used 14 h later. Plates were sealed with Parafilm in zip-lock bags, and immersed in a water bath equilibrated to the appropriated temperature. Surviving animals were counted after 20 h at 20˚C. For all assays, animals were scored as dead if they failed to respond to prodding with a platinum-wire pick to the nose. For longitudinal thermotolerance assays, we used a room at 35˚C and survival was quantified every 20 min on NGM plates containing 30–40 young adults.
Oxidative stress:
Iron sulfate (FeSO4) was used as an oxidative stressor. For Fe2+ treatment, 20 L4 worms were transferred to 35 mm agar plates containing FeSO4 at the indicated concentration and time (1 mM, 1 h for mild stress and 15 mM, 1 h for strong stress). For longitudinal assays we scored the survival every 20 minutes in agar plates containing 3 mM Fe2+.
Food deprivation:
L4 animals were rinsed off the plate and washed with M9 buffer and then were seeded in a 96 multiwell plate (one worm per well) containing M9 with or without tyramine (10 mM). Survival was monitored every day until no living animals were observed. Animals with larvae in their uterus (“bag of worms”) were only occasionally observed, and those animals were discarded from the assay.
Flight response:
To induce the flight response a vibrational stimulus (Tap) was applied to the plate every 5 minutes for 2.5 hours. Tap stimuli were delivered using custom Matlab script for Arduino Uno microcontroller to drive a linear push solenoid (Saia-Burgess195205–127 / STA / 75L STA 0˚ PUSH). This tap protocol was chosen because, this inter stimulus interval results in repeated induction of the flight response with minimal habituation36 (see velocity trace in Extended Data Fig 4b). The number of inductions of the flight response (30 in 2.5 hours) was selected after analyzing the effects of number of taps (from 1 to 40 elicited every 5 minutes) on the animal resistance to subsequent oxidative or heat stress (see Extended Data Fig. 2b). Tyramine release leads to the suppression of head movements through the activation of LGC-55, a tyramine-gated chloride channel37,38. Animals that were subjected to 30 successive taps every 5 minutes, still suppressed their head movements in response to anterior touch (Extended Data Fig. 4f, revised version). This indicates that the RIM is activated and tyramine is released upon during the repeated mechanical stimulation of this tapping protocol. All the custom software created and used in this work are available upon request.
Hormesis assays
Young adult worms were exposed to mild oxidation (1 mM Fe2+, 1 h), fasting (8 h without food), heat (35˚C, 20 min), or transient activation of the flight response (tapping plates every 5 min during 2.5 h (30 taps)). All the pre-treatments were performed both in the presence or absence of exogenous tyramine (10 mM). After recovery (1 h on NGM agar plates seeded with OP50) the animals were exposed either to high Fe+ concentration (3 mM) or heat (35˚C). Animal survival was evaluated every 20 min. The survival index (SI) was calculated as follows: SI = (number of surviving pre-treated worms/ total number of pre-treated animals) minus (number of naive surviving animals/total number of naive animals). The SI was calculated, by scoring the number of survivors after 2 h of exposure to 3 mM Fe2+ or 4 h of exposure to 35˚C. Positive values indicate an improved stress resistance while negative values indicate an impairment of stress resistance compared to naive animals.
Lifespan assays
Lifespan studies were performed at 20˚C on NGM plates (BactoAgar: BritaniaLab, Argentina or Becton Dickinson, USA) with OP50 as a food source as described previously39–41. Briefly, gravid hermaphrodites were placed on fresh plates and allowed to lay eggs overnight (day 0 post-hatch). The following day, gravid animals were withdrawn. This time point represents day 1 after hatching. On day 3 post-hatch, worm were re-synchronized by picking L4 animals and transferred into individual plates (10–15 worms per plate (7–8 plates per condition)). To avoid food depletion, animals were transferred to fresh Petri dishes about every two days until the cessation of progeny production. Animals were scored everyday as dead if they displayed no spontaneous movement or response when prodded. Worms that displayed internally hatched progeny, an extruded gonad or desiccation due to crawling off the agar were excluded from the analysis. We found lifespan extension and increased resistance for both tdc-1 alleles: n3419 and n3420. These results differ from those reported by Chun et al 201542, where no differences were observed between lifespan of wild-type and tdc-1(n3419) mutant animals. This could be due to slight difference in growth conditions (e.g. different agar sources) or differences in the wild-type strain used for comparison in lifespan experiments. The tdc-1(n3420) and tdc-1(n3419) alleles were backcrossed >10 x into wild-type strain that was used as a control in the lifespan experiments (obtained from the Horvitz lab, approximately 5x refreezes from the original N2 strain described by Brenner, 197431).
For studying the effect of flight response in lifespan,100 −120 animals were transferred to a single 60mm NGM plate for each condition. A vibrational stimulus (Tap) was applied to the plate every 5 minutes using an Arduino controlled linear push solenoid. To avoid any potential effect of vibrational stimulus on development, tap treatment was started on day 1 after L4-stage (day 4 post hatching). Vibrational stimulus was applied either transiently, tap every 5 min for 2.5 hours, same protocol as used in the hormesis experiments) or during the entire animal life. Kaplan Meier survival curves were generated using SigmaPlot 12.0 and compared by Log-Rank test.
Locomotion assays
Mobility was assessed at days 4, 7 and 10 of adulthood. To evaluate mobility, 10 worms were transferred to an unseeded NMG plate into a drop of M9 buffer. Once the drop was dried-up, worms were left to acclimate for 2–3 minutes. 30 – 60 seconds videos were acquired by a camera controlled by Fire-i™ software (Unibrain) at 15 fps. The average speed (μm/sec) was calculated by dividing the total distance travelled by each worm as a function of the elapsed time using wrMTrck plugin from ImageJ software.
Simultaneous acute and long-term stress assays
Young adult worms were exposed to oxidative stress or heat stress and to a repeated acute stress (tapping plates or light pulse) simultaneously. Survival was evaluated and a survival curve or SI was calculated for each condition.
Oxidative stress:
L4 worms expressing Pmec-4::ChRimson (for TRN activation) or Pcex-1::ChR2 (channelrhodopsin (ChR2) in the tyraminergic RIM neurons) were placed on 3 mM Fe2+ plates, seeded with a thin lawn of 3 mM Fe2+ OP50, and subjected to either a plate tap or a 5 sec light pulse every 5 min for 2.5 h. Light stimuli were delivered using custom Matlab script to an Arduino Uno microcontroller driving a Mightex compact universal LED controller (Mightex SLC-MA02-U). Tap stimuli were delivered using an Arduino controlled linear push solenoid. Light pulses for optogenetic experiments (617 nm for ChRimson activation and 470 nm for ChannelRhodopsin) were delivered using Mightex High-Power LED Collimator Sources (Mightex, LCS-0617–03-11, LCS-0470–03-11). Animals were tracked using Multi-Worm Tracker software43 and single frames were captured every minute to score survival. Survival curves were generated by examining the captured frames, and marking worm deaths using a custom MATLAB script (Mathworks). Animals were considered dead when they were completely motionless for extended period (till the end of the experiment). Velocity was analyzed using Choreography43,44 and custom MATLAB scripts. Custom software used are available upon request.
Heat stress:
40 young adult Pmec-4::ChRimson transgenic animals, that were grown in darkness in the presence (+ATR) or absence (-ATR) of all-trans retinal, were placed on NGM plates seeded with a thin lawn of OP50. A copper ring was placed in the center of the plate to prevent animals from crawling off the plate during the assay. Plates were placed on a transparent plastic chamber connected to a recirculating heated water bath (Hoefer Scientific Instruments, HSI RCB-300 Refrigerated Circulating Bath). A digital thermocouple (Fluke 52 II Dual Input Digital Thermometer) was inserted into the agar to maintain a constant temperature of 35°C. Images of animals were captured every 5 min for 7 h to assess survival. 5 s light pulses of 617 nm were delivered every 5 min for the duration of the experiment. Survival curves were generated as described for the oxidative stress experiment (see above).
RIM activity measurements
Microfluidic devices used for imaging Ca2+ dynamics in freely moving animals were prepared using soft lithography courtesy of D. Albrecht (Worcester Polytechnic Institute). L4 animals that expressed GCaMP in the RIM (lin-15(n765ts); zfEx758[pcex-1::NLSwCherry::SL2::GCaMP6]) were grown overnight. Young adults animals were placed in S Basal buffer and loaded into the microfluidic chamber. Imaging was performed at 2.5 x magnification using an AxioObserver A1 inverted microscope (Zeiss) connected to a Sola SE Light Engine (Lumencor) and an ORCA-Flash 4.0 digital CMOS camera (Hamamatsu). Micromanager Software45 was used to control fluorescence timing and image capture. Animals were loaded into the microfluidic device and exposed to either oxidative stress (6 mM Fe2+) or food deprivation. After an initial 20–40 min acclimation period, fluorescent images were captured at a rate of 1 frame/5 s. For the fight response images were captured at 1 frame/500 ms. RIM GCaMP 6.0 fluorescence values were analyzed using ImageJ software. The traces for the flight response shown in Fig. 2d represent the average RIM GCaMP6 Ca2+ activity (ΔF/F) 5 seconds before and 20 seconds after a tap stimulus. Shaded areas around the traces represent SEM for the averaged traces. A region of interest (ROI) was drawn around the RIM neuron, as well as for a background region. The integrated density was calculated for the background area and subtracted from the image, followed by calculation of integrated density for each ROI. These values were extracted for 6 consecutive image captures starting at the indicated time points. The ROI values for each condition were pooled and averaged. The averaged integrated density values for each capture were normalized to the average of the first time point.
RIM responses to aversive heat were performed using a similar approach as described in Hawk et al., 201846. Briefly, animals were maintained at 20°C and immobilized with 10 mM levamisole on a 5% agarose pad between two coverslips for imaging. Samples were placed on a Peltier device, which allowed precise temperature control via custom LabView (National Instruments) software. GCaMP6 and mCherry fluorescence were simultaneously recorded with a 250 ms exposure time under 10 x magnification using a Hammamatsu ORCA-Flash4.0 camera equipped with a Photometrics Dual-View 2 optical splitter, Image acquisition was controlled using Micromanager software with a capture rate of 1 frame per second. Prior to recording, the coverslips containing the immobilized animals were placed on the Peltier device, which was held at 20°C. Image acquisition began when the temperature protocol was started. This protocol consisted of an initial 5 minute baseline period at 20°C followed by a 5 minute ramp to 35°C. The temperature was held at 35°C for 3 minutes, then decreased over 5 minutes back to 20°C and held at 20°C for a further 5 minutes. Three independent experiments were performed resulting in recordings.of RIM calcium responses of 30 animals. Calcium responses were measured by drawing a 300 px2 oval ROI around the RIM soma to measure mean fluorescent intensity. Since both GCaMP and mCherry signals were projected onto the same imaging sensor, the ROI could be translated to measure the corresponding mCherry fluorescence in the same animal. This ROI was also moved to a portion of an animal devoid of fluorescence to measure background signal in the green and red channels. The background was subtracted from the respective fluorescent measurements. The ratio of GCaMP to mCherry signal within an animal was determined and normalized to baseline by dividing by the average ratio during the first minute of recording for each animal. Traces in Fig 2e–g represent the mean of the 30 animals recorded and shaded regions indicate SEM. Custom software used is available upon request.
Confocal microscopy and image analysis
Animals were mounted in M9 with levamisole (10 mM) onto slides with 2% agarose pads. Images were acquired on confocal microscopy (LSCM; Leica DMIRE2) with 20 x and 63 x objectives, processed by Image J FIJI software.
Subcellular DAF-16 localization
DAF-16 translocation was analyzed using strains containing the translational Pdaf-16::DAF-16a/b::GFP reporter in a wild-type or tyramine signaling mutant background (Pdaf-16::DAF-16a/b::GFP; tdc-1; Pdaf-16::DAF-16a/b::GFP; tyra-3, Pdaf-16::DAF-16a/b::GFP; tyra-3; Pelt-2::TYRA-3). Young adult animals in basal conditions or exposed to either mild (35°C, 10 min) or strong heat stress (35°C, 30 min), with or without exogenous tyramine, were mounted to analyze DAF-16 cellular distribution under a fluorescence microscope. To analyze the effects of flight response triggering in heat-mediated DAF-16 nuclearization, animals were exposed simultaneously to heat (37 C, 1 h) and either a vibrational stimulus (plate tap every 5 minutes during the heat exposure) or optogenetic activation of the RIM (5 second pulse of 470 nm light every 5 minutes in animals expressing ChR2 in the RIM, grown in the presence or absence of all-trans retinal). The number of GFP labeled nuclei per animal was quantified using Image J FIJI software and normalized to the naïve condition within the day.
Expression analysis of DAF-2/IIs target genes
hsp-16.2, sod-3 and gst-4 expression levels were analyzed in transgenic strains containing transcriptional reporters, in wild-type or tyramine signaling mutant backgrounds (see strain list). Animals were imaged using an epifluorescence microscope (Nikon Eclipse E-600) coupled to a CCD camera (Nikon K2E Apogee) and a laser spectral confocal microscope (Leica TCS SP2). Fluorescence intensity was quantified using Image J FIJI software.
H2O2-induced oxidative stress resistance
The H2O2 stress assays were performed as described47. Briefly, 50 adult worms were transferred to 35-mm plates containing 3 ml S basal supplemented with cholesterol (5 μg/ml), E. coli OP50 (2 × 10⁹ cells/ml), and freshly added H2O2 (5 mM). After 3 h of exposure to H2O2 dead animals were quantified.
Histamine and tyramine supplementation
The assays were performed as described48. Histamine-dihydrochloride (Alfa Aesar) or tyramine hydrochloride (Alfa Aesar) stocks were made with MilliQ sterile water, and diluted to 10 mM into NGM agar before pouring. Plates were stored at 4°C and used within one week after pouring. For histamine-dependent neuronal silencing, young-adult animals expressing the Drosophila histamine-gated chloride channel, HisCl, in the RIM neuron (RIM::HisCl) were exposed to 10 mM histamine 8 h prior and during the oxidation or heat stress protocol.
Molecular Biology
Standard molecular biology techniques were used. Ptyra-3::mCherry transcriptional reporter constructs were made by cloning a 3.4 kb (Ptyra-3long) or 1.8 kb (Ptyra-3short ) promoter fragment upstream of the tyra-3 start site into the pPD95.75 mCherry plasmid. These promoter fragments were also subcloned in front of the tyra-3 cDNA followed by the unc-54 3’UTR to rescue the endogenous (Neurons and intestine, Ptyra-3long promoter) or partial (Neuronal Ptyra-3 short promoter) tyra-3 expression pattern. For intestinal rescue constructs, the tyra-3 cDNA was cloned behind the intestinal elt-2 promoter. For pan-neuronal rescue constructs, tyra-3 cDNA was cloned behind the pan-neuronal rgef-1 promoter. Transgenic strains were obtained by microinjection of plasmid DNA at 20 ng/μl into the germline with co-injection marker lin-15 rescuing plasmid pL15EK (80 ng/μl) into lin-15(n765ts) mutant animals unless otherwise noted. At least three independent transgenic lines were obtained. Data are shown from a single representative line.
Pharyngeal pumping rate
Young adult worms were transferred to NMG plates seeded with E. coli OP50. The number of contractions in the terminal bulb of the pharynx was counted for 1 min using a stereomicroscope at 75 x magnification.
Data collection, availability and statistics
All the data are publicly available in Open Science Framework: https://osf.io/mj3n9/?view_only=b6c7ff8697544e71b725767f17e19628. All data are represented in a format that shows the distribution (Dot plots) and all the graph elements (median, error bars, etc) are defined in each figure legend. We did not use any software to determine sample size. For most of our experiments, and in accordance to most reports using C. elegans, we used a large number of animals per condition in each assay (typically more than 40–50 animals). This number of animals is large enough to ensure appropriate statistical power in the test used. All the statistical tests were performed after checking normality. Grubbs’test was used for outliers analysis (p<0.05). We performed the experiments at least 3–4 times to ensure reproducibility. All the animals were grown in similar conditions and the experiments were performed in different days, with different animal batches. In general, replicates were performed by different researchers. Drugs were previously controlled by analyzing a known phenotype (e.g. worm paralysis and head relaxation on 30mM tyramine ). Animals used were age-synchronized (L4 or 24h past L4).
Extended Data
Extended Data Figure 1. C. elegans faces different types of environmental stressors.
Like other animals C. elegans is exposed to different forms of stress in its environment that occur either abruptly (e.g. predation) or more progressively (food shortage, osmotic stress, oxidation, high or low environmental temperatures). Stress can induce behavioral and/or cellular responses. Stress response to environmental stressors such as heat, starvation and oxidative stress features a central role for the DAF-2/Insulin/IGF-1 signaling (IIS) pathway and the activation of DAF-16/FOXO, SKN-1/NRF and HSF-1 transcription factors. In response to acute challenges, such as touch C. elegans can engage in an escape-response where it rapidly moves away from a life-threatening stimulus.
Extended Data Figure 2. The flight response and tyramine decrease lifespan and impair resistance to stressors.
a, Oxidation and heat survival index of animals pre-exposed to different tap stimulus protocols (from 1 to 40 plate taps every 5 minutes). Data represent mean ± SEM of independent experiments. n=4 and n=3 for oxidation and heat, respectively. At least 40 animals were analyzed in each independent experiment. Repeated triggering of the flight response (>20–25 times) prior to the exposure to oxidative or heat stress reduced animal survival b, Top, Scheme for the sequential stress experiments. Pre-stressors: 1 h 1 mM Fe2+ (Oxidation: Ox), 0.5 h 35°C (Heat: °C), 8 h food deprivation (Fasting: Fst), or tap stimulus every 5 min for 2.5 h (Tap). After 1 h of recovery, survival to heat stress (4 h 35°C) was evaluated. Bottom, Representative Kaplan-Meier survival curves of pre-stressed nematodes exposed to subsequent thermal stress (heat), two sided log-rank test was used for statistical comparison. The curves are representative of three independent replicates with similar results (n=3). 40–80 animals were used per condition per experiment. c, Heat survival index in the absence and presence of exogenous tyramine (TA) during pre-exposure to the mild stressor followed by 1 h recovery and exposure to the second strong stressor in the absence of TA after pre-treatment. Data represent mean ± SEM. For 0 mM TA conditions, One-way ANOVA followed by Holm-Sidak post-hoc test versus pre-heat was used, n=4, 40–80 animals/condition. For 10 mM TA conditions, two-tailed Student’s t-test (versus same condition without TA) was used, n=3, 40–80 animals/condition. Exogenous tyramine during mild stressor exposure inhibits hormesis. d, Oxidation and heat survival index of tdc-1(n3420) mutant animals pre-exposed to the same stressors detailed in b. Data represent mean ± SEM, n=4, 40–80 animals/condition. Unlike wild-type animals, tdc-1 mutants displayed no hormetic effects after pre-treatment with mild environmental stressors e, Pre-incubation with exogenous tyramine (TA) in the absence of environmental pre-stressors did not produce significant differences in subsequent oxidative stress and thermal resistance. Animals were exposed to 10 mM of exogenous TA for 3 h. After 1 h of recovery, the resistance to heat- (4 h at 35°C) and oxidative- (2 h, 3 mM Fe2+) stress was evaluated. Bars represent the mean ± SEM of independent experiments. n=4, 80–100 animals per condition per experiment. Two-tailed Student’s t-test (versus same condition without pre-exposure to TA) was used. f, Left, Representative Kaplan-Meier survival curves of naïve and pre-stressed (tap) animals exposed to heat (35°C). The experiment was independently repeated 3 times (n=3) with similar results (35–50 animals per condition per experiment), two tailed log-rank test. Right, Survival index of naïve and pre-stressed, wild-type and tdc-1 mutant upon exposure to heat stress. Bars represent mean ± SEM, n=3, 35–50 animals/condition, two-tailed Student’s t-test. The flight response impairs survival to heat exposure in wild-type but not in tyramine-deficient mutants. g, Resistance of wild-type animals exposed to oxidation or heat in the absence and presence of exogenous tyramine (10 mM). Bars represent mean ± SEM, n=4, 60–80 animals/condition. Two-tailed Student’s t-test (versus same condition without TA) was used. Exogenous tyramine reduces oxidation and heat resistance h, Scatter dot plots (line at the mean) for: Left, Average locomotion rate of animals grown in the presence of exogenous tyramine (10 mM) for 4, 7 and 10 days. Right, Average numbers of eggs in the adult uterus (36 h post-L4s) in the presence of exogenous tyramine (10 mM, 36 h of exposure). n for each condition is indicated in figure. Two-tailed Student’s t-test (versus same condition without TA) was used. Exogenous tyramine does not significantly affect neither the locomotion nor the egg-laying, even upon extended exposure. i, Representative Kaplan-Meier lifespan curves of wild-type and tdc-1 mutant animals. Two tailed log-rank test was used. The experiment was independently repeated 3 times (n=3) with similar results (40–80 animals per condition per experiment). Tyramine-deficient animals have an increased lifespan compared to wild-type. j, Representative Kaplan-Meier lifespan curves in the absence or presence of 10 mM exogenous TA. Two tailed log-rank test was used. The curves are representative of three independent replicates with similar results (n=3). 40–80 animals were used per condition per experiment. Exogenous tyramine reduces animaĺs lifespan.
Extended Data Figure 3. Tyramine-deficient animals are resistant to environmental stress.
a, Tyramine and octopamine biosynthesis pathway. Tyramine is synthesized from tyrosine by tyrosine decarboxylase (TDC-1) in the RIM and RIC neurons; octopamine is synthesized from tyramine by tyramine β-hydroxylase (TBH-1) in the RIC neurons13While tdc-1 null mutants are deficient in both tyramine and octopamine, tbh-1 null mutants are deficient only in octopamine. b-c, Survival percentages of wild-type, tyramine/octopamine deficient (tdc-1), octopamine deficient (tbh-1) and tyramine receptor (tyra-3) null mutants exposed to oxidation induced by b, Fe2+SO4 (1 h, 15 mM) and c, H2O2 (3 h, 5 mM). Bars represent the mean ± SEM. The number of independent experiments (n) is shown in the figure. 60–80 animals per condition per experiment were used. One-way ANOVA followed by Holm-Sidak post-hoc test for multiple comparisons versus wild-type was used. d, Survival to heat (4h at 35°C) of wild-type, tdc-1, tbh-1, tdc-1; zfIs29[Ptbh-1::TDC-1] (tyramine but not octopamine deficient) and the quadruple tyramine-receptor mutant QW833 (lgc-55; ser-2; tyra-2; tyra-3). Bars represent the mean ± SEM. The number of independent experiments (n) is shown in the figure. 60–80 animals were used per condition per experiment. One-way ANOVA followed by Holm-Sidak post-hoc test for multiple comparisons was used. tdc-1 mutants have an improved survival to thermal stress. Octopamine-deficient mutants (tbh-1) were slightly more heat resistant than wild-type animals, albeit not at the level of tyramine/octopamine deficient tdc-1 mutants. Moreover, rescue of tdc-1 expression in only the octopaminergic neurons (tdc-1; Ptbh-1::TDC −1) failed to reduce thermoresistance of tdc-1 mutants. In addition, the quadruple mutants of all tyramine receptors show heat resistance levels similar to that of tdc-1. These results indicate that the lack of tyramine underlies the oxidative and thermal resistant phenotype of tdc-1 mutants. e, Scatter dot plot (line at the mean) showing pharyngeal pumping rates (pumps per minute) of wild-type, tdc-1, tbh-1 and tph-1 null mutants. tph-1 (tryptophan hydroxylase) mutant animals, which lack serotonin, have a reduced pharyngeal pumping and were used as a control. Since tdc-1 mutants have no obvious defects in pharyngeal pumping, dietary restriction is not likely to be the cause of the enhanced stress resistance and increased longevity. n=30 animals per condition. One-way ANOVA followed by Holm-Sidak post-hoc test versus wild type was used.
Extended Data Figure 4. Optogenetic activation of the flight response reduces the resistance to environmental stressors.
a, Velocity traces and survival curves during strong oxidative stress (3 mM Fe2+) for tdc-1 mutants in the absence (grey) or presence (red) of a mechanical stimulus (tap), n=7 independent experiments of 40 animals were used for each condition. Velocity remains constant over the 2.5 h duration of recording in the absence of a stimulus, but increases rapidly in response to a mechanical plate tap (top). Tap delivery does not reduce stress resistance in tdc-1 mutants (bottom) to oxidative stress. Black squares indicate timing of tap delivery. Red line: tap, grey line: no tap, shaded regions indicate SEM. b, Optogenetic activation of the mechanosensory neurons induces a flight response that results in velocity increases. Animals are exposed to 5 second pulses of 617nm light every 5 minutes (top), n=8 independent experiments. Optogenetic induction of the flight response reduces stress resistance to strong oxidation (3 mM Fe2+) (bottom). Dark blue line: survival curve of animals raised with all-trans retinal (ATR) n=10 independent experiments; Light blue line: animals raised without ATR, n=9 independent experiments, 40 animals were used for each experiment. Central lines indicate mean, shaded regions indicate SEM, blue squares indicate timing of light delivery. Strain used: QW1649 zfIs144[Pmec-4::Chrimson::wCherry, pL15EK]. c, Survival index of animals, with or without vibrational stimulus (plate tapping every 5 minutes) while being exposed to oxidative (1 h, 3 mM Fe2+) or heat stress (4 h at 35°C). Tap impaired environmental stress resistance in the wild type, but not in tdc-1 mutant animals. Bars represent the mean ± SEM from 4 independent experiments (n=4). 60–90 animals per condition per experiment. Two-tailed Student’s test was used for statistical comparison versus the wild type. d, Percentage of animals suppressing head movements in response to anterior touch in unstressed animals and animals that have been subjected to a tap stimulus every 5 minutes for 2.5 hours. Tyramine release in response to mechanical stimulation induces a fast reversal and the suppression of head movements13–14 Animals that were subjected to 30 taps administered every 5 minutes still suppress their head movements in response to anterior touch. This indicates that tyramine continues to be released during the tapping protocol and that RIM neuronal activity is not affected. Bars represent the mean ± SEM from 5 independent experiments (n =5). 20 animals per condition per experiment were used. Two tailed Student’s t-test. e, Survival curves of animals exposed to heat stress (7 h at 35°C) with simultaneous optogenetic activation of mechanosensory neurons (QW1649: zfis144[Pmec-4::Chrimson::wCherry +pL15EK]). Animals expressing Chrimson in mechanosensory neurons were cultivated in the presence or absence of all-trans retinal (ATR) and subjected to 5 second 617 nm light pulses every 5 minutes at 35°C. Blue squares indicate timing of light delivery. Central lines indicate mean, shaded regions indicate SEM. Optogenetic activation of mechanosensory neurons reduced heat resistance in animals raised on ATR (n=6 independent experiments) compared to animals raised without ATR (n=5 independent experiments), 40 animals were used for each experiment. f, Stress survival analysis of animals grown in the presence or absence of ATR without light stimulation. Oxidative stress: (Ox,1 h, 3 mM Fe2+); Heat (4 h at 35°C). ATR does not modify animal resistance to these environmental stressors. Bars represent the mean ± SEM from 3 independent experiments (n=3). 40–50 animals per condition per experiment. No significant differences were observed indicating that ATR does not affect stress resistance, two-tailed Student’s t-test. g-h, Stress survival of animals expressing the histamine-gated chloride channel HisCl in the RIM neuron (RIM::HisCl). Animals were exposed to 10 mM histamine (Hist) prior and during oxidation (1 h, 15 mM Fe2+, g) or heat (4 h, 35°C h). Specific silencing of the RIM neuron leads to increased animal resistance to environmental stress. Bars represent mean ± SEM. The numbers of independent experiments performed for each condition (n) are indicated in the figure. 80–100 animals per condition per experiment were used. Statistical comparison versus same strain in the absence of histamine was calculated using two-tailed Student’s t-test. i-j, Ca2+ responses upon oxidative-stress (i, GCaMP: n=36 animals, mCherry: n=15 animals) and food deprivation (j, GCaMP: n=30 animals, mCherry: n=6 animals). Grey trace: mCherry fluorescence insensitive to calcium. Central lines and dots indicate mean, shaded regions and error bars indicate SEM (One-way ANOVA, compared to initial time point, Dunnett’s multiple comparison). k, Overall RIM Ca2+ levels (ΔF/F) increase upon refeeding (with E. coli) of animals that have been starved overnight. Data are represented as mean ± SEM. n=36 for each data point, 6 independent experiments. Fluorescence increase is initiated within 10 minutes after food addition indicating that RIM activity quickly recovers and is likely not due to GCaMP expression changes. One-way ANOVA, compared to initial time point, Dunnett’s multiple comparison.
Extended Data Figure 5. Tyramine modulates the stress response through the activation of the GPCR TYRA-3.
a, Resistance of wild-type and tyramine receptor mutant animals exposed to heat (4 h, 35 °C). Only tyra-3 mutant animals are as resistant as tdc-1 mutant animals to heat stress. The numbers of independent experiments performed for each condition (n) are indicated in the figure. 80–100 animals per condition per experiment were used. One-way ANOVA followed by Holm-Sidak post-hoc test for multiple comparisons. b, Representative survival curves of wild-type, tdc-1 and tyra-3 mutants exposed to starvation. Animals were removed from food at the L4 stage. The curves are representative of three independent replicates with similar results (n=3). 40–80 animals were used per condition per experiment c, Resistance of wild-type, tdc-1 and tyra-3 mutant animals exposed to oxidation, heat or starvation in the absence or presence of exogenous TA (10 mM). Detrimental effects of exogenous TA on stress resistance are abolished in tyra-3 mutant animals. Bars represent mean ± SEM, n = 4 for oxidation and heat and n=3 for starvation, 60–80 animals/condition. For conditions without TA, One-way ANOVA followed by Holm-Sidak post-hoc test versus wild-type was used. For conditions with TA, two-tailed Student’s t test (versus same strain without TA) was used.
Extended Data Figure 6. tyra-3 acts in the intestine to inhibit stress resistance.
a, Top, Gene structure of tyra-3. Coding sequences are represented by black boxes. Bottom, Confocal images of transgenic animals expressing mCherry driven by a short fragment of tyra-3 promoter (short promoter, 1.8 kb upstream of start codon). mCherry expression is limited to a subset of head and tail neurons (and vulval cells). Scale bar: 200 μM. A mCherry reporter driven by a long 3.4 kb promoter (Ptyra-3long) show expression in both, neurons and intestine (see manuscript Fig 3b). b, Survival percentages of tyra-3 mutant animals expressing tyra-3 cDNA driven by Ptyra-3long (Endogenous expression), Ptyra-3short (Expression in a subset of neurons), Prgef-1 (Pan-neuronal) or Pelt-2 (Intestinal) promoter upon exposure to heat stress with or without tyramine (10 mM). Bars represent mean ± SEM, n=5, 80–100 animals/condition. For conditions without TA, One-way ANOVA followed by Holm-Sidak post-hoc test versus wild-type was used. For conditions with TA, two-tailed Student’s t test (versus same strain without TA) was used. Expression of tyra-3 in the intestine, but not in neurons, was sufficient to restore the stress sensitivity and the negative impact of exogenous tyramine on heat. c, Representative Kaplan-Meier survival curves of the wild-type, tyra-3 null mutants and animals expressing tyra-3 solely in the intestine(Pelt-2::tyra-3). Animals were food deprived as L4s in the absence or presence of 10 mM TA. The curves are representative of three independent replicates with similar results (n=3). 40–80 animals were used per condition per experiment. Two-tailed log-rank test was used for statistical comparison. Expression of tyra-3 in the intestine restores the negative impact of exogenous tyramine lifespan upon starvation d, SI to heat exposure (4 h, 35°C) of animals pre-exposed to vibrational stimulus (tapping). Intestinal expression of tyra-3 restores the detrimental effect of tapping on the stress response. Bars represent mean ± SEM, n = 3, 30–40 animals/condition. One-way ANOVA followed by Holm-Sidak post-hoc test for multiple comparisons.
Extended Data Figure 7. Tyraminergic inhibition of stress response depends on the DAF-2 insulin receptor.
a, Survival percentage of animals exposed to oxidative stress (3 h, 15 mM Fe2+) or heat (7 h, 35°C,). tdc-1; daf-2 and tyra-3; daf-2 double mutants are as resistant as daf-2 single mutant animals. Bars represent mean ± SEM, n = 3 (heat) and n=4 (oxidation), 80–100 animals per condition per experiment. One-way ANOVA followed by Holm-Sidak’s test for multiple comparisons compared to daf-2 mutants. b, Survival percentage of animals exposed to oxidative stress (3 h, 15 mM Fe2+, top) or heat (7 h, 35°C, bottom) in the absence and presence of exogenous TA (10 mM). Detrimental effect of exogenous TA heat or oxidative stress resistance is not observed in daf-2 mutant animals. Bars represent the mean ± SEM, n = 3 (heat) and n=4 (oxidation). 80–100 animals per condition per experiment. Two-tailed Student’s t-test versus each strain without TA. This indicates that tyraminergic regulation of environmental stress response depends on daf-2.
Extended Data Figure 8. The flight response inhibits stress-dependent nuclear translocation of DAF-16.
a, Left, Fluorescence images of young adults expressing the translational reporter Pdaf-16::DAF-16a/b::GFP upon exposure to mild stressors as described in Fig. 1: 1 h 1 mM Fe2+ (Oxidation: Ox), 0.5 h 35°C (Heat: °C), 8 h food deprivation (Fasting: Fst), or tap stimulus every 5 min for 2.5 h (Tap). Fluorescence images of young adults expressing the translational reporter Pdaf-16::DAF-16a/b::GFP. Right, Scatter dot plot (line at the mean) with the number of cells with nuclear DAF-16 per animal. n for each condition is indicated in the figure. One-way ANOVA, Dunnett’s post-hoc test were used compared to naïve. Scale bar: 150 μm. b, Top, DAF-16 localization in wild-type and tdc-1 mutant animals exposed to vibrational stimulus (tap every 5 minutes) upon heat exposure (37°C, 1 h). Bottom, Scatter dot plot (line at the mean) with the number of cells with nuclear DAF-16 per animal (normalized to naïve animals (left). n for each condition is indicated in the figure. Two-tailed Student’s t-test was used versus same strain without tapping. Scale bar: 150 μm. Repetitive induction of the flight response impairs DAF-16 localization to the nucleus in wild-type, but not in tdc-1 mutant animals. c, Top, DAF-16 localization upon heat exposure (37°C, 1 h) of RIM::ChR2 transgenic animals raised with or without all-trans retinal (ATR) subjected to 5 second 617 nm light pulses every 5 minutes. Bottom, Scatter dot plot (line at the mean) with the number of cells with nuclear DAF-16 per animal (normalized to ATR-treated animals). n for each condition is indicated in the figure. Two-tailed Student’s t-test was used. Scale bar: 150 μm. Repetitive optogenetic activation of the tyraminergic neuron RIM impairs DAF-16 nuclear translocation.
Extended Data Figure 9. Tyramine signaling mutants display an ectopic activation of stress response genes.
a, Left, Representative Fluorescence images (40 x magnification) of the pharynx and intestine of animals expressing Psod-3::GFP in different genetic backgrounds after 20 min of exposure to 5 mM Fe++. Scale bar: 100 μM. Right, Corresponding quantification of the fluorescence level per animal in the pharynx and intestine. Scatter dot plot (line at the mean) with the relative expression of sod-3 normalized to naïve animals. n for each condition is indicated in the figure. One-way ANOVA (Kruskal-Wallis test) and Dunn’s post-hoc test were used b, Survival percentage of animals exposed to oxidative stress (1 h, 15 mM Fe2+) or heat (4 h, 35°C). tdc-1; daf-16 and tyra-3; daf-16 double mutants were compared to the corresponding single mutants. Bars represent mean ± SEM. For oxidation resistance experiments n=6. For heat resistance experiments n=4. 80 animals per condition, per experiment. One-way ANOVA, Holm-Sidak post-hoc test was used to compare against daf-16 mutants. Two-tailed Student’s t-test was used to compare tdc-1; daf-16 and tyra-3; daf-16 double mutants with tdc-1 and tyra-3 single null mutants, respectively. tdc-1; daf-16 and tyra-3; daf-16 double mutants display intermediate resistance phenotypes. This indicates that tyraminergic control of the stress response does not depend exclusively on daf-16. c, Left, Representative Fluorescence images (20 x magnification) of young adult animals expressing Phsp16.2::GFP in different genetic backgrounds after 15 min of heat (35°C). Scale bar: 150 μM. Right, Corresponding quantification of the fluorescence level per animal in pharynx and intestine. Scatter dot plot (line at the mean) with the relative expression of Phsp16.2::GFP normalized to naïve animals. n for each condition is indicated in the figure. One-way ANOVA (Kruskal-Wallis test) and Dunn’s post-hoc test were used compared to naïve. d, Left, Representative Fluorescence images (20 x magnification) of young adult animals expressing Pgst-4::GFP in different genetic backgrounds in basal conditions (20°C on NGM plates seeded with OP50 as a food source). Scale bar: 100 μM. Right, Corresponding quantification of the fluorescence level per worm. Scatter dot plot (line at the mean) with the relative expression of Pgst-4::GFP normalized to naïve animals. n for each condition is indicated in the figure. One-way ANOVA and Dunnett’s post-hoc test were used compared to naïve. These experiments indicate that distinct DAF-2 dependent transcription factors are activated in tdc-1 and tyra-3 mutants: DAF-16/sod-3 HSF-1/hsp16.2 and SKN-1/gst-4.
Extended Data Figure 10. Tyramine’s inhibition of stress resistance requires intestinal hid-1.
Survival percentages of young adult hid-1 mutant animals expressing either the endogenous (endog. rescue), the neuronal (neu. rescue) or the intestinal (int. rescue) rescue constructs exposed to oxidation (left) or heat (4 h, 35°C) (right) in the absence or presence of 10 mM TA. Bars represent mean ± SEM from independent experiments. The number of independent experiments for each condition (n) is shown in the figure. 80–100 animals per condition per experiment were used. A Two-tailed Student’s t test (versus same strain without TA) was used. hid-1 expression in the intestine in hid-1 mutants restores the negative impact of tyramine on oxidative and heat stress resistance.
Acknowledgments:
Some strains were provided by the CGC, which is funded by NIH Office of Research Infrastructure Programs (P40 OD010440). We thank Cori Bargmann, Michael Nonet, Andrew Dillin, Heidi Tissenbaum, Dirk Albrecht, Josh Hawk, Christoph Weist, Manu Madhav, Andrea Thackeray, Claire Benard, Michael Gorczyca, Adrián Bizet and William Joyce for strains and technical support. We like to thank Andrés Garelli, Guillermo Spitzmaul, Alex Byrne, Vivian Budnik, Marian Walhout, Micah Belew, Michael Ailion and Tomer Shpilka for helpful discussions.
Funding: This work was supported by Grants from UNS (PGI: 24/B216 DR, PGI24/ZB62 MJDR), ANPCYT, (PICT 2014 3118 DR) and CONICET (PIP11220150100182CO DR-MJDR) and grant GM084491 from the National Institutes of Health (MJA).
Footnotes
Author Information: Authors declare no competing interests.
Data availability: All data files are available from the Open Science Framework database :https://osf.io/mj3n9/?view_only=b6c7ff8697544e71b725767f17e19628
REFERENCES
- 1.Cannon WB Bodily changes in pain, hunger, fear and rage, an account of recent researches into the function of emotional excitement. (New York and London, D. Appleton and Co., 1915). [Google Scholar]
- 2.Prahlad V, Cornelius T. & Morimoto RI Regulation of the cellular heat shock response in Caenorhabditis elegans by thermosensory neurons. Science 320, 811–814, doi:320/5877/811 [pii]; 10.1126/science.1156093 [doi] (2008). [DOI] [PMC free article] [PubMed] [Google Scholar]
- 3.Essers MA et al. FOXO transcription factor activation by oxidative stress mediated by the small GTPase Ral and JNK. EMBO J 23, 4802–4812, doi: 10.1038/sj.emboj.7600476 (2004). [DOI] [PMC free article] [PubMed] [Google Scholar]
- 4.Travers M, Clinchy M, Zanette L, Boonstra R. & Williams TD Indirect predator effects on clutch size and the cost of egg production. Ecol Lett 13, 980–988, doi: 10.1111/j.1461-0248.2010.01488.x (2010). [DOI] [PubMed] [Google Scholar]
- 5.Miller MW & Sadeh N. Traumatic stress, oxidative stress and post-traumatic stress disorder: neurodegeneration and the accelerated-aging hypothesis. Molecular psychiatry 19, 1156–1162, doi: 10.1038/mp.2014.111 (2014). [DOI] [PMC free article] [PubMed] [Google Scholar]
- 6.Rodriguez M, Snoek LB, De BM & Kammenga JE Worms under stress: C. elegans stress response and its relevance to complex human disease and aging. Trends Genet 29, 367–374, doi:S0168-9525(13)00022-X [pii]; 10.1016/j.tig.2013.01.010 [doi] (2013). [DOI] [PubMed] [Google Scholar]
- 7.Chalfie M. et al. The neural circuit for touch sensitivity in Caenorhabditis elegans. J. Neurosci 5, 956–964 (1985). [DOI] [PMC free article] [PubMed] [Google Scholar]
- 8.Wicks SR & Rankin CH Integration of mechanosensory stimuli in Caenorhabditis elegans. J Neurosci 15, 2434–2444 (1995). [DOI] [PMC free article] [PubMed] [Google Scholar]
- 9.Calabrese EJ Stress biology and hormesis: the Yerkes-Dodson law in psychology--a special case of the hormesis dose response. Critical reviews in toxicology 38, 453–462, doi: 10.1080/10408440802004007 (2008). [DOI] [PubMed] [Google Scholar]
- 10.Cypser JR & Johnson TE Multiple stressors in Caenorhabditis elegans induce stress hormesis and extended longevity. J Gerontol A Biol Sci Med Sci 57, B109–114, doi: 10.1093/gerona/57.3.b109 (2002). [DOI] [PubMed] [Google Scholar]
- 11.Kumsta C, Chang JT, Schmalz J. & Hansen M. Hormetic heat stress and HSF-1 induce autophagy to improve survival and proteostasis in C. elegans. Nat Commun 8, 14337, doi: 10.1038/ncomms14337 (2017). [DOI] [PMC free article] [PubMed] [Google Scholar]
- 12.Rattan SI & Ali RE Hormetic prevention of molecular damage during cellular aging of human skin fibroblasts and keratinocytes. Annals of the New York Academy of Sciences 1100, 424–430, doi: 10.1196/annals.1395.047 (2007). [DOI] [PubMed] [Google Scholar]
- 13.Alkema MJ, Hunter-Ensor M, Ringstad N. & Horvitz HR Tyramine Functions independently of octopamine in the Caenorhabditis elegans nervous system. Neuron 46, 247–260, doi:S0896-6273(05)00167-4 [pii]; 10.1016/j.neuron.2005.02.024 [doi] (2005). [DOI] [PubMed] [Google Scholar]
- 14.Pirri JK, McPherson AD, Donnelly JL, Francis MM & Alkema MJ A tyramine-gated chloride channel coordinates distinct motor programs of a Caenorhabditis elegans escape response. Neuron 62, 526–538, doi:S0896-6273(09)00294-3 [pii]; 10.1016/j.neuron.2009.04.013 [doi] (2009). [DOI] [PMC free article] [PubMed] [Google Scholar]
- 15.Maguire SM, Clark CM, Nunnari J, Pirri JK & Alkema MJ The C. elegans touch response facilitates escape from predacious fungi. Curr. Biol 21, 1326–1330, doi:S0960-9822(11)00769-X [pii]; 10.1016/j.cub.2011.06.063 [doi] (2011). [DOI] [PMC free article] [PubMed] [Google Scholar]
- 16.Kagawa-Nagamura Y, Gengyo-Ando K, Ohkura M. & Nakai J. Role of tyramine in calcium dynamics of GABAergic neurons and escape behavior in Caenorhabditis elegans. Zoological Lett 4, 19, doi: 10.1186/s40851-018-0103-1 (2018). [DOI] [PMC free article] [PubMed] [Google Scholar]
- 17.Zheng M, Cao P, Yang J, Xu XZ & Feng Z. Calcium imaging of multiple neurons in freely behaving C. elegans. J Neurosci Methods 206, 78–82, doi: 10.1016/j.jneumeth.2012.01.002 (2012). [DOI] [PMC free article] [PubMed] [Google Scholar]
- 18.Komuniecki RW, Hobson RJ, Rex EB, Hapiak VM & Komuniecki PR Biogenic amine receptors in parasitic nematodes: what can be learned from Caenorhabditis elegans? Mol. Biochem. Parasitol 137, 1–11, doi: 10.1016/j.molbiopara.2004.05.010 [doi];S0166685104001549 [pii] (2004). [DOI] [PubMed] [Google Scholar]
- 19.Tsalik EL et al. LIM homeobox gene-dependent expression of biogenic amine receptors in restricted regions of the C. elegans nervous system. Dev. Biol 263, 81–102, doi:S0012160603004470 [pii] (2003). [DOI] [PMC free article] [PubMed] [Google Scholar]
- 20.Wragg RT et al. Tyramine and octopamine independently inhibit serotonin-stimulated aversive behaviors in Caenorhabditis elegans through two novel amine receptors. J. Neurosci 27, 13402–13412, doi:27/49/13402 [pii]; 10.1523/JNEUROSCI.3495-07.2007 [doi] (2007). [DOI] [PMC free article] [PubMed] [Google Scholar]
- 21.Henderson ST & Johnson TE daf-16 integrates developmental and environmental inputs to mediate aging in the nematode Caenorhabditis elegans. Current biology : CB 11, 1975–1980 (2001). [DOI] [PubMed] [Google Scholar]
- 22.Fontana L, Partridge L. & Longo VD Extending healthy life span--from yeast to humans. Science 328, 321–326, doi: 10.1126/science.1172539 (2010). [DOI] [PMC free article] [PubMed] [Google Scholar]
- 23.Arantes-Oliveira N, Berman JR & Kenyon C. Healthy animals with extreme longevity. Science 302, 611, doi: 10.1126/science.1089169 [doi];302/5645/611 [pii] (2003). [DOI] [PubMed] [Google Scholar]
- 24.Chiang WC, Ching TT, Lee HC, Mousigian C. & Hsu AL HSF-1 regulators DDL-1/2 link insulin-like signaling to heat-shock responses and modulation of longevity. Cell 148, 322–334, doi:S0092-8674(11)01572-8 [pii]; 10.1016/j.cell.2011.12.019 [doi] (2012). [DOI] [PMC free article] [PubMed] [Google Scholar]
- 25.Mesa R. et al. HID-1, a new component of the peptidergic signaling pathway. Genetics 187, 467–483, doi: 10.1534/genetics.110.121996 (2011). [DOI] [PMC free article] [PubMed] [Google Scholar]
- 26.Du W. et al. HID-1 is required for homotypic fusion of immature secretory granules during maturation. Elife 5, doi: 10.7554/eLife.18134 (2016). [DOI] [PMC free article] [PubMed] [Google Scholar]
- 27.Hawlena D. & Schmitz OJ Herbivore physiological response to predation risk and implications for ecosystem nutrient dynamics. Proc Natl Acad Sci U S A 107, 15503–15507, doi: 10.1073/pnas.1009300107 (2010). [DOI] [PMC free article] [PubMed] [Google Scholar]
- 28.Rabasa C & Dickson S. Impact of stress on metabolism and energy balance. Current Opinion in behavioral Sciences 9, 71–77 (2016). [Google Scholar]
- 29.Van Voorhies WA & Ward S. Genetic and environmental conditions that increase longevity in Caenorhabditis elegans decrease metabolic rate. Proc Natl Acad Sci U S A 96, 11399–11403 (1999). [DOI] [PMC free article] [PubMed] [Google Scholar]
- 30.Lee I, Hendrix A, Kim J, Yoshimoto J. & You YJ Metabolic rate regulates L1 longevity in C. elegans. PLoS One 7, e44720, doi: 10.1371/journal.pone.0044720 (2012). [DOI] [PMC free article] [PubMed] [Google Scholar]
Methods References
- 31.Brenner S. The genetics of Caenorhabditis elegans. Genetics 77, 71–94 (1974). [DOI] [PMC free article] [PubMed] [Google Scholar]
- 32.Stiernagle T. Maintenance of C. elegans. WormBook, 1–11, doi: 10.1895/wormbook.1.101.1 [doi] (2006). [DOI] [PMC free article] [PubMed] [Google Scholar]
- 33.Jin X, Pokala N. & Bargmann CI Distinct Circuits for the Formation and Retrieval of an Imprinted Olfactory Memory. Cell 164, 632–643, doi: 10.1016/j.cell.2016.01.007 (2016). [DOI] [PMC free article] [PubMed] [Google Scholar]
- 34.Mesa R. et al. HID-1, a new component of the peptidergic signaling pathway. Genetics 187, 467–483, doi: 10.1534/genetics.110.121996 (2011). [DOI] [PMC free article] [PubMed] [Google Scholar]
- 35.Prahlad V, Cornelius T. & Morimoto RI Regulation of the cellular heat shock response in Caenorhabditis elegans by thermosensory neurons. Science 320, 811–814, doi:320/5877/811 [pii]; 10.1126/science.1156093 [doi] (2008). [DOI] [PMC free article] [PubMed] [Google Scholar]
- 36.Wicks SR & Rankin CH Integration of mechanosensory stimuli in Caenorhabditis elegans. J Neurosci 15, 2434–2444 (1995). [DOI] [PMC free article] [PubMed] [Google Scholar]
- 37.Alkema MJ, Hunter-Ensor M, Ringstad N. & Horvitz HR Tyramine Functions independently of octopamine in the Caenorhabditis elegans nervous system. Neuron 46, 247–260, doi:S0896-6273(05)00167-4 [pii]; 10.1016/j.neuron.2005.02.024 [doi] (2005). [DOI] [PubMed] [Google Scholar]
- 38.Pirri JK, McPherson AD, Donnelly JL, Francis MM & Alkema MJ A tyramine-gated chloride channel coordinates distinct motor programs of a Caenorhabditis elegans escape response. Neuron 62, 526–538, doi:S0896-6273(09)00294-3 [pii]; 10.1016/j.neuron.2009.04.013 [doi] (2009). [DOI] [PMC free article] [PubMed] [Google Scholar]
- 39.Lionaki E. & Tavernarakis N. Assessing aging and senescent decline in Caenorhabditis elegans: cohort survival analysis. Methods Mol Biol 965, 473–484, doi: 10.1007/978-1-62703-239-1_31 (2013). [DOI] [PubMed] [Google Scholar]
- 40.Kenyon C, Chang J, Gensch E, Rudner A. & Tabtiang R. A C. elegans mutant that lives twice as long as wild type. Nature 366, 461–464, doi: 10.1038/366461a0 [doi] (1993). [DOI] [PubMed] [Google Scholar]
- 41.Dorman JB, Albinder B, Shroyer T. & Kenyon C. The age-1 and daf-2 genes function in a common pathway to control the lifespan of Caenorhabditis elegans. Genetics 141, 1399–1406 (1995). [DOI] [PMC free article] [PubMed] [Google Scholar]
- 42.Chun L. et al. Metabotropic GABA signalling modulates longevity in C. elegans. Nat Commun 6, 8828, doi: 10.1038/ncomms9828 (2015). [DOI] [PMC free article] [PubMed] [Google Scholar]
- 43.Swierczek NA, Giles AC, Rankin CH & Kerr RA High-throughput behavioral analysis in C. elegans. Nat Methods 8, 592–598, doi: 10.1038/nmeth.1625 (2011). [DOI] [PMC free article] [PubMed] [Google Scholar]
- 44.Yemini E, Kerr RA & Schafer WR Tracking movement behavior of multiple worms on food. Cold Spring Harb. Protoc 2011, 1483–1487, doi:2011/12/pdb.prot067025 [pii]; 10.1101/pdb.prot067025 [doi] (2011). [DOI] [PMC free article] [PubMed] [Google Scholar]
- 45.Edelstein AD et al. Advanced methods of microscope control using muManager software. J Biol Methods 1, doi: 10.14440/jbm.2014.36 (2014). [DOI] [PMC free article] [PubMed] [Google Scholar]
- 46.Hawk JD et al. Integration of Plasticity Mechanisms within a Single Sensory Neuron of C. elegans Actuates a Memory. Neuron 97, 356–367 e354, doi: 10.1016/j.neuron.2017.12.027 (2018). [DOI] [PMC free article] [PubMed] [Google Scholar]
- 47.Ayyadevara S. et al. Lifespan and stress resistance of Caenorhabditis elegans are increased by expression of glutathione transferases capable of metabolizing the lipid peroxidation product 4-hydroxynonenal. Aging Cell 4, 257–271, doi: 10.1111/j.1474-9726.2005.00168.x (2005). [DOI] [PubMed] [Google Scholar]
- 48.Pokala N, Liu Q, Gordus A. & Bargmann CI Inducible and titratable silencing of Caenorhabditis elegans neurons in vivo with histamine-gated chloride channels. Proc. Natl. Acad. Sci. U. S. A 111, 2770–2775, doi:1400615111 [pii]; 10.1073/pnas.1400615111 [doi] (2014). [DOI] [PMC free article] [PubMed] [Google Scholar]


