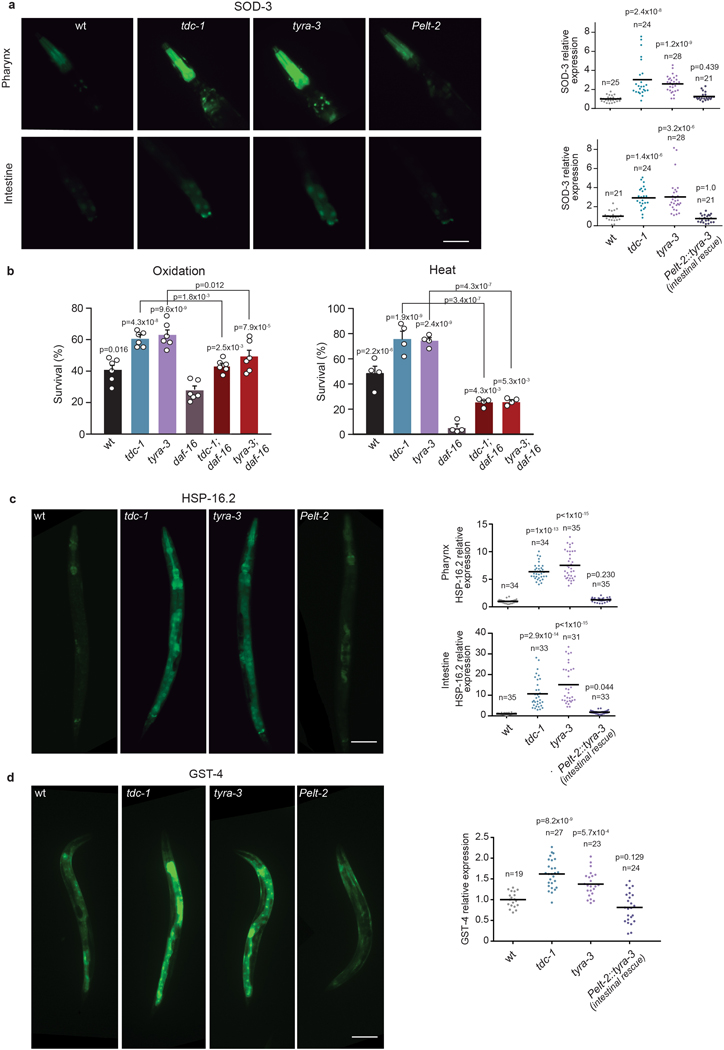
Extended Data Figure 9. Tyramine signaling mutants display an ectopic activation of stress response genes.
a, Left, Representative Fluorescence images (40 x magnification) of the pharynx and intestine of animals expressing Psod-3::GFP in different genetic backgrounds after 20 min of exposure to 5 mM Fe++. Scale bar: 100 μM. Right, Corresponding quantification of the fluorescence level per animal in the pharynx and intestine. Scatter dot plot (line at the mean) with the relative expression of sod-3 normalized to naïve animals. n for each condition is indicated in the figure. One-way ANOVA (Kruskal-Wallis test) and Dunn’s post-hoc test were used b, Survival percentage of animals exposed to oxidative stress (1 h, 15 mM Fe2+) or heat (4 h, 35°C). tdc-1; daf-16 and tyra-3; daf-16 double mutants were compared to the corresponding single mutants. Bars represent mean ± SEM. For oxidation resistance experiments n=6. For heat resistance experiments n=4. 80 animals per condition, per experiment. One-way ANOVA, Holm-Sidak post-hoc test was used to compare against daf-16 mutants. Two-tailed Student’s t-test was used to compare tdc-1; daf-16 and tyra-3; daf-16 double mutants with tdc-1 and tyra-3 single null mutants, respectively. tdc-1; daf-16 and tyra-3; daf-16 double mutants display intermediate resistance phenotypes. This indicates that tyraminergic control of the stress response does not depend exclusively on daf-16. c, Left, Representative Fluorescence images (20 x magnification) of young adult animals expressing Phsp16.2::GFP in different genetic backgrounds after 15 min of heat (35°C). Scale bar: 150 μM. Right, Corresponding quantification of the fluorescence level per animal in pharynx and intestine. Scatter dot plot (line at the mean) with the relative expression of Phsp16.2::GFP normalized to naïve animals. n for each condition is indicated in the figure. One-way ANOVA (Kruskal-Wallis test) and Dunn’s post-hoc test were used compared to naïve. d, Left, Representative Fluorescence images (20 x magnification) of young adult animals expressing Pgst-4::GFP in different genetic backgrounds in basal conditions (20°C on NGM plates seeded with OP50 as a food source). Scale bar: 100 μM. Right, Corresponding quantification of the fluorescence level per worm. Scatter dot plot (line at the mean) with the relative expression of Pgst-4::GFP normalized to naïve animals. n for each condition is indicated in the figure. One-way ANOVA and Dunnett’s post-hoc test were used compared to naïve. These experiments indicate that distinct DAF-2 dependent transcription factors are activated in tdc-1 and tyra-3 mutants: DAF-16/sod-3 HSF-1/hsp16.2 and SKN-1/gst-4.

