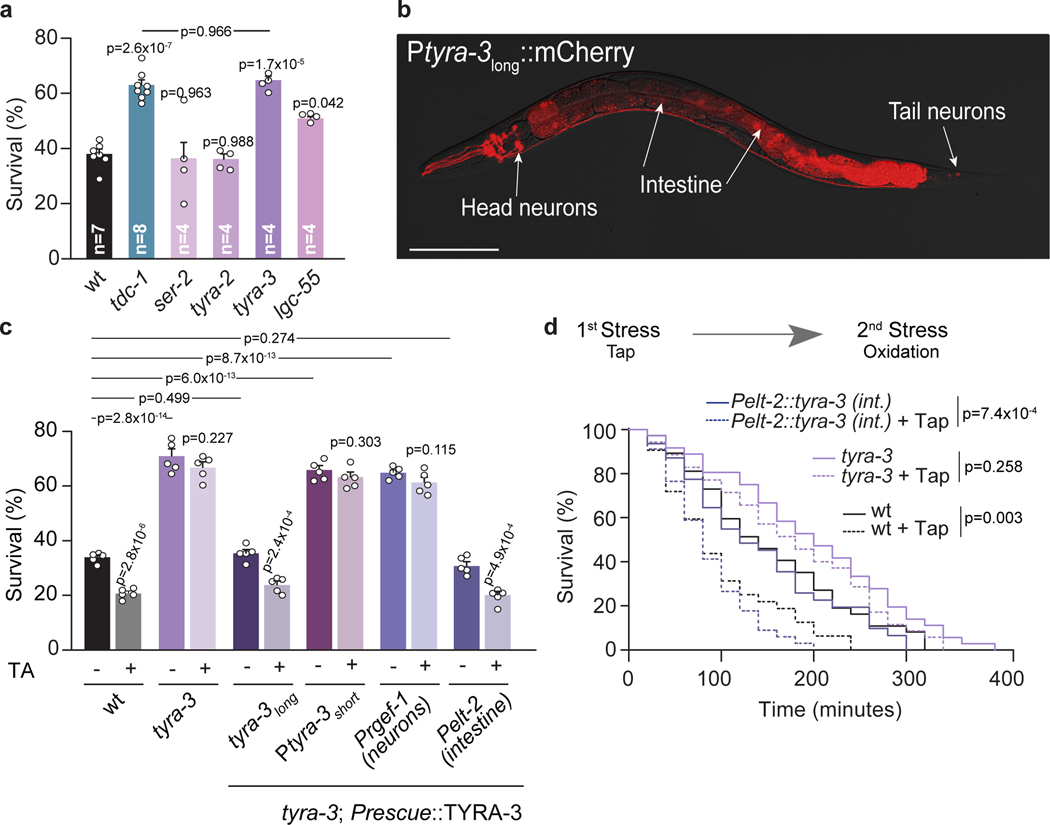
Figure 3. The GPCR TYRA-3 is required in the intestine for tyraminergic modulation of the stress response.
a, Resistance of tyramine receptor mutants exposed to oxidation (mean ± SEM, for each condition n is indicated in the figure, 40–60 worms per condition per experiment). One-way ANOVA, Holm-Sidak’s post-hoc test for multiple comparisons was used. b, Expression of a 3.4 kb Ptyra-3long::mCherry reporter. Scale bar: 150 μm. c, Survival percentages (mean ± SEM, n=5) of tyra-3 mutant animals expressing a tyra-3 cDNA driven by Ptyra-3long (Endogenous), Ptyra-3short (Neuronal subset), Prgef-1 (Pan-neuronal) or Pelt-2 (Intestinal) promoter upon exposure to oxidative stress, with or without tyramine (10 mM). For conditions without TA, One-way ANOVA, Holm-Sidak’s post-hoc test versus wild type was used. Two-tailed t test was used for comparison within each strain (no TA vs TA). d, Representative survival curves of naïve (solid line) or pre-tapped animals (dashed line) exposed to oxidation (two-sided log-rank). The experiment was independently repeated 3 times (n=3) with similar results.

