

Abstract
The study of phenotypic variation patterns among populations is fundamental to elucidate the drivers of evolutionary processes. Empirical evidence that supports ongoing genetic divergence associated with phenotypic variation remains very limited for marine species where larval dispersal is a common homogenizing force. We present a genome‐wide analysis of a marine fish, Labrus bergylta, comprising 144 samples distributed from Norway to Spain, a large geographical area that harbours a gradient of phenotypic differentiation. We analysed 39,602 biallelic single nucleotide polymorphisms and found a clear latitudinal gradient of genomic differentiation strongly correlated with the variation in phenotypic morph frequencies observed across the North Atlantic. We also detected a strong association between the latitude and the number of loci that appear to be under divergent selection, which increased with differences in coloration but not with overall genetic differentiation. Our results demonstrate that strong reproductive isolation is occurring between sympatric colour morphs of L. bergylta found at the southern areas and provide important new insights into the genomic changes shaping early stages of differentiation that might precede speciation with gene flow.
Keywords: assortative mating, colour vision, gradient of phenotypic and genomic differentiation, partial reproductive isolation
1. INTRODUCTION
The formation of new species involves the evolution of reproductive isolation between populations, a complex and continuous process that gives rise to biodiversity. Despite extensive studies, the nature and time course of the genetic changes underlying speciation remain unclear, especially during early stages (Ravinet et al., 2017; Via, 2009). To date, the majority of studies analysing the genetic basis of speciation have involved retrospective approaches, whereby the mechanisms of speciation were reconstructed retroactively after the speciation process was completed (Via, 2009). Early stages of genomic differentiation provide rare windows into early barriers to gene flow that precede speciation, and represent excellent opportunities to detect genomic elements that may be under divergent selection, before these are overwritten as the process evolves (White et al., 2020). The analysis of partially reproductively isolated morphotypes can contribute to disentangle genetic changes contributing to reproductive isolation from genetic differences between species that accumulate after speciation is complete.
Current knowledge of the patterns and processes of species origin is heavily biased toward terrestrial and freshwater species (Miglietta et al., 2011). Insights into speciation remain a critical knowledge gap in the marine environment, where data are scarce and practically restricted to adaptation to new ecological settings (for example: spawning depth (Momigliano et al., 2017); depth distribution of nests, nest site substrate and timing of reproduction (Crow et al., 2010); shifts in coral habitats (Munday et al., 2004); and life‐history differences (Puritz et al., 2012)). Nonetheless, speciation can still proceed in the face of gene flow in the absence of absolute physical isolation barriers, not only as a by‐product of local adaptation but also driven by a morphological trait under divergent selection, for example body colour pattern (Elmer et al., 2009; Puebla, 2009; Puebla et al., 2007, reviewed in Servedio et al., 2011).
Colour polymorphism in fish is well documented, but the selective forces allowing the phenotypic diversity to persist within populations remain poorly understood. The hypothesis that colour polymorphism can act as a precursor to speciation has recently gained momentum (McLean & Stuart‐Fox, 2014); however, partial reproductive isolation does not always lead to complete speciation but might instead be maintained as intermediate stages along the speciation continuum for millions of years (Seehausen et al., 2014).
Experimental evidence of mate choice being driven by visual cues has been gathered for a handful of species that mate assortatively based on coloration patterns such as hamlets or cichlids (Domeier, 1994; Puebla et al., 2007, 2012; Salzburger et al., 2006; Seehausen, 1997). In some of these well‐studied species, genetic variability on key‐site amino acids known to tune spectral sensitivity of visual pigment (opsin) genes that mediate vision has been associated with mating preferences (Hench et al., 2019; Kamijo et al., 2018; Seehausen et al., 2008; Terai et al., 2006). However, it is uncertain whether divergence in this set of genes is general among fishes that display assortative mating with respect to variation in coloration, and whether this group of genes is associated with a reduction in levels of gene flow (Nosil et al., 2009). Moreover, important questions about the genomic architecture of speciation in the face of gene flow remain. Two hypotheses that represent the ends of a continuum are currently supported by different studies (reviewed by Nosil & Feder, 2012). Some recent speciation events seem to be characterized by highly differentiated genomic regions that are strongly clustered (called “genomic islands”) (Malinsky et al., 2015; Puebla et al., 2014) whereas other studies report a widely scattered differentiation across the genome (Michel et al., 2010; Seehausen et al., 2014).
Colour polymorphism is frequent in labroids and can occur both as sexual dichromatism or as sex‐independent variation. The former is widespread in polygamous wrasses although the Ballan wrasse (Labrus bergylta), a temperate protogynous hermaphrodite with territorial males that engage in elaborate courtships with several females, displays the second (Darwall et al., 1992). L. bergylta occurs throughout coastal waters along the eastern Atlantic from Morocco to Norway, including Madeira, the Azores and the Canary Islands (Quignard & Pras, 1986). This teleost is characterized by a highly variable colour pattern (Costello, 1991; Villegas‐Ríos, Alonso‐Fernández, Fabeiro, et al., 2013) and vast differences in the relative abundance of conspecific colour variants throughout its distribution range. In the Spanish coast, only the two extremes of this colour polymorphism coexist in sympatry. No intermediate phenotypes are found in these latitudes and the two ends of this phenotype—namely plain and spotted—are even named differently by local fishermen and sold separately (Villegas‐Ríos, Alonso‐Fernández, Fabeiro, et al., 2013). Intermediate morphotypes can be found in increasing frequency northwards. In the northernmost areas, intermediate phenotypes dominate, and “pure” plain or spotted morphs are extremely rare.
Major differences in the life‐history traits and demography between both colour morphs from NW Spain have been described, with spotted individuals attaining larger sizes at age, investing fewer resources in reproduction, and changing sex at larger sizes and older ages than plain individuals (Villegas‐Ríos et al., 2014; Villegas‐Ríos, Alonso‐Fernández, Domínguez‐Petit, et al., 2013; Villegas‐Ríos, Alonso‐Fernández, Fabeiro, et al., 2013). Several mechanisms can explain the persistence of both colour morphs, including nonrandom mating or frequency‐dependent selection by predation, among others. Still, based on our field observations, we hypothesize that plain and spotted morphotypes mate assortatively along coastal NW Spanish waters.
Previous multilocus genetic analysis (18S, COI, control region, S7) failed to reveal consistent differences between the two colour morphs (Almada et al., 2016, 2017) while microsatellites showed significant but low levels of genetic differentiation between spotted and plain individuals with only a small percentage of the variation explained by the morphotype (Quintela et al., 2016). High‐throughput genomic approaches provide a higher resolution to unravel genomic differences between potentially nascent species, often minimally diverged from a genomic perspective, offering a unique opportunity to shed light on early barriers to gene flow and its underlying mechanisms (Seehausen et al., 2014).
Genome scans carried out on a genome‐wide scale can reveal regions of genomic divergence between populations in the early stages of speciation, both in sympatry and in allopatry, even in the face of gene flow (Wolf et al., 2010). Here, we explore the genomic structure of a geographically variable colour polymorphism using L. bergylta as a case study. The geographical context harbours sympatric (plain‐spotted), parapatric (separate locations within a putative population; Vigo [Spain] and Malpica [Spain]) and allopatric populations that together with the presence of different degrees of differentiation across the distribution range provide the necessary preconditions to test if genomic differentiation is associated with colour differences.
We use restriction‐site‐associated DNA sequencing (RAD‐seq) to scan the genome of individuals displaying plain, spotted and intermediate colour morphs sampled in eight locations across the North Atlantic displaying a phenotypic variation continuum. RAD‐seq can finely characterize genetic variation at tens of thousands of loci across the genome (Hohenlohe et al., 2010; Keller et al., 2013) and detect genomic elements that may be under divergent selection. We assess if genomic patterns of differentiation correlate with phenotypic variation in coloration across the distribution range of L. bergylta. We also use this genomic data set to evaluate different scenarios potentially leading to the latitudinal degree of differentiation observed. Moreover, we evaluate if there are genetic differences between colour morphs in 10 opsin genes, key components of the visual system, since a strong coupling between vision and pigmentation genes would be indicative of assortative colour mating as a mechanism driving the observed reproductive isolation.
2. MATERIAL AND METHODS
2.1. Ethics statement
Samples from Spanish and Norwegian waters were collected from local fishers. Specimens from France were sampled from seven commercial fishing vessels (ENEZ C, Enfant du vent, Mariva, L'Espoir, Aelnol, Vizaya and Christalou). Irish samples were obtained from sport fishers under individual recreational fishing permits. The described scientific sampling did not require ethical permission according to the applicable international, EU and national laws.
2.2. Sampling strategy
A total of 150 samples were collected from five regions across eight locations (Figure 1b; Table S1): Spain (Vigo), Spain (Malpica), France (Camaret, Concarneau, Lorient), Ireland (Dunmore East) and Norway (Flodevigen, Grimstad) spanning nearly the entire distribution range of the ballan wrasse in the North Atlantic. Due to the strong sedentary behaviour and very small home range displayed by the ballan wrasse (Villegas‐Ríos, Alós, et al., 2013), the two populations sampled at both southernmost locations (Vigo and Malpica; ~120 km apart) were analysed separately, to account for potential parapatry. All other specimens from geographical locations separated by distances less than 100 km (three French and two Norwegian sites, respectively) were grouped and analysed together to reveal broad latitudinal differentiation patterns rather than local differences.
FIGURE 1.
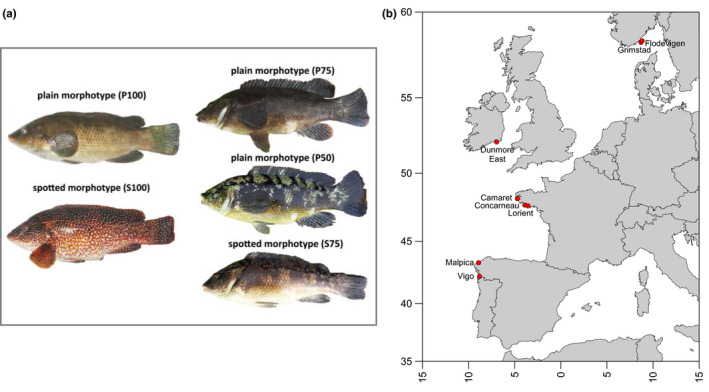
Colour morphs and geographical origin of the specimens of Labrus bergylta analysed in this study. (a) L. bergylta colour morphs: on the left, “pure” plain and spotted patterns, with a colour index of 100; on the right plain and spotted morphs with different colour indexes: the top individual corresponds to plain 75 where the body is plain and the fins display a spotted pattern; the middle specimen is plain 50 where half of the body shows a plain pattern and the fins, head and superior lateral line correspond to a spotted pattern; the bottom specimen corresponds to a spotted 75 where the phenotype is spotted in all regions except the belly. (b) Map showing the sampling sites of the specimens of L. bergylta analysed in this study [Colour figure can be viewed at wileyonlinelibrary.com]
Overall, all specimens were photographed and classified as spotted or plain. Individuals were categorized as spotted (S) if they displayed clear white spots around all or most of their body. Plain individuals (P) were those that lacked this coloration pattern (Figure 1a; Table S1). In Spain, both colour morphs are conspicuous, fish with intermediate colorations are absent, and the two are landed separately. Therefore, a balanced number of both was collected at Vigo and Malpica. In the other three regions (France, Ireland and Norway), this dichotomy in pigmentation dissipates and colour morphs are landed together (see Figure 1a), so sampling consisted of collecting all landed fish and assigning the morph during processing. One specimen from France and 18 from Norway could not be classified with full certainty into one of these two categories. To maximize sample size and account for this uncertainty when assigning specimens to either colour category, specimens were additionally assigned a colour index. The purpose of this was to fine‐tune the classification and provide the reader with a simple guide of the distribution of colour assignation incertitude among our samples. Thus, the sample codes include the letters P and S to indicate the dominant phenotype (plain and spotted respectively), followed by a number that corresponds to the approximate percentage of the body dominated by that particular phenotype (e.g., P75 indicates that plain morphotype dominates ~75% of the body). For the principal components and clustering analyses only, specimens that were not assigned to P100 or S100 were grouped as intermediate (I) to facilitate visualization. Fish specimens were fin‐clipped and preserved in 99% ethanol (Ambion) until DNA extraction.
2.3. RAD library construction and sequencing
Genomic DNA of specimens was extracted from the preserved fin clips using a DNeasy Blood & Tissue Kit (Qiagen). The quality and concentration of genomic DNA were checked using a Bioanalyzer 2100 (Agilent) and a Qubit fluorometer (Invitrogen) before library creation.
Approximately 1 μg of purified DNA per sample was processed to obtain four RAD libraries, two of them including 45 individuals and the remaining two 30 individuals. Genomic DNA from each individual was digested at 37°C for 15 min with the restriction endonuclease SphI (GCATG|C recognition site) (NEB). Modified Illumina adapters containing five nucleotides of barcode sequence unique (P1 adapters) to an individual in the library were ligated with T4 DNA ligase (NEB) to allow sample multiplexing. Ligation reactions were cleaned using the Agentcourt AMPure XP system (Beckman Coulter), followed by two rounds of purification in 80% ethanol. Each sample was quantified again using a Qubit fluorometer (Invitrogen) before sample multiplexing. The pooled samples were then sheared using a Covaris S‐Series ultrasonicator and size‐selected to isolate DNA fragments spanning 300–500 bp by agarose gel electrophoresis. The Zymoclean Large Fragment DNA Recovery Kit (Zymo Research) was used to purify and recover the DNA from the gel following the manufacturer's instructions. The NEBNext Ultra DNA II Library Prep Kit (Illumina) was then used for end repair and dA‐tailing, followed by the P2 adaptor ligation step to enable selective PCR (polymerase chain reaction). The reactions were then purified with a QIAquick column (Qiagen).
The samples were amplified using the NEBNext DNA Library Prep Master Mix Set by 10 cycles of PCR following a scaled‐down version of the manufacturer's protocol. Next, the samples were purified by agarose gel electrophoresis followed by cleaning with the Zymoclean Large Fragment DNA Recovery Kit (Zymo Research) to obtain the sequencing libraries. The obtained RAD libraries were sequenced on six lanes on a HiSeq2000 platform (Illumina) in 100‐bp paired reads, at the KAUST Bioscience Core Laboratory.
2.4. Single nucleotide polymorphism (SNP) genotyping
Raw reads were analysed in stacks 2.0 (Catchen et al., 2011). We used the “process_radtags” program to demultiplex, filter and trim to a common 95‐bp length. Retained reads from all samples were analysed for building loci and calling SNPs de novo using the “denovo_map.pl” pipeline. The parameters used were those by default except that we increased the number of mismatches between stacks within individuals to 4 (‐M flag). The number of mismatches between stacks to build a locus in the catalogue was set to 4 (‐n flag) following guidelines in Paris et al. (2017), and allowed for the inclusion of paired‐end data in the gstacks module. These values of the ‐M and‐n parameters were chosen as the best combination based on exploratory runs that evaluated combinations of ‐M (1–8) and ‐n (1–8) performed with a subset of the data set. Finally, data were filtered using the “populations” module. We only kept loci that were present in all geographical locations, and at least in 90% of samples within each one of them. We also kept loci with a maximum observed heterozygosity of 0.6 and minimum allele frequency of 0.05. We randomly selected only one SNP within each RAD locus to avoid spurious linkage disequilibrium of SNPs found in the same locus. The final SNP genotype matrix was exported as a VCF file. The “populations” module was also used to estimate population‐level summary statistics, including observed and expected heterozygosities, genetic diversity (π), and F statistics.
2.5. Inferring population genetic structure
2.5.1. Principal components analysis
Genetic relationships among all individuals were characterized by principal component analysis (PCA) of the genotype covariance matrix. The structure of genetic diversity across all samples was summarized using the “glPca” function of the R package adegenet (Jombart et al., 2010).
2.5.2. Clustering analysis
To further characterize genetic structure across sampling sites we used the Sparse Non‐Negative Matrix Factorization (sNMF) algorithm implemented in lea (R package for Landscape and Ecological Associations studies) (Frichot & François, 2015). Briefly, sNMF estimates individual admixture coefficients based on sparse non‐negative matrix factorization algorithms (Frichot et al., 2014). We first run the sNMF algorithm for values of K from 1 to 12 with four different values of alpha (a regularization parameter): 1, 10, 100 and 1000. A value of alpha = 10 produced the lowest cross‐entropy scores for all values of K (Figure S1) and was thus used to estimate individual ancestries. All other parameters were left at their default values (tolerance = 0.00001, percentage of masked genotypes = 0.05, iterations = 200).
2.6. Estimating phylogeny and population history
We conducted a phylogenetic analysis based on the consensus sequences consisting of all concatenated variant sites exported in phylip format. Maximum likelihood analyses were performed with iqtree 1.6.10. First, we ran a model selection procedure with SNP ascertainment bias correction. Then we searched for the best tree using 1000 ultrafast bootstrap replicates and 10,000 iterations (Hoang et al., 2018; Kalyaanamoorthy et al., 2017; Nguyen et al., 2015). The SYM+ASC+G4 model of sequence evolution was selected according to the Bayesian information criterion (BIC) and Akaike criterion.
We built a population tree to examine the population history and infer patterns of genetic admixture among plain and spotted specimens from the five regions using the program treemix version 1.13 (Pickrell & Pritchard, 2012) allowing for the inclusion of both divergence and gene flow. We tested if a simple bifurcating population tree could explain the observed genetic variation in the data (the amount of genetic drift that explains the divergence among populations), or if additional migration events improved the fit of the model to the data. To this end, we first built a maximum‐likelihood tree for all 10 samples assuming that all SNPs were independent (we did this because the available reference genome to map our SNP data is highly fragmented and because we used only one SNP per locus). We set the Norwegian populations as the root of the tree because sequence data (Almada et al., 2017; D'Arcy et al., 2013) suggest that Norwegian haplotypes are the most ancestral when other labrids are used as outgroups (data not shown). The confidence of the topology of the tree was assessed with the bootstrap option (resampling blocks of 500 SNPs). We then built trees with a different number of migration events (one to nine) and evaluated the amount of variance explained for each addition (estimated using the R script that is provided with treemix). Three‐population tests implemented in treemix were then used to explore the robustness of the inferred migration events (Reich et al., 2009).
2.7. Screening for loci under positive selection
We tested for the presence of loci that exhibited deviations from neutral expectations. We did this by performing pairwise comparisons of all 10 samples (five regions [Vigo, Malpica, France, Ireland, and Norway] and two morphotypes per locality [plain and spotted]) using two independent approaches. First, we used the R package outflank (Whitlock & Lotterhos, 2015). This package uses likelihood on a trimmed distribution of F ST to infer the distribution of F ST for neutral markers and then detect outliers. We set to 0.05 the fraction of loci that were trimmed from both the lower and the upper ends of the range of F ST before applying the likelihood function. The minimum heterozygosity required before including calculations from a locus was set to 0.1, and the false discovery threshold was set to 0.05 to correct for multiple tests. We also used the program bayescan 2.1 (Foll & Gaggiotti, 2008), setting the prior odds of the neutral model to 100 and leaving the remaining parameters with default values, including setting a false discovery threshold = 0.05 to control for multiple tests. For both approaches, we recorded the number and identity of the outlier loci that resulted in each pairwise comparison. We evaluated the relationship between pairwise genetic distance (F ST) and the number of outlier loci obtained with each method as a function of geographical distances separating comparisons by phenotype (spotted–spotted; spotted–plain; plain–plain). We then performed a Multiple Matrix Regression with Randomization (Wang, 2013) to compare, in a quantitative framework, the relationship between genetic and geographical distances among the previously mentioned phenotype combinations. Since previous results indicated that Norwegian samples are highly divergent from the rest, we included in the model one slope and intercept for pairwise comparisons that included one of the Norwegian samples, and one slope and intercept for pairwise comparisons that did not (this also includes the Norway plain–spotted comparison).
2.7.1. Locating and functionally annotating outlier loci
Finally, to test if outlier loci were physically grouped or scattered, we retrieved the consensus sequences of all outlier loci following (Casas et al., 2018) and aligned them to the draft genome of L. bergylta (BallGen_V1) (Lie et al., 2018). Although this genome is highly fragmented, the alignment of outliers provides a rough idea of the degree of clustering of these SNPs and the identity of genes in the regions where they are located. blastn (blast+ version 2.8.1) with an e‐value cutoff of 1e−35 was used to map the contigs to the reference genome and for annotation against the nr database using default parameters (Altschul et al., 1990).
2.8. Characterization of visual opsin genes in L. bergylta
Opsin gene sequences and their copy number were identified comparing the L. bergylta draft genome against the sequences of known fish opsin genes by tblastx (e‐value < 1e−5) and blastn (e‐value < 1e−5) as described by Lin et al. (2017) (Table S2). Primer sequences were designed based on the predicted coding sequences. The genes were amplified as either one (LWS1, LWS2, Rh1, Rh2‐3 and Rh2‐4), two (Rh2‐2, SWS1a and SWS1b) or three (Rh2‐1, SWS2B) fragments, depending on the size of the introns and the presence of multiple copies. A complete list of primers and their amplification conditions is provided in Table S2. The genomic DNA of 10 individuals (five plain and five spotted) from the south (Vigo and Malpica) was used in the analysis. Additionally, opsin LWS1 was analysed in five individuals from Norway displaying different colour indexes (P50, P75, P100, S75 and S100). Amplification of the opsin genes with a unique copy in the L. bergylta genome was performed in volumes of 25 µl containing 100 ng of DNA using the Qiagen Taq DNA Polymerase by following the manufacturer's recommendations. Opsin genes with multiple copies, LWS and Rh2, were amplified using the Platinum SuperFi DNA Polymerase (Invitrogen). Bands were excised from the gel and cleaned using a QIAquick Gel Extraction Kit (Qiagen). These were then cloned using a TOPO TA Cloning Kit (Invitrogen) and transformed into TOP10 chemically competent cells according to the manufacturer's instructions. Ten white colonies per individual were selected, and plasmid DNA was isolated using a PureLink Quick Plasmid Miniprep Kit (Thermo Fisher Scientific). Sequencing reactions were carried out in both directions using the same primer pairs used for amplification and universal primer M13, respectively. Consensus sequences were produced using clustalx software (version 2.1) and included sequences for all introns except the first intron in SWS1 that was over 3000 bp of repetitive sequence. Their identities were confirmed by blast searches against GenBank.
3. RESULTS
3.1. SNP genotyping
We obtained a total of 1,877,808,569 paired‐end sequences. From these, 84% passed our quality filters and were built into stacks. The mean number of reads retained per sample was 12,518,724 (min: 345,032; max: 40,914,585). The mean depth of coverage per sample was 17.29× (min: 4.79×; max: 55.31×). The final catalogue consisted of 466,953 loci, composed of 147,377,536 bp. Of these, 1,765,665 were variable. We excluded six samples that had a depth of coverage <10× or that had more than 5% missing data. From the 144 individual samples remaining in the data set, 113,055 loci passed population (present in all sites) and sample (present in 90% of samples) constraints. These included 48,996,128 bp, of which 39,602 were variable biallelic SNPs that complied with the remaining filtering constraints. These constitute the final data set used in further analyses (see Table S1 and supporting materials for a full description of data statistics).
We calculated the mean heterozygosity and genetic diversity (π) across all 39,602 loci for the 144 individuals according to their geographical origin (Figure 1b) and their assigned phenotype (P or S) as a proxy of the genetic variability within the populations. Interestingly, the mean heterozygosity in specimens from Norway was lower than in individuals from all other locations (Figure S2). The same was observed for genetic diversity (Table S3).
3.2. Inferring population genetic structure
3.2.1. Principal components analysis
A PCA performed with all loci revealed different groupings according to the populations and morphs. The first component (PC1; Figure 2a,b) separated samples from Norway from the rest. Principal component 2 (PC2) grouped samples by morphotype with plain and spotted morphotypes from both Spanish localities occupying opposite ends of the distribution (Figure 2a,c). All other samples from France and Ireland fell in between. The third component (PC3) further separated samples from Spain (irrespective of the phenotype) from samples from Ireland and France, which clustered together (Figure 2b,c). The combination of PC2 and PC3 (Figure 2c) separates both morphotypes from Spain and to some degree samples from France and from Ireland, but samples from France displaying the plain morphotype cluster with those from Ireland. Principal component scores were visualized also with samples classified according to the assigned colour indexes (P100, P75, P50, S75, S100), but no evidence of unaccounted genetic variation associated with these intermediate phenotypes was found (Figure S3).
FIGURE 2.
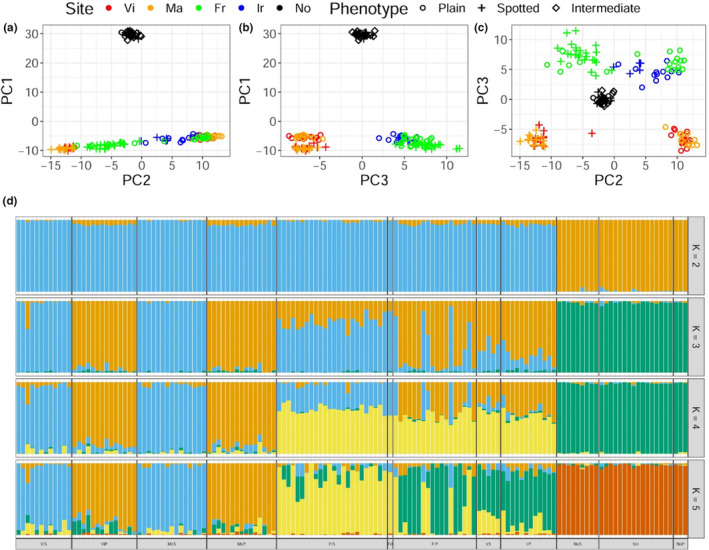
Genome‐wide SNP‐based genetic structure of Labrus bergylta across its distribution range. (a–c) Principal components analysis (PCA) of allele frequency data from all loci, where colour corresponds to geographical origin and morphotype is indicated by a symbol. Codes are as follows: red, Vi (Vigo, Spain); orange, Ma (Malpica, Spain) (parapatric populations); green, Fr (France); blue, Ir (Ireland); and black, No (Norway); o = spotted; + = plain; ♢ = intermediate. (d) Individual ancestries inferred with sNMF for different values of K (K = 2–5). Codes are as follows: S – spotted, P – plain, I – Intermediate; Vi (Vigo, Spain); Ma (Malpica, Spain); Fr (France); Ir (Ireland); No (Norway) [Colour figure can be viewed at wileyonlinelibrary.com]
3.2.2. Clustering analysis
Clustering of samples by Hardy–Weinberg equilibrium (HWE) with sNMF revealed that values of K = 2–4 were the most likely configuration according to the cross‐entropy criterion (Figure S1). Individual ancestry coefficients for K = 2 to K = 5 are shown in Figure 2d. Genetic clusters identified by sNMF are congruent with PCA results, separating the samples from south, central and north Atlantic European waters (Figure S4). For K = 2, there is a clear separation of Norwegian samples from all the rest irrespective of the phenotype. For K = 3, samples from both locations in Spain are separated by phenotypes, while samples from France and Ireland display different levels of admixture. Interestingly, admixture is more pronounced in Ireland where all samples tend to group with the genetic cluster associated with the plain phenotype. In France, despite admixture, ancestry coefficients match specific phenotypes except for five plain specimens and one specimen with an intermediate phenotype (P75) that displayed spotted ancestry. Finally, K = 5 separates all samples by location and not by phenotype, except for the two sites in Spain where they are only separated by phenotype.
3.3. Estimating phylogeny and population history
Phylogenetic analyses (maximum‐likelihood) based on the sequences of 70,468 concatenated loci were carried out to estimate the phylogenetic relationships among individuals of L. bergylta (Figure S5). We found strong support for the genetic differentiation of plain and spotted individuals in Spain, moderate support for France and Ireland, and a complete mix of both phenotypes in Norway. Norwegian samples appear to be highly distinct from the remaining samples.
Finally, the treemix population tree inferred without admixture events (Figure 3a) was congruent to the results obtained with the PCA (Figure 2a–c). Norwegian samples appear as the most divergent populations. The second split separates samples from Spain (plain phenotype) from the rest of the populations. Further splits include populations from Ireland and France (both phenotypes), and the last split includes populations from Spain of the spotted phenotype. This tree explains 99.8% of the variance in relatedness between populations. Although the variance explained with the null model was high, it was not evenly distributed (Figure 3b), and thus we proceeded to add migration events. We only report alternative models with one and two migration events (Figure 3c,d) as they explained 99.9% of the variance. Both migration events suggest gene flow from spotted to plain populations (France to France and Spain to Norway). Three population (f3) tests associated with these events were all significant (p < .00001; Table S4).
FIGURE 3.
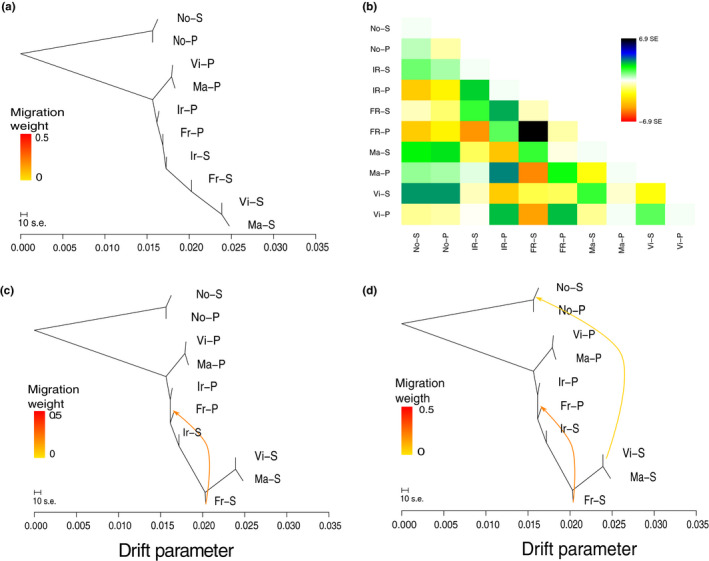
Population relationships and migration events inferred by treemix. Inferred population trees without (a) and with one (c) and two (d) migration events. The migration arrows are coloured according to their weight, where the weight is correlated with the ancestry fraction. Horizontal branch lengths are proportional to the amount of genetic drift that has occurred in each branch. (b) The distribution of scaled residual fit from the maximum‐likelihood tree shown in (a). Codes are as follows: S – spotted, P – plain; Vi (Vigo, Spain); Ma (Malpica, Spain); Fr (France); Ir (Ireland); No (Norway) [Colour figure can be viewed at wileyonlinelibrary.com]
3.4. Screening for loci under positive selection
To explore whether differential selection is acting on the colour morphotypes, we evaluated the relationship between pairwise F ST and geographical distance, which differed among phenotype comparisons. A significant positive isolation by distance (IBD) relationship was found for spotted–spotted comparisons regardless of whether the data set included or excluded Norway (common slope = 0.000086; p < .001). The IBD slope was not different from zero for either spotted–plain comparisons (with Norway: p = .540; without Norway: .884) or plain–plain comparisons (with Norway: p = .529; without Norway: .076; Figure 4, Table 1). These results indicate stronger restrictions to gene flow between spotted populations compared with plain. Pairwise outlier analyses using two different programs revealed the presence of up to 435 outliers (total of different outliers identified by both programs). We found differences between the number of outliers detected with outflank and bayescan. Only 46 outliers were common between both approaches. However, both approaches concurred in that (i) very few outlier loci were detected in spotted–spotted or plain–plain comparisons; (ii) the top 10 ranked spotted–plain comparisons in terms of number of outliers involved at least one sample from Spain and did not involve samples from Norway; and (iii) spotted–plain comparisons with the highest number of outliers involved sites that were less than 750 km apart, and the number of outliers decreased sharply in comparisons separated by more than 750 km (Figure 4, Table 1). Interestingly, the comparisons with the highest pairwise F ST values were not the ones that displayed the highest number of outliers (Figure S6).
FIGURE 4.
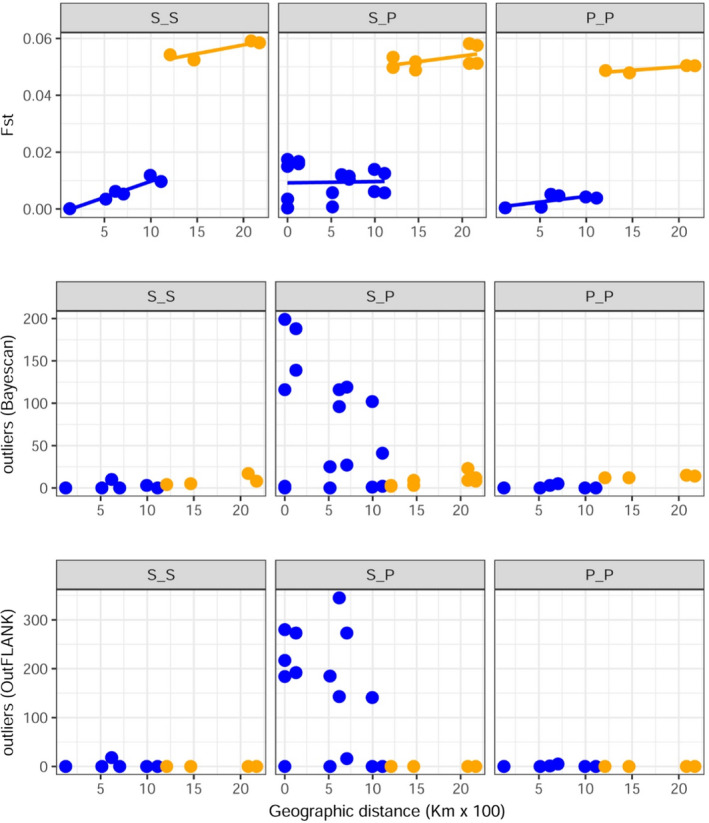
Relationships between pairwise F ST and number of outliers with geographical distance of Labrus bergylta morphotypes. Scatter plots of pairwise comparisons of F ST (top panel) and number of outliers (central and bottom panels) with geographical distance. Blue colour indicates pairwise comparisons that do not include Norway, while orange indicates comparisons that include Norway. Lines in the top panel were estimated using Multiple Matrix Regression with Randomization. S indicates spotted; P indicates plain. [Colour figure can be viewed at wileyonlinelibrary.com]
TABLE 1.
Summary of pairwise comparisons between plain–spotted phenotypes of Labrus bergylta across the North Atlantic. Ma indicates Malpica, Vi indicates Vigo
| Site 1 | Site 2 | Pheno 1 a | Pheno 2 b | outflank c | bayescan d | F ST e | Dist f |
|---|---|---|---|---|---|---|---|
| Spain (Ma) | Spain (Ma) | Spotted | Plain | 280 | 199 | 0.0175 | 0 |
| Spain (Vi) | Spain (Ma) | Plain | Spotted | 273 | 188 | 0.0167 | 127 |
| Spain (Vi) | Spain (Ma) | Spotted | Plain | 192 | 139 | 0.0159 | 127 |
| Spain (Vi) | France | Plain | Spotted | 273 | 119 | 0.0115 | 706 |
| Spain (Ma) | France | Plain | Spotted | 345 | 116 | 0.0121 | 619 |
| Spain (Vi) | Spain (Vi) | Spotted | Plain | 184 | 116 | 0.0150 | 0 |
| Spain (Ma) | Ireland | Spotted | Plain | 141 | 102 | 0.0139 | 995 |
| Spain (Ma) | France | Spotted | Plain | 143 | 96 | 0.0118 | 619 |
| Spain (Vi) | Ireland | Spotted | Plain | 0 | 41 | 0.0125 | 1111 |
| Spain (Vi) | France | Spotted | Plain | 16 | 27 | 0.0105 | 706 |
| France | Ireland | Spotted | Plain | 185 | 25 | 0.0057 | 515 |
| Spain (Ma) | Norway | Spotted | Plain | 0 | 23 | 0.0582 | 2083 |
| Spain (Ma) | Norway | Spotted | Spotted | 0 | 17 | 0.0591 | 2083 |
| Spain (Ma) | Norway | Plain | Plain | 0 | 15 | 0.0504 | 2083 |
| Spain (Vi) | Norway | Plain | Plain | 0 | 14 | 0.0504 | 2172 |
| Spain (Vi) | Norway | Spotted | Plain | 0 | 12 | 0.0575 | 2172 |
| France | Norway | Plain | Plain | 0 | 12 | 0.0479 | 1466 |
| Ireland | Norway | Plain | Plain | 0 | 12 | 0.0487 | 1209 |
| Spain (Ma) | France | Spotted | Spotted | 18 | 10 | 0.0062 | 619 |
| Spain (Ma) | Norway | Plain | Spotted | 0 | 9 | 0.0512 | 2083 |
| France | Norway | Spotted | Plain | 0 | 9 | 0.0518 | 1466 |
| Spain (Vi) | Norway | Spotted | Spotted | 0 | 8 | 0.0585 | 2172 |
| Spain (Vi) | Norway | Plain | Spotted | 0 | 8 | 0.0512 | 2172 |
| Spain (Vi) | France | Plain | Plain | 5 | 5 | 0.0047 | 706 |
| France | Norway | Spotted | Spotted | 0 | 5 | 0.0524 | 1466 |
| Ireland | Norway | Spotted | Spotted | 0 | 4 | 0.0542 | 1209 |
| Spain (Ma) | France | Plain | Plain | 1 | 3 | 0.0052 | 619 |
| Spain (Ma) | Ireland | Spotted | Spotted | 0 | 3 | 0.0119 | 995 |
| France | Norway | Plain | Spotted | 0 | 3 | 0.0489 | 1466 |
| Ireland | Norway | Plain | Spotted | 0 | 3 | 0.0498 | 1209 |
| France | France | Spotted | Plain | 217 | 2 | 0.0035 | 0 |
| Spain (Vi) | Ireland | Plain | Spotted | 0 | 2 | 0.0057 | 1111 |
| Ireland | Norway | Spotted | Plain | 0 | 2 | 0.0534 | 1209 |
| Spain (Ma) | Ireland | Plain | Spotted | 0 | 1 | 0.0061 | 995 |
| Spain (Vi) | Spain (Ma) | Spotted | Spotted | 0 | 0 | 0.0001 | 127 |
| Spain (Vi) | France | Spotted | Spotted | 0 | 0 | 0.0053 | 706 |
| Spain (Vi) | Ireland | Spotted | Spotted | 0 | 0 | 0.0097 | 1111 |
| Spain (Vi) | Spain (Ma) | Plain | Plain | 0 | 0 | 0.0004 | 127 |
| Spain (Vi) | Ireland | Plain | Plain | 0 | 0 | 0.0039 | 1111 |
| Spain (Ma) | Ireland | Plain | Plain | 0 | 0 | 0.0042 | 995 |
| France | Ireland | Spotted | Spotted | 0 | 0 | 0.0035 | 515 |
| France | Ireland | Plain | Spotted | 0 | 0 | 0.0008 | 515 |
| France | Ireland | Plain | Plain | 0 | 0 | 0.0007 | 515 |
| Ireland | Ireland | Spotted | Plain | 0 | 0 | 0.0004 | 0 |
| Norway | Norway | Spotted | Plain | 0 | 0 | 0.0004 | 0 |
Phenotype 1.
Phenotype 2.
Number of outlier loci detected by outflank.
Number of outlier loci detected by bayescan.
Pairwise F ST.
Geographical distance (km).
In Figure 5 we present frequencies of all 46 loci detected by the two outlier detection methods used, for plain and spotted individuals separately from all five geographical locations sampled in the study. All of them show a remarkable gradual change in allele frequencies associated with the distribution range. While both parapatric Spanish populations (Vigo, Malpica) show allelic frequency patterns close to fixation between opposite alleles in each sympatric morphotype (plain–spotted), this correlation is lost northwards in France, Ireland and Norway. It is important to note that in Norway usually the allele associated with the plain phenotype in the southern regions is present in higher frequency, sometimes near fixation. Thus, allele frequencies of outlier loci change across the geographical range of L. bergylta, displaying a clear latitudinal gradient.
FIGURE 5.
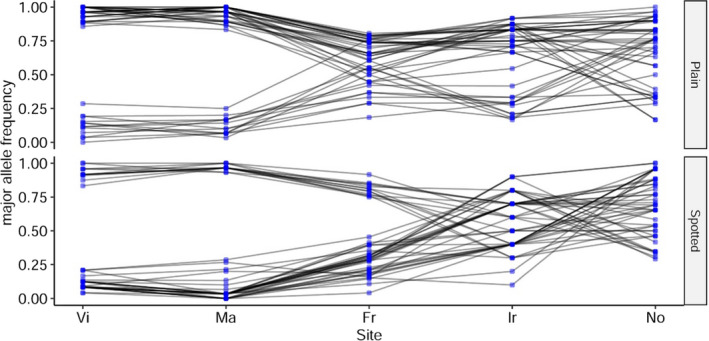
Allele frequency shifts at outlier loci across the distribution range. Blue dots indicate estimated major allele frequency per population of the 46 outlier loci that were common to both outlier detection methods. Black lines describe the trajectories (allele frequency changes) for each locus from south (Vi) to north (No). Sampling sites are indicated on the x axis and frequencies are presented separately for plain and spotted morphotypes. Codes are as follows: Vi, Vigo (Spain); Ma, Malpica (Spain); Fr, France; Ir, Ireland; and No, Norway [Colour figure can be viewed at wileyonlinelibrary.com]
3.4.1. Locating and functionally annotating outlier loci
The draft genome of L. bergylta provided a platform for mapping of outlier loci to investigate their genomic distribution. All outlier loci mapped to the L. bergylta genome with very high statistical supports (e‐values ≥ e‐38; Table S5). A clear nonrandom distribution across the genome was detected, with outliers being clustered into contiguous regions. Half of the outliers were mapped to 16 scaffolds out of 13,467, representing 3.85% of the total genome size (Table S6). Each of these scaffolds contained between nine and 30 outliers, which also displayed a nonrandom spatial distribution (see Table S7 and Figure S7). To investigate the identity of the outlier loci, the assembled RAD contigs flanking each outlier SNP were annotated (Table S5). Out of the 435 outlier loci, 26.2% (114) showed significant similarity to known protein coding sequences. However, only 42 of these had query coverages higher than 50%. Therefore, the identity of these predictions should be interpreted with caution.
3.5. Characterization of visual opsin genes in L. bergylta
RADseq only allows a partial exploration of the genome, and functional annotation of the amplified regions did not reveal any well‐known genes underlying sensory mate choice. Although the mechanisms underlying mate preference behaviour are largely unknown, divergent visual preferences have been linked to changes in visual perception in several fish species (Hench et al., 2019; Seehausen et al., 2008). Based on these studies, we investigated whether the visual system in L. bergylta could be acting as an early driver of the genetic differences detected between plain and spotted morphotypes. Individuals from the southern regions of the distribution range were analysed to explore a potential divergent evolution of vision‐related genes in relation to colour patterns.
The ballan wrasse exhibits a diverse palette of visual genes, including LWS1, LWS2, Rh1, Rh2‐1, Rh2‐2, Rh2‐3, Rh2‐4, SWS1A, SWS1B and SWS2B, with one of the long wavelength‐sensitive opsins, LWS1, having undergone pseudogenization (Table S2). Analysis of the sequences for all opsin genes in specimens from the south revealed only minor differences in intronic regions at the nucleotide level compared to genomic reference sequences. Inferred amino acid sequences were found to be conserved for all opsin genes between both morphotypes, while the pseudogene LWS1 reported in the genome assembly appeared to be fully functional (i.e., no premature stop‐codon was found in its coding region). This result was double‐checked by inferring the genomic sequence of LWS1 in five individuals from Norway because this is the geographical origin of the BioSample (SAMEA3939555) used for genome sequencing.
4. DISCUSSION
The genome‐wide analysis of sympatric, parapatric and allopatric populations of L. bergylta revealed a complex pattern of genetic differentiation that is highly congruent with the observed geographical gradient of morphological variation of the species. Our results also indicate the presence of a northern and genetically distinct lineage with lower genetic diversity that probably reflects the complex demographic history of the species. We can think of at least three alternative competing scenarios that could explain these results: (i) an early‐stage scenario of speciation where the strength of reproductive isolation among morphotypes declines drastically with latitude; (ii) early divergence of the Norwegian population, followed by the divergence that originated the two morphs in the south, with subsequent secondary contact between these southern populations; and (iii) early divergence of the Norwegian population, and early stages of ecologically driven speciation in the south. Given that the data and analyses presented in this work might not be sufficient to unambiguously rule in favour of one of them, the results are discussed below in the context of these alternative scenarios.
Our results unambiguously reveal a clear latitudinal gradient of genomic admixture strongly correlated to the variation in phenotypic morph frequencies observed across the distribution range of the species in the North Atlantic. Specimens sampled in southern areas (Vigo and Malpica [Spain]) showed a strongly bimodal genotypic clustering with no signs of admixture that closely mirrored the two distinct morphotypes that characterize this region (except for one spotted individual in Vigo that displayed around 45% of the plain ancestry). In addition, the strong signatures of divergent selection revealed by the outlier analyses and the low overall genomic differentiation among samples of the same morphotype in different locations suggest strong reproductive isolation between morphotypes in the south. Similar results have been reported in the arc‐eye hawkfish with colour morphs inhabiting the same area exhibiting higher genetic divergence than the same morphs in different geographical regions (Whitney et al., 2018). In contrast, specimens from the central and northern areas showed higher proportions of genetic admixture, in agreement with the decrease in the relative frequency of “pure” morphs and the increase of mixed phenotypes. Interestingly, outlier analyses indicated that signatures of divergent selection (outliers) were rare or absent when comparing these populations, even when comparisons involved the most divergent locations (Norway). Furthermore, our pairwise F ST comparisons and IBD analyses among samples of the same morph suggested that early developmental stages of this species from different localities and phenotypes can travel vast distances (Galarza et al., 2009). The reproductive strategy of the ballan wrasse includes a relatively long larval stage (Ottesen et al., 2012), which is consistent with our IBD results. treemix analysis supports two discrete migration events from the southern spotted populations towards the central and northern plain populations. It is important to note that treemix assumes that migration occurs at discrete points in time, and deviations from this assumption can result in biased interpretations. Therefore, these results should be interpreted with caution (Pickrell & Pritchard, 2012). We do note, however, that these results indicate that migration occurs only from southern to northern populations. All these results strongly suggest an increasing degree of reproductive isolation from north to south. We hypothesize that this possibly reflects the effects of different local selection pressures, more intense in the southern regions, preventing mating between plain and spotted phenotypes, compared to higher latitudes where specimens from different morphs do not show reproductive isolation even with the occasional migrant that appears to be arriving sporadically from southern localities.
Northernmost populations showed no difference in genetic composition despite having some degree of colour differences. This pattern could be the result of either lack of assortative mating in these populations or recent admixture between both morphs in the northernmost populations. However, the overall lower genetic diversity of Norwegian populations compared to all other samples contrasts with the higher genetic diversity expectations of recent admixture between divergent lineages (Comeault & Matute, 2018; Rius & Darling, 2014). Also, mitochondrial haplotypes of Norwegian populations are the most ancestral when other labrids are used as outgroups, suggesting that these populations are older and have been isolated longer than the other populations analysed. The low heterozygosity of Norwegian samples is also indicative of small effective population sizes or historical bottlenecks. Specimens from these Norwegian localities were also the most genetically distinct when compared to the rest of the samples, suggesting minimal gene flow between these populations and those located in lower latitudes of the distribution range. Interestingly, there was little evidence of loci that did not meet neutrality expectations for comparisons that involved samples from Norway; despite that, mean genomic differentiation of the same comparisons was the highest. These results indicate that neutral evolutionary processes have most likely shaped the divergence of these populations and coincide with previous studies in L. bergylta reporting a strong level of genetic differentiation between Norway and southerly European locations (Almada et al., 2016, 2017; D'Arcy et al., 2013). This phylogeographical break might be associated with a frontal system, known as the Ushant front, occurring along the northwestern Brittany coast. It has been described as a biogeographical transition zone between the temperate and cold‐temperate areas, acting as a barrier for larval transport and connectivity in several organisms, including invertebrates (Jolly et al., 2005) and fish (Zarraonaindia et al., 2012).
The data presented here also allow us to explore the genomic architecture of genomic differentiation in this system. Major questions remain concerning how differences are arrayed and embedded within the genome, and thus how genomes evolve during population divergence (Nosil & Feder, 2012). Two contrasting hypotheses defined by islands of divergence in a few genomic regions versus divergence spread across the genome are currently supported by different studies (Gagnaire et al., 2013; Malinsky et al., 2015; Michel et al., 2010; Puebla et al., 2014; Seehausen et al., 2014). Most outlier loci detected in our analysis were clustered in narrow regions, supporting the view of high differentiation in a few regions of the genome. Here, different colour morphs from the south seem to be characterized by low genome‐wide differentiation levels with genomic differences located in “islands of divergence” that are not randomly distributed across the genome. These results are compatible with the hypothesis of early stages of sympatric divergence that might precede speciation. Our findings are in line with a growing number of genomic studies of speciation (Hench et al., 2019; Larson et al., 2017; Marques et al., 2016; Sodeland et al., 2016), and support the view that functional reproductive isolation can persist in sympatry in a backdrop of extraordinary genomic similarity.
These modifications of the genetic structure underpin the differentiation between the two discrete morphs not only in colour and life‐history traits but also in behaviour, according to our hypothesis of colour assortative mating. Both morphotypes coexist in sympatry with complete habitat overlap, and despite their differences in life‐history strategies, the timing and duration of the spawning season coincide (Villegas‐Ríos, Alonso‐Fernández, Domínguez‐Petit, et al., 2013). Thus, we propose that body colour may be playing a pivotal role in facilitating speciation in the absence of impermeable geographical barriers, similarly to African lake cichlids where sexual selection on coloration has been shown to promote speciation (Kusche et al., 2015; Miyagi et al., 2012; Seehausen et al., 2008; Wagner et al., 2012). Although our data do not resolve the intrinsic mechanism associated with colour polymorphism and genetic differentiation, one appealing explanation for the observed gradient is that a combination of genetic and environmental factors influences colour pattern. Thus, differences in mating signals and preferences evolve because of divergent selection between habitats (Nosil & Feder, 2012). There is ample evidence of the evolution of reproductive isolation related to colour variation linked to environmental differences in fishes such as sticklebacks (Boughman, 2001), cichlids (Maan & Seehausen, 2010), snappers (Lythgoe et al., 1994), bluefin killifish (Fuller & Travis, 2004) and sailfin silversides (Gray et al., 2008). All these have in common that colour variations were associated with differences in water attributes that change the way different colours are perceived by conspecifics and appear to have driven reproductive isolation and genetic divergence. In sampled southern latitudes, competition for mating opportunities could be playing a role in differentiation in L. bergylta. While in hybridizing populations males compete for the same females, the competition pressure diminishes when colour patterns diverge, favouring the two differentiated morphs ahead of intermediate phenotypes (e.g., the Lake Malawi cichlid Metriaclima mbenjii and threespine stickleback; Bolnick et al., 2016; Pauers et al., 2008). Aggression biases could therefore have promoted the early establishment of new colour morphs, and facilitated coexistence among reproductively isolated phenotypes, while hampering intermediate morphs. Moreover, disruptive selection may favour extreme phenotypes in specific environments where intermediate phenotypes lie at a fitness minimum and are disfavoured (Hirsch et al., 2013).
In our study, we tested whether partial reproductive isolation between morphs could have its origin in mating preferences driven by differences in the spectral tuning of opsins that influence colour vision. Indeed, variation in visual pigment sensitivity of cone opsins has been proposed as a mechanism explaining mate‐choice decisions in various fish species leading to speciation processes (Hench et al., 2019; Kamijo et al., 2018; Kawata et al., 2007; Sakai et al., 2018; Seehausen et al., 2008; Terai et al., 2006). In L. bergylta, the nucleotide and predicted amino acid sequence of all opsin genes were found to be conserved between both sympatric morphotypes regardless of the geographical origin of the specimens. These results are at odds with the hypothesis that differences in the visual system promote reproductive isolation between plain and spotted individuals. Nonetheless, other mechanisms of tuning colour vision, such as differences in the relative expression of the opsin repertoire between both morphs, may also be implicated. The vast majority of studies reporting speciation driven by structural molecular differences in colour vision in sympatry have analysed species inhabiting heterogeneous light environments, but all of them have also focused on retrospective analyses (Meier et al., 2017; Sakai et al., 2018; Seehausen et al., 2008; Terai et al., 2006, 2017). Alternatively, differences in opsin coding sequences might happen at later stages of speciation or require an ecological speciation by adaptation to different environments.
Our results indicate that in this widely distributed species, its evolutionary history results in a geographical mosaic of genotypes that reflects the movement of genes, the impact of genetic bottlenecks and the effects of local selection pressures (Sork, 2016). The genetic differentiation and signatures of selection between sympatric spotted and plain morphs uncovered here suggest reproductive isolation taking place in the southern areas of the distribution range covered in the present study, which is also reflected in life‐history differences between both morphs (Villegas‐Ríos, Alonso‐Fernández, Fabeiro, et al., 2013; Villegas‐Ríos, Alós, et al., 2013). These findings are consistent with theoretical expectations of an early phase of sympatric speciation in the face of gene flow. Nonetheless, in the absence of evolutionary history data, we cannot completely rule out alternative scenarios of allopatric isolation of Norwegian populations or southern plain and spotted morphs followed by secondary contact. An initial period of allopatry, however, would have resulted in the accumulation of differences in the absence of gene flow, producing a neutral genome‐wide signature of divergence, and potentially with certain loci accumulating faster as a consequence of divergent selection if environmental conditions differ among different locations (Nosil et al., 2009). Our results do not seem to favour this scenario, as the number of outliers is the highest among different morphotypes that cohabit in the same space in Spain, where morphological differentiation is more pronounced, but genome‐wide levels of differentiation are lowest. In contrast, outliers are nearly absent among comparisons that involve Norwegian samples despite having the highest genome‐wide levels of differentiation. It is possible that the combination of high genome‐wide differentiation in Norway compared to other regions and lack of signatures of divergent selection (outliers) is the result of the combination of selective forces acting in allopatry, whose signals have been eroded because of small effective population sizes in these northern populations by strong past bottlenecks.
Finally, although our data cannot rule out with certitude either one of the “early phase of sympatric speciation with gene flow” or “allopatric divergence followed by secondary contact” scenarios, both share underlying mechanisms driving divergence and provide essential information on the mechanistic aspects of the architecture of reproductive isolation and early stages of speciation at the genomic level (Foote, 2018). Thus, this study system is useful to shed light on speciation mechanisms regardless of the origin of the divergence and the evolutionary fate of the plain and spotted colour morphs, which is beyond the scope of this study. Future analyses, including demographic history reconstruction and mating preference trials, could provide novel insights about the origin and maintenance of the patterns described here.
AUTHOR CONTRIBUTIONS
Conceived and designed the experiments: F.S.‐R., D.V.‐R. and X.I. Performed the fieldwork: F.S.‐R. and D.V.‐R. Performed the laboratory work: L.C. and P.S.‐A. Analysed the sequenced data and interpreted the data: L.C. and P.S.‐A. Wrote the paper: L.C. and P.S.‐A. Critically reviewed and edited the manuscript: P.S.‐A., F.S.‐R., D.V.‐R. and X.I. All authors approved the final version of the manuscript.
Supporting information
Supplementary Material
Table S1‐S7
ACKNOWLEDGMENTS
The authors would like to thank Gonzalo Bercedo and Laura Zamorano for their work with the opsins and Craig T. Michell for technical assistance with library construction. We would like to express our gratitude to Tony Robinet for providing the samples from the French coast. We would also like to thank KAUST as part of the work presented here was funded and performed at their facilities when L.C., P.S.‐A. and X.I. where members of the Red Sea Research Center. This project has received funding from the European Union's Horizon 2020 research and innovation programme under the Marie Sklodowska‐Curie grant agreement No. 793627 (BEMAR) awarded to D.V.‐R.
Laura Casas and Pablo Saenz‐Agudelo, listed in alphabetical order, contributed equally to this study.
European Union's Horizon 2020 research and innovation programme under the Marie Sklodowska‐Curie grant agreement 793627
Contributor Information
Laura Casas, Email: lalaucas@gmail.com.
Pablo Saenz‐Agudelo, Email: pablo.saenzagudelo@gmail.com.
DATA AVAILABILITY STATEMENT
The raw RAD sequence data set used in this study was submitted to the Sequence Read Archive under accession no. PRJNA577629. Opsin DNA sequences have been deposited in GenBank under accession nos. MN562561–MN562582.
REFERENCES
- Almada, F. , Casas, L. , Francisco, S. M. , Villegas‐Ríos, D. , Saborido‐Rey, F. , Irigoien, X. , & Robalo, J. I. (2016). On the absence of genetic differentiation between morphotypes of the ballan wrasse Labrus bergylta (Labridae). Marine Biology, 163(4), 86. 10.1007/s00227-016-2860-8 [DOI] [Google Scholar]
- Almada, F. , Francisco, S. M. , Lima, C. S. , FitzGerald, R. , Mirimin, L. , Villegas‐Ríos, D. , Saborido‐Rey, F. , Afonso, P. , Morato, T. , Bexiga, S. , & Robalo, J. I. (2017). Historical gene flow constraints in a northeastern Atlantic fish: Phylogeography of the ballan wrasse Labrus bergylta across its distribution range. Royal Society Open Science, 4(2), 160773. 10.1098/rsos.160773 [DOI] [PMC free article] [PubMed] [Google Scholar]
- Altschul, S. F. , Gish, W. , Miller, W. , Myers, E. W. , & Lipman, D. J. (1990). Basic local alignment search tool. Journal of Molecular Biology, 215(3), 403–410. 10.1016/S0022-2836(05)80360-2 [DOI] [PubMed] [Google Scholar]
- Bolnick, D. I. , Hendrix, K. , Jordan, L. A. , Veen, T. , & Brock, C. D. (2016). Intruder colour and light environment jointly determine how nesting male stickleback respond to simulated territorial intrusions. Biology Letters, 12(8), 20160467. 10.1098/rsbl.2016.0467 [DOI] [PMC free article] [PubMed] [Google Scholar]
- Boughman, J. W. (2001). Divergent sexual selection enhances reproductive isolation in sticklebacks. Nature, 411(6840), 944–948. 10.1038/35082064 [DOI] [PubMed] [Google Scholar]
- Casas, L. , Saenz‐Agudelo, P. , & Irigoien, X. (2018). High‐throughput sequencing and linkage mapping of a clownfish genome provide insights on the distribution of molecular players involved in sex change. Scientific Reports, 8(1), 4073. 10.1038/s41598-018-22282-0 [DOI] [PMC free article] [PubMed] [Google Scholar]
- Catchen, J. M. , Amores, A. , Hohenlohe, P. , Cresko, W. , Postlethwait, J. H. , & De Koning, D. J. (2011). Stacks: Building and genotyping loci de novo from short‐read sequences. G3: Genes, Genomes, Genetics, 1(3), 171–182. 10.1534/g3.111.000240 [DOI] [PMC free article] [PubMed] [Google Scholar]
- Comeault, A. A. , & Matute, D. R. (2018). Genetic divergence and the number of hybridizing species affect the path to homoploid hybrid speciation. Proceedings of the National Academy of Sciences USA, 115(39), 9761–9766. 10.1073/pnas.1809685115 [DOI] [PMC free article] [PubMed] [Google Scholar]
- Costello, M. J. (1991). Review of the biology of wrasse (Labridae: Pisces) in Northern Europe. Progress in Underwater Science, 16, 29–51. [Google Scholar]
- Crow, K. D. , Munehara, H. , & Bernardi, G. (2010). Sympatric speciation in a genus of marine reef fishes. Molecular Ecology, 19(10), 2089–2105. 10.1111/j.1365-294X.2010.04611.x [DOI] [PubMed] [Google Scholar]
- D'Arcy, J. , Mirimin, L. , & FitzGerald, R. (2013). Phylogeographic structure of a protogynous hermaphrodite species, the ballan wrasse Labrus bergylta, in Ireland, Scotland, and Norway, using mitochondrial DNA sequence data. ICES Journal of Marine Science, 70(3), 685–693. 10.1093/icesjms/fst018 [DOI] [Google Scholar]
- Darwall, W. R. T. , Costello, M. J. , Donnelly, R. , & Lysaght, S. (1992). Implications of life‐history strategies for a new wrasse fishery. Journal of Fish Biology, 41(sb), 111–123. 10.1111/j.1095-8649.1992.tb03873.x [DOI] [Google Scholar]
- Domeier, M. (1994). Speciation in the serranid fish Hypoplectrus . Bulletin of Marine Science, 54, 103–141. [Google Scholar]
- Elmer, K. R. , Lehtonen, T. K. , & Meyer, A. (2009). Color assortative mating contributes to sympatric divergence of neotropical cichlid fish. Evolution, 63(10), 2750–2757. 10.1111/j.1558-5646.2009.00736.x [DOI] [PubMed] [Google Scholar]
- Foll, M. , & Gaggiotti, O. (2008). A genome‐scan method to identify selected loci appropriate for both dominant and codominant markers: A Bayesian perspective. Genetics, 180(2), 977–993. 10.1534/genetics.108.092221 [DOI] [PMC free article] [PubMed] [Google Scholar]
- Foote, A. D. (2018). Sympatric speciation in the genomic era. Trends in Ecology & Evolution, 33(2), 85–95. 10.1016/j.tree.2017.11.003 [DOI] [PubMed] [Google Scholar]
- Frichot, E. , & François, O. (2015). LEA: An R package for landscape and ecological association studies. Methods in Ecology and Evolution, 6(8), 925–929. 10.1111/2041-210X.12382 [DOI] [Google Scholar]
- Frichot, E. , Mathieu, F. , Trouillon, T. , Bouchard, G. , & François, O. (2014). Fast and efficient estimation of individual ancestry coefficients. Genetics, 196(4), 973–983. 10.1534/genetics.113.160572 [DOI] [PMC free article] [PubMed] [Google Scholar]
- Fuller, R. C. , & Travis, J. (2004). Genetics, lighting environment, and heritable responses to lighting lighting environment affect male color morph expression in bluefin killifish, Lucania goodei . Evolution, 58(5), 1086–1098. 10.1111/j.0014-3820.2004.tb00442.x [DOI] [PubMed] [Google Scholar]
- Gagnaire, P. A. , Pavey, S. A. , Normandeau, E. , & Bernatchez, L. (2013). The genetic architecture of reproductive isolation during speciation‐with‐gene‐flow in lake whitefish species pairs assessed by RAD sequencing. Evolution, 67(9), 2483–2497. 10.1111/evo.12075 [DOI] [PubMed] [Google Scholar]
- Galarza, J. A. , Carreras‐Carbonell, J. , Macpherson, E. , Pascual, M. , Roques, S. , Turner, G. F. , & Rico, C. (2009). The influence of oceanographic fronts and early‐life‐history traits on connectivity among littoral fish species. Proceedings of the National Academy of Sciences USA, 106(5), 1473–1478. 10.1073/pnas.0806804106 [DOI] [PMC free article] [PubMed] [Google Scholar]
- Gray, S. M. , Dill, L. M. , Tantu, F. Y. , Loew, E. R. , Herder, F. , & McKinnon, J. S. (2008). Environment‐contingent sexual selection in a colour polymorphic fish. Proceedings of the Royal Society B: Biological Sciences, 275(1644), 1785–1791. 10.1098/rspb.2008.0283 [DOI] [PMC free article] [PubMed] [Google Scholar]
- Hench, K. , Vargas, M. , Höppner, M. P. , McMillan, W. O. , & Puebla, O. (2019). Inter‐chromosomal coupling between vision and pigmentation genes during genomic divergence. Nature Ecology & Evolution, 3(4), 657–667. 10.1038/s41559-019-0814-5 [DOI] [PubMed] [Google Scholar]
- Hirsch, P. E. , Eckmann, R. , Oppelt, C. , & Behrmann‐Godel, J. (2013). Phenotypic and genetic divergence within a single whitefish form – Detecting the potential for future divergence. Evolutionary Applications, 6(8), 1119–1132. 10.1111/eva.12087 [DOI] [PMC free article] [PubMed] [Google Scholar]
- Hoang, D. T. , Chernomor, O. , von Haeseler, A. , Minh, B. Q. , & Vinh, L. S. (2018). UFBoot2: Improving the ultrafast bootstrap approximation. Molecular Biology and Evolution, 35(2), 518–522. 10.1093/molbev/msx281 [DOI] [PMC free article] [PubMed] [Google Scholar]
- Hohenlohe, P. A. , Bassham, S. , Etter, P. D. , Stiffler, N. , Johnson, E. A. , & Cresko, W. A. (2010). Population genomics of parallel adaptation in threespine stickleback using sequenced RAD tags. PLoS Genetics, 6(2), e1000862. 10.1371/journal.pgen.1000862 [DOI] [PMC free article] [PubMed] [Google Scholar]
- Jolly, M. T. , Jollivet, D. , Gentil, F. , Thiébaut, E. , & Viard, F. (2005). Sharp genetic break between Atlantic and English Channel populations of the polychaete Pectinaria koreni, along the North coast of France. Heredity, 94(1), 23–32. 10.1038/sj.hdy.6800543 [DOI] [PubMed] [Google Scholar]
- Jombart, T. , Devillard, S. , & Balloux, F. (2010). Discriminant analysis of principal components: A new method for the analysis of genetically structured populations. BMC Genetics, 11(1), 94. 10.1186/1471-2156-11-94 [DOI] [PMC free article] [PubMed] [Google Scholar]
- Kalyaanamoorthy, S. , Minh, B. Q. , Wong, T. K. F. , von Haeseler, A. , & Jermiin, L. S. (2017). ModelFinder: Fast model selection for accurate phylogenetic estimates. Nature Methods, 14(6), 587–589. 10.1038/nmeth.4285 [DOI] [PMC free article] [PubMed] [Google Scholar]
- Kamijo, M. , Kawamura, M. , & Fukamachi, S. (2018). Loss of red opsin genes relaxes sexual isolation between skin‐colour variants of medaka. Behavioural Processes, 150, 25–28. 10.1016/j.beproc.2018.02.006 [DOI] [PubMed] [Google Scholar]
- Kawata, M. , Shoji, A. , Kawamura, S. , & Seehausen, O. (2007). A genetically explicit model of speciation by sensory drive within a continuous population in aquatic environments. BMC Evolutionary Biology, 7(1), 99. 10.1186/1471-2148-7-99 [DOI] [PMC free article] [PubMed] [Google Scholar]
- Keller, I. , Wagner, C. E. , Greuter, L. , Mwaiko, S. , Selz, O. M. , Sivasundar, A. , Wittwer, S. , & Seehausen, O. (2013). Population genomic signatures of divergent adaptation, gene flow and hybrid speciation in the rapid radiation of Lake Victoria cichlid fishes. Molecular Ecology, 22(11), 2848–2863. 10.1111/mec.12083 [DOI] [PubMed] [Google Scholar]
- Kusche, H. , Elmer, K. R. , & Meyer, A. (2015). Sympatric ecological divergence associated with a color polymorphism. BMC Biology, 13(1), 10.1186/s12915-015-0192-7 [DOI] [PMC free article] [PubMed] [Google Scholar]
- Larson, W. A. , Limborg, M. T. , McKinney, G. J. , Schindler, D. E. , Seeb, J. E. , & Seeb, L. W. (2017). Genomic islands of divergence linked to ecotypic variation in sockeye salmon. Molecular Ecology, 26(2), 554–570. 10.1111/mec.13933 [DOI] [PubMed] [Google Scholar]
- Lie, K. K. , Tørresen, O. K. , Solbakken, M. H. , Rønnestad, I. , Tooming‐Klunderud, A. , Nederbragt, A. J. , Jentoft, S. , & Sæle, Ø. (2018). Loss of stomach, loss of appetite? Sequencing of the ballan wrasse (Labrus bergylta) genome and intestinal transcriptomic profiling illuminate the evolution of loss of stomach function in fish. BMC Genomics, 19(1), 186. 10.1186/s12864-018-4570-8 [DOI] [PMC free article] [PubMed] [Google Scholar]
- Lin, J. J. , Wang, F. Y. , Li, W. H. , & Wang, T. Y. (2017). The rises and falls of opsin genes in 59 ray‐finned fish genomes and their implications for environmental adaptation. Scientific Reports, 7(1), 15568. 10.1038/s41598-017-15868-7 [DOI] [PMC free article] [PubMed] [Google Scholar]
- Lythgoe, J. N. , Muntz, W. R. A. , Partridge, J. C. , Shand, J. , & Williams, D. M. (1994). The ecology of the visual pigments of snappers (Lutjanidae) on the Great Barrier Reef. Journal of Comparative Physiology A, 174(4), 461–467. 10.1007/BF00191712 [DOI] [Google Scholar]
- Maan, M. E. , & Seehausen, O. (2010). Mechanisms of species divergence through visual adaptation and sexual selection: Perspectives from a cichlid model system. Current Zoology, 56(3), 285–299. 10.1093/czoolo/56.3.285 [DOI] [Google Scholar]
- Malinsky, M. , Challis, R. J. , Tyers, A. M. , Schiffels, S. , Terai, Y. , Ngatunga, B. P. , Miska, E. A. , Durbin, R. , Genner, M. J. , & Turner, G. F. (2015). Genomic islands of speciation separate cichlid ecomorphs in an East African crater lake. Science, 350(6267), 1493–1498. 10.1126/science.aac9927 [DOI] [PMC free article] [PubMed] [Google Scholar]
- Marques, D. A. , Lucek, K. , Meier, J. I. , Mwaiko, S. , Wagner, C. E. , Excoffier, L. , & Seehausen, O. (2016). Genomics of rapid incipient speciation in sympatric threespine stickleback. PLOS Genetics, 12(2), e1005887. 10.1371/journal.pgen.1005887 [DOI] [PMC free article] [PubMed] [Google Scholar]
- McLean, C. A. , & Stuart‐Fox, D. (2014). Geographic variation in animal colour polymorphisms and its role in speciation. Biological Reviews, 89(4), 860–873. 10.1111/brv.12083 [DOI] [PubMed] [Google Scholar]
- Meier, J. I. , Marques, D. A. , Mwaiko, S. , Wagner, C. E. , Excoffier, L. , & Seehausen, O. (2017). Ancient hybridization fuels rapid cichlid fish adaptive radiations. Nature Communications, 8(1), 14363. 10.1038/ncomms14363 [DOI] [PMC free article] [PubMed] [Google Scholar]
- Michel, A. P. , Sim, S. , Powell, T. H. Q. , Taylor, M. S. , Nosil, P. , & Feder, J. L. (2010). Widespread genomic divergence during sympatric speciation. Proceedings of the National Academy of Sciences USA, 107(21), 9724–9729. 10.1073/pnas.1000939107 [DOI] [PMC free article] [PubMed] [Google Scholar]
- Miglietta, M. P. , Faucci, A. , & Santini, F. (2011). Speciation in the Sea: Overview of the symposium and discussion of future directions. Integrative and Comparative Biology, 51(3), 449–455. 10.1093/icb/icr024 [DOI] [PubMed] [Google Scholar]
- Miyagi, R. , Terai, Y. , Aibara, M. , Sugawara, T. , Imai, H. , Tachida, H. , Mzighani, S. I. , Okitsu, T. , Wada, A. , & Okada, N. (2012). Correlation between nuptial colors and visual sensitivities tuned by opsins leads to species richness in sympatric Lake Victoria cichlid fishes. Molecular Biology and Evolution, 29(11), 3281–3296. 10.1093/molbev/mss139 [DOI] [PubMed] [Google Scholar]
- Momigliano, P. , Jokinen, H. , Fraimout, A. , Florin, A. B. , Norkko, A. , & Merilä, J. (2017). Extraordinarily rapid speciation in a marine fish. Proceedings of the National Academy of Sciences USA, 114(23), 6074–6079. 10.1073/pnas.1615109114 [DOI] [PMC free article] [PubMed] [Google Scholar]
- Munday, P. L. , van Herwerden, L. , & Dudgeon, C. L. (2004). Evidence for sympatric speciation by host shift in the sea. Current Biology, 14(16), 1498–1504. 10.1016/j.cub.2004.08.029 [DOI] [PubMed] [Google Scholar]
- Nguyen, L. T. , Schmidt, H. A. , von Haeseler, A. , & Minh, B. Q. (2015). IQ‐TREE: A fast and effective stochastic algorithm for estimating maximum‐likelihood phylogenies. Molecular Biology and Evolution, 32(1), 268–274. 10.1093/molbev/msu300 [DOI] [PMC free article] [PubMed] [Google Scholar]
- Nosil, P. , & Feder, J. L. (2012). Genomic divergence during speciation: Causes and consequences. Philosophical Transactions of the Royal Society B: Biological Sciences, 367(1587), 332–342. 10.1098/rstb.2011.0263 [DOI] [PMC free article] [PubMed] [Google Scholar]
- Nosil, P. , Harmon, L. J. , & Seehausen, O. (2009). Ecological explanations for (incomplete) speciation. Trends in Ecology & Evolution, 24(3), 145–156. 10.1016/j.tree.2008.10.011 [DOI] [PubMed] [Google Scholar]
- Ottesen, O. , Dunaevskaya, E. , & Arcy, J. (2012). Development of Labrus bergylta (Ascanius 1767) larvae from hatching to metamorphosis. Journal of Aquaculture Research & Development, 3, 127. 10.4172/2155-9546.1000127 [DOI] [Google Scholar]
- Paris, J. R. , Stevens, J. R. , & Catchen, J. M. (2017). Lost in parameter space: A road map for STACKS. Methods in Ecology and Evolution, 8(10), 1360–1373. 10.1111/2041-210X.12775 [DOI] [Google Scholar]
- Pauers, M. J. , Kapfer, J. M. , Fendos, C. E. , & Berg, C. S. (2008). Aggressive biases towards similarly coloured males in Lake Malawi cichlid fishes. Biology Letters, 4(2), 156–159. 10.1098/rsbl.2007.0581 [DOI] [PMC free article] [PubMed] [Google Scholar]
- Pickrell, J. K. , & Pritchard, J. K. (2012). Inference of population splits and mixtures from genome‐wide allele frequency data. PLoS Genetics, 8(11), e1002967. 10.1371/journal.pgen.1002967 [DOI] [PMC free article] [PubMed] [Google Scholar]
- Puebla, O. (2009). Ecological speciation in marine v. freshwater fishes. Journal of Fish Biology, 75(5), 960–996. 10.1111/j.1095-8649.2009.02358.x [DOI] [PubMed] [Google Scholar]
- Puebla, O. , Bermingham, E. , & Guichard, F. (2012). Pairing dynamics and the origin of species. Proceedings of the Royal Society B: Biological Sciences, 279(1731), 1085–1092. 10.1098/rspb.2011.1549 [DOI] [PMC free article] [PubMed] [Google Scholar]
- Puebla, O. , Bermingham, E. , Guichard, F. , & Whiteman, E. (2007). Colour pattern as a single trait driving speciation in Hypoplectrus coral reef fishes? Proceedings of the Royal Society B: Biological Sciences, 274(1615), 1265–1271. 10.1098/rspb.2006.0435 [DOI] [PMC free article] [PubMed] [Google Scholar]
- Puebla, O. , Bermingham, E. , & McMillan, W. O. (2014). Genomic atolls of differentiation in coral reef fishes (Hypoplectrus spp., Serranidae). Molecular Ecology, 23(21), 5291–5303. 10.1111/mec.12926 [DOI] [PubMed] [Google Scholar]
- Puritz, J. B. , Keever, C. C. , Addison, J. A. , Byrne, M. , Hart, M. W. , Grosberg, R. K. , & Toonen, R. J. (2012). Extraordinarily rapid life‐history divergence between Cryptasterina sea star species. Proceedings of the Royal Society B: Biological Sciences, 279(1744), 3914–3922. 10.1098/rspb.2012.1343 [DOI] [PMC free article] [PubMed] [Google Scholar]
- Quignard, J. P. , & Pras, A. (1986). Labridae. In Whitehead P. J. P., Bauchot M. L., Hureau J. C., Nielson J., & Tortonese E. (Eds.), Fishes of the North‐eastern Atlantic and the Mediterranean (pp. 19–942). UNESCO. [Google Scholar]
- Quintela, M. , Danielsen, E. A. , Lopez, L. , Barreiro, R. , Svåsand, T. , Knutsen, H. , Skiftesvik, A. B. , & Glover, K. A. (2016). Is the ballan wrasse (Labrus bergylta) two species? Genetic analysis reveals within‐species divergence associated with plain and spotted morphotype frequencies. Integrative Zoology, 11(2), 162–172. 10.1111/1749-4877.12186 [DOI] [PMC free article] [PubMed] [Google Scholar]
- Ravinet, M. , Faria, R. , Butlin, R. K. , Galindo, J. , Bierne, N. , Rafajlović, M. , Noor, M. A. F. , Mehlig, B. , & Westram, A. M. (2017). Interpreting the genomic landscape of speciation: A road map for finding barriers to gene flow. Journal of Evolutionary Biology, 30(8), 1450–1477. 10.1111/jeb.13047 [DOI] [PubMed] [Google Scholar]
- Reich, D. , Thangaraj, K. , Patterson, N. , Price, A. L. , & Singh, L. (2009). Reconstructing Indian population history. Nature, 461(7263), 489–494. 10.1038/nature08365 [DOI] [PMC free article] [PubMed] [Google Scholar]
- Rius, M. , & Darling, J. A. (2014). How important is intraspecific genetic admixture to the success of colonising populations? Trends in Ecology & Evolution, 29(4), 233–242. 10.1016/j.tree.2014.02.003 [DOI] [PubMed] [Google Scholar]
- Sakai, Y. , Kawamura, S. , & Kawata, M. (2018). Genetic and plastic variation in opsin gene expression, light sensitivity, and female response to visual signals in the guppy. Proceedings of the National Academy of Sciences USA, 115(48), 12247–12252. 10.1073/pnas.1706730115 [DOI] [PMC free article] [PubMed] [Google Scholar]
- Salzburger, W. , Niederstätter, H. , Brandstätter, A. , Berger, B. , Parson, W. , Snoeks, J. , & Sturmbauer, C. (2006). Colour‐assortative mating among populations of Tropheus moorii, a cichlid fish from Lake Tanganyika, East Africa. Proceedings of the Royal Society B: Biological Sciences, 273(1584), 257–266. 10.1098/rspb.2005.3321 [DOI] [PMC free article] [PubMed] [Google Scholar]
- Seehausen, O. (1997). Cichlid fish diversity threatened by eutrophication that curbs sexual selection. Science, 277(5333), 1808–1811. 10.1126/science.277.5333.1808 [DOI] [Google Scholar]
- Seehausen, O. , Butlin, R. K. , Keller, I. , Wagner, C. E. , Boughman, J. W. , Hohenlohe, P. A. , Peichel, C. L. , Saetre, G.‐P. , Bank, C. , Brännström, Å. , Brelsford, A. , Clarkson, C. S. , Eroukhmanoff, F. , Feder, J. L. , Fischer, M. C. , Foote, A. D. , Franchini, P. , Jiggins, C. D. , Jones, F. C. , … Widmer, A. (2014). Genomics and the origin of species. Nature Reviews Genetics, 15(3), 176–192. 10.1038/nrg3644 [DOI] [PubMed] [Google Scholar]
- Seehausen, O. , Terai, Y. , Magalhaes, I. S. , Carleton, K. L. , Mrosso, H. D. J. , Miyagi, R. , van der Sluijs, I. , Schneider, M. V. , Maan, M. E. , Tachida, H. , Imai, H. , & Okada, N. (2008). Speciation through sensory drive in cichlid fish. Nature, 455(7213), 620–626. 10.1038/nature07285 [DOI] [PubMed] [Google Scholar]
- Servedio, M. R. , Van Doorn, G. S. , Kopp, M. , Frame, A. M. , & Nosil, P. (2011). Magic traits in speciation: “magic” but not rare? Trend in Ecology & Evolution, 23(8), 389–397. 10.1016/j.tree.2011.04.005 [DOI] [PubMed] [Google Scholar]
- Sodeland, M. , Jorde, P. E. , Lien, S. , Jentoft, S. , Berg, P. R. , Grove, H. , Kent, M. P. , Arnyasi, M. , Olsen, E. M. , & Knutsen, H. (2016). “Islands of divergence” in the Atlantic cod genome represent polymorphic chromosomal rearrangements. Genome Biology and Evolution, 8(4), 1012–1022. 10.1093/gbe/evw057 [DOI] [PMC free article] [PubMed] [Google Scholar]
- Sork, V. L. (2016). Gene flow and natural selection shape spatial patterns of genes in tree populations: Implications for evolutionary processes and applications. Evolutionary Applications, 9(1), 291–310. 10.1111/eva.12316 [DOI] [PMC free article] [PubMed] [Google Scholar]
- Terai, Y. , Miyagi, R. , Aibara, M. , Mizoiri, S. , Imai, H. , Okitsu, T. , Wada, A. , Takahashi‐Kariyazono, S. , Sato, A. , Tichy, H. , Mrosso, H. D. J. , Mzighani, S. I. , & Okada, N. (2017). Visual adaptation in Lake Victoria cichlid fishes: Depth‐related variation of color and scotopic opsins in species from sand/mud bottoms. BMC Evolutionary Biology, 17(1), 200. 10.1186/s12862-017-1040-x [DOI] [PMC free article] [PubMed] [Google Scholar]
- Terai, Y. , Seehausen, O. , Sasaki, T. , Takahashi, K. , Mizoiri, S. , Sugawara, T. , Sato, T. , Watanabe, M. , Konijnendijk, N. , Mrosso, H. D. J. , Tachida, H. , Imai, H. , Shichida, Y. , & Okada, N. (2006). Divergent selection on opsins drives incipient speciation in Lake Victoria cichlids. PLoS Biology, 4(12), e433. 10.1371/journal.pbio.0040433 [DOI] [PMC free article] [PubMed] [Google Scholar]
- Via, S. (2009). Natural selection in action during speciation. Proceedings of the National Academy of Sciences USA, 106(Supplement_1), 9939–9946. 10.1073/pnas.0901397106 [DOI] [PMC free article] [PubMed] [Google Scholar]
- Villegas‐Ríos, D. , Alonso‐Fernández, A. , Domínguez‐Petit, R. , & Saborido‐Rey, F. (2013). Intraspecific variability in reproductive patterns in the temperate hermaphrodite fish, Labrus bergylta . Marine and Freshwater Research, 64(12), 1156. 10.1071/MF12362 [DOI] [Google Scholar]
- Villegas‐Ríos, D. , Alonso‐Fernández, A. , Domínguez‐Petit, R. , & Saborido‐Rey, F. (2014). Energy allocation and reproductive investment in a temperate protogynous hermaphrodite, the ballan wrasse Labrus bergylta . Journal of Sea Research, 86, 76–85. 10.1016/j.seares.2013.11.010 [DOI] [Google Scholar]
- Villegas‐Ríos, D. , Alonso‐Fernández, A. , Fabeiro, M. , Bañón, R. , & Saborido‐Rey, F. (2013). Demographic variation between colour patterns in a temperate protogynous hermaphrodite, the ballan wrasse Labrus bergylta . PLoS One, 8(8), e71591. 10.1371/journal.pone.0071591 [DOI] [PMC free article] [PubMed] [Google Scholar]
- Villegas‐Ríos, D. , Alós, J. , March, D. , Palmer, M. , Mucientes, G. , & Saborido‐Rey, F. (2013). Home range and diel behavior of the ballan wrasse, Labrus bergylta, determined by acoustic telemetry. Journal of Sea Research, 80, 61–71. 10.1016/j.seares.2013.02.009 [DOI] [Google Scholar]
- Wagner, C. E. , Harmon, L. J. , & Seehausen, O. (2012). Ecological opportunity and sexual selection together predict adaptive radiation. Nature, 487(7407), 366–369. 10.1038/nature11144 [DOI] [PubMed] [Google Scholar]
- Wang, I. J. (2013). Examining the full effects of landscape heterogeneity on spatial genetic variation: A multiple matrix regression approach for quantifying geographic and ecological isolation. Evolution, 67(12), 3403–3411. 10.1111/evo.12134 [DOI] [PubMed] [Google Scholar]
- White, N. , Snook, R. , & Eyres, I. (2020). The past and future of experimental speciation. Trends in Ecology & Evolution, 35(1), 10–21. 10.1016/j.tree.2019.08.009 [DOI] [PubMed] [Google Scholar]
- Whitlock, M. C. , & Lotterhos, K. E. (2015). Reliable detection of loci responsible for local adaptation: Inference of a null model through trimming the distribution of F(ST). The American Naturalist, 186(S1), S24–S36. 10.1086/682949 [DOI] [PubMed] [Google Scholar]
- Whitney, J. L. , Bowen, B. W. , & Karl, S. A. (2018). Flickers of speciation: Sympatric colour morphs of the arc‐eye hawkfish, Paracirrhites arcatus, reveal key elements of divergence with gene flow. Molecular Ecology, 27(6), 1479–1493. 10.1111/mec.14527 [DOI] [PubMed] [Google Scholar]
- Wolf, J. B. W. , Lindell, J. , & Backström, N. (2010). Speciation genetics: Current status and evolving approaches. Philosophical Transactions of the Royal Society B: Biological Sciences, 365(1547), 1717–1733. 10.1098/rstb.2010.0023 [DOI] [PMC free article] [PubMed] [Google Scholar]
- Zarraonaindia, I. , Iriondo, M. , Albaina, A. , Pardo, M. A. , Manzano, C. , Grant, W. S. , Irigoien, X. , & Estonba, A. (2012). Multiple SNP markers reveal fine‐scale population and deep phylogeographic structure in European anchovy (Engraulis encrasicolus L.). PLoS One, 7(7), e42201. 10.1371/journal.pone.0042201 [DOI] [PMC free article] [PubMed] [Google Scholar]
Associated Data
This section collects any data citations, data availability statements, or supplementary materials included in this article.
Supplementary Materials
Supplementary Material
Table S1‐S7
Data Availability Statement
The raw RAD sequence data set used in this study was submitted to the Sequence Read Archive under accession no. PRJNA577629. Opsin DNA sequences have been deposited in GenBank under accession nos. MN562561–MN562582.